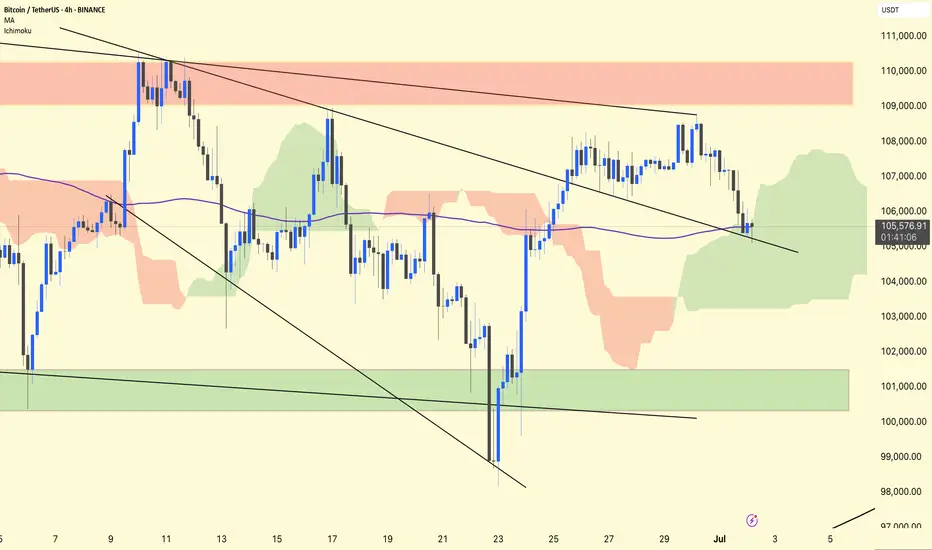
BTC/USDT 4H Analysis.
BTC remains in a retest phase after breaking out of the first descending broadening wedge.
The price has returned to test the upper wedge trendline, which is now acting as support around ~$105,500.
The purple 1 00-period MA (~105,570) overlaps this retest zone, adding additional confluence to the support.
Ichimoku
BTC is inside a green cloud, indicating indecision but not a confirmed trend reversal.
The cloud provides dynamic support in the ~$104,500–105,500 area.
Stay alert!
Btcanaliysis
Bitcoin (BTC/USDT) – Daily Chart Analysis. Bitcoin (BTC/USDT) – Daily Chart Analysis
Bitcoin has tested the overhead resistance and is currently retracing towards the $104k–$105k support area.
Moving Average (MA 25):
The price is slightly above the moving average, indicating that the medium-term trend is still bullish but faces resistance.
Pattern Formation:
There is a clear breakout from the inverted “V” pattern, and now the price appears to be retesting the breakout zone.
Scenario:
If BTC maintains support at ~$105k and bounces off again, a potential push towards $112k—$115k can be seen.
If the support fails, a deeper pullback towards $100k or below could occur.
Thanks for your support!
DYOR. NFA

BTC/USDT – Weekly Chart Analysis (Long-Term View)BTC/USDT Chart Pattern: Multi-Year Cup and Handle Formation
The chart shows a textbook “cup and handle” formation, a highly reliable bullish continuation pattern. This pattern has played out over several years (2021-2025), indicating long-term accumulation and a breakout attempt.
Cup Phase:
Extended from mid-2021 to early 2024.
Formed a deep and rounded base, often indicating institutional accumulation.
The rounded lows reflect a gradual sentiment recovery from the 2022-2023 bear market.
Handle Phase:
A short-term consolidation after moving above the $70,000-$74,000 resistance area.
Price action pulled back marginally after hitting $110,000, forming higher lows near $85,000.
The structure resembles a bull flag or pennant, which is usually seen before the next upward move.
Key Support and Resistance Areas:
Key Support $70,000–$74,000. Previous resistance turned into support
Psychological Support $85,000 Local Retracement Low
Immediate Resistance $100,000–$110,000 Near ATH, selling pressure area
Long-term Target $130,000+ Measured move from cup pattern
Volume: Volume was high during the breakout from late 2024 to early 2025, which validates the breakout from the cup resistance area.
If BTC breaks above $100,000–$110,000 with strong volumes, we can expect continuation towards:
$130,000 (short-term target)
$150,000–$180,000 (extension based on pattern symmetry)
Bearish Risks:
Failure to hold $85,000 could lead to a retest of the $70K support area.
Sustained breakdown below $70K would invalidate the bullish pattern, but this seems unlikely given the strong fundamentals and macro structure.
If you found this analysis helpful, hit the Like button and share your thoughts or questions in the comments below. Your feedback matters!
Thanks for your support!
DYOR. NFA

BTC/USDT Technical Analysis. Current Price: ~$94,600
BTC has cleanly broken above the descending trendline resistance, a structure that capped price since mid-February.
This breakout was accompanied by a surge in volume and momentum — a strong bullish sign.
Golden Cross Area
A key technical confluence occurred where the 50-day MA (red) and the 200-day MA (green) were tested simultaneously, marked by the blue circle.
Price moved sharply upward after reclaiming both MAs, suggesting increased buying confidence — a textbook golden cross behavior, even if not a perfect cross yet.
Support & Resistance Flip
Previous resistance at the GETTEX:92K —$93K zone (highlighted in yellow) has now become support.
As long as BTC holds this zone, it suggests healthy consolidation and potential for a continued move up.
Trend Indicators:
50-Day MA (Red): Now curving upward — short-term bullish momentum is building.
200-Day MA (Green): Flattening and starting to rise, showing early signs of a shift in long-term trend direction.
The price is currently above both MAs, which is a key bullish condition.
Key Levels to Watch:
Immediate Resistance: $96,000–$97,500
Major Psychological Barrier: $100,000
Support Zone: $91,500–$92,500
Stronger Support (if broken): $84,000–$85,000 near the MAs
If the price continues to hold above the breakout zone and consolidates well, the next upside target will be $ 100 K.
Failing to hold the GETTEX:92K zone could invite a pullback toward the MAs around $85K — a zone where bulls may step in again.
Final Thoughts:
BTC is showing signs of renewed bullish momentum after breaking key resistance and reclaiming critical MAs. However, confirmation through consolidation and volume is essential to sustain higher levels.
Structure remains bullish unless we see a breakdown below ~$85K with volume.
DYOR. NFA. Stay sharp.

BTC/USDT 4H Chart Update. Current Price: ~$78,336
BTC has broken below the symmetrical triangle and is testing the key horizontal support between $78,424 and $79,183.
A wick is visible below the support, but the candle closed within the area, indicating a potential fakeout or demand absorption.
Resistance (downtrend line): ~$85,500
Support Zones:
Primary: $78,424
Secondary: $79,183
Immediate Resistance: $82,000 – $83,000 (recent breakdown zone)
Outlook & Scenarios:
Bullish Reversal Scenario (Green Arrow):
The green arrow projection suggests a potential bounce from this demand zone.
If BTC reclaims $80K+ with strong momentum, it could aim for the descending trendline near $85K.
A bullish confirmation would be a 4H candle close above $80.5K–$81K.
Bearish continuation (if support fails):
If the price fails to hold this support zone, the next downside targets could be:
$76,000
$73,500
Sentiment factor:
The previous sentiment (Fear & Greed Index: 28 – Fear) reflects ongoing market caution.
Price action near key support in the fear zone could trigger a short squeeze or panic sell-off, depending on volume and reaction.
Summary:
BTC is at crucial support, and unless volume confirms a deeper breakdown, the bounce is likely to be short-lived.
Moving back above $80K would signal that bulls are regaining control.
Want any strategy ideas for trading this setup?
If you found this analysis helpful, hit the Like button and share your thoughts or questions in the comments below. Your feedback matters!
Thanks for your support!
DYOR. NFA

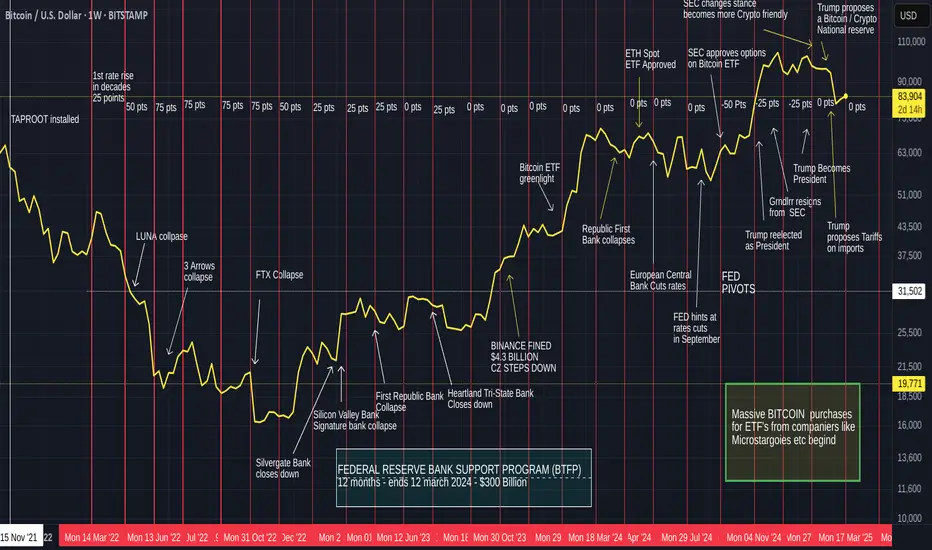
Bitcoin, interest rate effects, Macro events since 2021 - UPDATEThere is one very simple takeaway for me from this chart and that is simply that raises and Lowering of interest rates had Very little Effect on Bitcoin
It is more the effect it had on other organisations and the sentiment that followed Bitcoin and the traders.
For instance, From Jan 2023, when we saw Bitcoin begin its recovery, interest rates continued to rise.....and had NO effect on the Bitcoin recovery
And I think this continues to this day.
After the First push higher by Bitcoin in 2023, PA went into a Long range...in this time, interest rates began remaining at a static level. Bitcoin did not rise because of this.
When BTC was ready, it made a push higher again, interest rates were static and remained so while BTC entered another long range in 2024
It could be said that BTC PA rose once Rates were reduced but PA leveled out again even while the next rates decision was to reduce.
Bitcoin has its own agenda, it is NOT dependant on the USA to control its choices
On Each range, the MACD on the weekly timef rames was OVERBOUGHT.
And it is currently resetting having been overbought again.
This s NOTHING to do with interest rates.
MACRO events do have an impact though and we need to pay attention this this
But over all, Bitcoin is GOOD, BULLISH and getting ready for its next push
Have a Nice day now
BITCOIN Weekly Chart Update !!Bitcoin has completed a cup-and-handle breakout on the weekly timeframe, accompanied by strong volume, which signals robust bullish momentum. This pattern is typically a bullish continuation pattern, suggesting that BTC has the potential to enter a strong uptrend following this breakout.
The Ichimoku Cloud is also showing a bullish signal, with price action above the cloud, confirming a trend shift in favor of buyers. The cloud's bullish alignment suggests that the current rally has further room for upward movement, potentially setting BTC on course for new highs.
However, pullbacks are common after breakouts as the price retests the previous resistance as support. A pullback to the handle or prior resistance zone would provide an opportunity for bulls to gather strength before pushing Bitcoin to new peaks. Key support levels to watch include previous highs or areas around the handle region, which should act as a launching point for the next leg up if bulls hold steady.
Disclaimer: This analysis is for informational purposes and is not financial advice. Always stay updated with market movements and adjust your trading strategies as needed.
You can DM us for information on any other coin.
@Peter_CSAdmin

Here is a quick analysis based on the new BTC/USD chart.The chart shows a significant upward trend in Bitcoin's price. It seems that the price has broken out of the previous consolidation channel and is now heading towards a major ascending resistance area, the upper boundary of which represents nearly $100,000.
Bitcoin maintains an upward trajectory with strong support from the lower trend lines.
The $88,000 to $100,000 target area is a strong resistance area where we could see some price consolidation or rejection.
If BTC can break this resistance with strong momentum, it could signal a substantial long-term bullish phase.
Be wary of potential pullbacks as BTC approaches these key resistance areas. Let me know if you would like more information on specific indicators or trendlines!
Disclaimer: This analysis is for informational purposes and is not financial advice. Always stay updated with market movements and adjust your trading strategies as needed.
You can DM us for information on any other coin.
@Peter_CSAdmin

BTC/USDT 4HOUR UPDATE !!Hello friends, welcome to this BITCOIN update from Crypto Sanders.
Chart Analysis:- Hello friends, what do you think after seeing the chart? Please comment on the BTC 4-HOUR update.
BTC is presently exhibiting a symmetrical triangle pattern, with resistance from the Ichimoku cloud and the 100-day moving average. Moreover, the MACD crossover suggests a potential shift toward bullish momentum. Thus, it is prudent to exercise patience and await a clear breakout or breakdown of the triangle for confirmation of the upcoming direction.
I have tried to bring the best possible results in this chart.
If you like it, hit the like button and share your charts in the comments section.
Thank you.

BTC/USDT 1DAY UPDATE BY CRYPTOSANDERS !!Hello friends, welcome to this BITCOIN update from Crypto Sanders.
Chart Analysis:- Bitcoin (BTC) retreated below the 27,000 level to start the weekend, after a late surge in price on Friday.
Following a low of 26,686.32 earlier in Friday’s session, BTC/USD peaked at a high of 27,092.70 as the day progressed.
BTC has since slipped, and is currently trading at 26,866.74, it is still higher than yesterday’s bottom.
The consolidation comes as the relative strength index (RSI) continues to hover above a floor at the 45.00 mark.
Whilst now tracking at 46.72, the next target is likely to be at a ceiling of 50.00, and if hit, bitcoin will be back above 27,000.
bitcoin is trading 4% lower than at the same point last week.
I have tried to bring the best possible results in this chart.
If you like it, hit the like button and share your charts in the comments section.
Thank you.

BTC/USDT 1DAY UPDATE BY CRYPTOSANDERS !!Hello friends, welcome to this BITCOIN update from Crypto Sanders.
Chart Analysis:-Bitcoin (BTC) continued to trade close to a key price ceiling on Thursday, ahead of tomorrow’s NFP report.
BTC/USD peaked at 27,875.59 earlier in the day, following a low of 27,339.27 the day before.
The move pushed Bitcoin closer to a recent resistance level of 27,900, however, bulls could not capture this point.
Earlier gains have since faded, which comes as the relative strength index (RSI) encountered some turbulence of its own.
the index is at a reading of 60.21, which is marginally below a ceiling of 63.00
Should this decline continue, price strength could land at a floor of 58.00 in the not-too-distant future.
I have tried to bring the best possible results in this chart.
If you like it, hit the like button and share your charts in the comments section.
Thank you.

Can BTC Bounce From Here? Note the update !!Hello friends, welcome to this Bitcoin update from Crypto Sanders.
Chart Analysis:- After strong gains a day earlier, Bitcoin fell marginally on Thursday as crypto markets consolidated.
BTC/USD fell to an intraday low of 26,111.46 less than 24 hours after getting close to a breakout above the 27,000 level.
Overall, it appears that as the market approaches a point of uncertainty, traders have opted for safe profits.
On the 14-day Relative Strength Index (RSI) this area appears to be 51.00.
Strength in price is seen at 49.64 level, Bitcoin is now trading at 26,481.46.
Should the bulls move beyond this point, there is a good chance that the price could move back above 27,000.
I have tried to bring the best possible results in this chart.
If you like it, hit the like button and share your charts in the comments section.
Consider following me for the latest updates and long/short calls on almost every exchange.
I also post short mid and long-term trade setups.
Thank you.

A Brief History of the Bitcoin Halving Here. Hello, welcome to this BTC HALVING update.
Bitcoin (BTC) halving is an event that occurs approximately every four years in the Bitcoin network. During a halving event, the reward that miners receive for validating and adding new blocks to the blockchain is reduced by half. This event is programmed into the Bitcoin protocol and serves several purposes:
Supply Control: Bitcoin halving is a mechanism to control the inflation of the cryptocurrency. By reducing the reward that miners receive, the rate at which new bitcoins are created slows down. This scarcity can potentially drive up the price of Bitcoin if demand remains or increases.
Scheduled Issuance: It ensures a predictable issuance schedule for Bitcoin. Every 210,000 blocks, or roughly every four years, the reward for mining new blocks is halved. This predictable schedule helps users and investors plan for the future supply of Bitcoin.
Security: The halving also plays a role in the security of the Bitcoin network. As the block reward decreases, miners are incentivized to continue securing the network through transaction validation and block creation by transaction fees. This transition from block rewards to transaction fees is expected to be a key driver of miner incentives as Bitcoin's supply approaches its maximum limit of 21 million coins.
Here's a brief history of Bitcoin halvings:
First Halving: November 28, 2012 - The block reward was reduced from 50 BTC to 25 BTC.
Second Halving: July 9, 2016 - The block reward was reduced from 25 BTC to 12.5 BTC.
Third Halving: May 11, 2020 - The block reward was reduced from 12.5 BTC to 6.25 BTC.
The next halving is expected to occur approximately every four years, reducing the block reward by half each time until the maximum supply of 21 million bitcoins is reached, which is estimated to happen in the year 2140. These halving events are closely watched by the cryptocurrency community and can have an impact on Bitcoin's price and overall ecosystem.
I have tried to bring the best possible outcome to this chart.
Hit the like button if you like it and share your charts in the comments section.
Thank you.

BTC/USDT 1DAY UPDATE BY CRYPTOSANDERS !!Hello, welcome to this BTC/USDT update by CRYPTO SANDERS.
CHART ANALYSIS:- Bitcoin was back in the green on Tuesday, as its price rebounded from a multi-week low during yesterday’s session.
BTC/USD peaked at 26,421.51 earlier today, which comes following a low of 26,011.47 the day prior.
Monday’s low saw the world’s largest cryptocurrency trade at its weakest point since September 13, after dropping below 25,800.
it appears that the rebound in price came as a result of the relative strength index (RSI), finding a floor of its own at 45.00.
price strength is now tracking at 45.84, with the next visible point of resistance at the 55.00 mark.
Should bulls reach the 55.00 level, there is a strong possibility that BTC will move close to the 27,000 zone.
I have tried to bring the best possible outcome to this chart.
Hit the like button if you like it and share your charts in the comments section.
Thank you

Current Market Status AND September Outlook. !!Hello, welcome to this BTC monthly update by CRYPTO SANDERS.
CHART ANALYSIS:- Current Market Status
The first fortnight of September has been largely non-eventful, with bitcoin mostly
consolidating below 26,500.
This comes as volatility in the market hovered close to a five-year low in August, with trading volume amongst exchanges falling by 52 billion.
as we move into the fall, there has been a slight rise in volatility, mostly led by a rise in both inflation and retail sales in the United States.
Markets have used this as confirmation that the Federal Reserve will hike rates later this week, which could lead to dollar strength.
September Outlook
Bitcoin peaked at 27,414.73 earlier in today’s session, following a low of 24,900 exactly a
week ago.
This has seen BTC/USD reach its highest level since August 31, 2023, and comes as the 10-day (red) and 25-day (blue) moving averages near an upward cross.
From the chart, the potential for this move has been on the cards for a while, however, it has finally taken place as volatility returned to the market.
Additionally, the relative strength index has now also moved past a key point of resistance at 53.00, which has been a thorn in the sight of bulls for the past few weeks.
The next real ceiling lies at 65.00, and should bulls be targeting this, there is a chance bitcoin (BTC) ends the month above 28,300.
I have tried to bring the best possible outcome to this chart.
Hit the like button if you like it and share your charts in the comments section.
Thank you

BTC/USDT 1DAY UPDATE BY CRYPTOSANDERS !!Hello, welcome to this BTC/USDT update by CRYPTO SANDERS.
CHART ANALYSIS:- Bitcoin surged to a multi-week high on Monday, as traders began to anticipate the upcoming Federal Reserve meeting.
BTC/USD rallied to an intraday high of 27,222.98 earlier today, following a low of 26,415.52 the day prior.
bitcoin climbed to its strongest point since August 31, when price peaked at 27,576.
Despite the rise in momentum, bulls may not be satisfied and are likely targeting a ceiling at the 28,000 mark.
Monday’s gain comes as the relative strength index (RSI) jumped past a ceiling of 53.00, and is now residing at 58.25.
A resistance level of 60.00 will likely be the next primary target for bulls in the market.
I have tried to bring the best possible outcome to this chart.
Hit the like button if you like it and share your charts in the comments section.
Thank you

BTC/USD 1DAY UPDATE BY CRYPTO SANDERS !!hello, welcome to this BTC/USDT update by CRYPTO SANDERS.
CHART ANALYSIS:- Bitcoin was trading marginally lower on Thursday, as the cryptocurrency moved below a key point of support.
BTC/USD bottomed out at 25,404.36 earlier in the day, less than 24 hours after peaking at 25,953.02.
The decline saw Bitcoin fall under a price floor of 25,600 before bulls intervened to send the cryptocurrency higher.
BTC is now trading at 25,701.34, which sees its price below 26,000 for a third straight day.
Although sentiment has been mostly bearish, price stability has largely remained, with traders so far avoiding a drop under 25,000.
This could be tested as we head towards next week, with several key economic announcements set to be released in the United States.
I have tried to bring the best possible outcome to this chart.
Hit the like button if you like it and share your charts in the comments section.
Thank you

BTC/USDT 1DAY UPDATE BY CRYPTO SANDERS !!Hello, welcome to this BTC/USDT update by CRYPTO SANDERS.
CHART ANALYSIS:- Bitcoin was trading below 26,000 on Labor Day, as volume in the cryptocurrency market was mostly lower.
BTC/USD slipped to an intraday low of 25,817.03 to start the week, following a high of 26,087.15 the day prior.
The decline pushed Bitcoin closer to a collision with support at $25,600, however, bulls have so far rejected this retracement.
This comes as the 14-day relative strength index (RSI) found a floor of its own at the 35.00 mark, helping to ease the bearish pressure.
the index is now tracking at 37.16, with the next visible resistance point at 43.00.
In the event that this ceiling is broken, BTC bulls will likely make advancements toward 28,000.
I have tried to bring the best possible outcome to this chart.
Hit the like button if you like it and share your charts in the comments section.
Thank you

BTC/USDT 1DAY UPDATE BY CRYPTO SANDERS !!Hello, welcome to this BTC/USDT update by CRYPTO SANDERS.
CHART ANALYSIS:- Bitcoin continued to trend lower on Saturday, as the bears were once again in control of crypto market sentiment.
Following a high of 28,148 on Tuesday, BTC/USD started the weekend falling to a low of 25,362.61.
The decline has come as a result of profit-taking, and also the changing economic climate in the United States.
Consumer spending is slowing, whilst the labor market remains tight as a result of increasing interest rates.
today’s decline pushed bitcoin below a key support point of 25,600, however, bulls have since reentered.
BTC is now trading at 25,818.66, with a target of 26,000 likely to be present throughout the weekend.
I have tried to bring the best possible outcome to this chart.
Hit the like button if you like it and share your charts in the comments section.
Thank you

BTC/USDT 1DAY UPDATE BY CRYPTO SANDERS !!hello, welcome to this BTC/USDT update by CRYPTO SANDERS.
CHART ANALYSIS:- Bitcoin moved back over the 28,000 level during the last several hours, following Grayscale’s court win over the Securities and Exchanges Commission.
After trading at a low of 25,998.08 earlier in the day, BTC/USD peaked at 28,089.34 late on Tuesday.
This pushed the world’s largest cryptocurrency to its highest point since August 17, when the price was on the cusp of 29,000.
Earlier gains have since fallen, as traders have seemingly captured profits, with bitcoin now trading at 27,353.52.
this comes as the relative strength index (RSI), reached a ceiling of 53.00, before falling lower.
the index is now tracking at 48.52.
I have tried to bring the best possible outcome to this chart.
Hit the like button if you like it and share your charts in the comments section.
Thank you

BTC/USDT 1DAY UPDATE BY CRYPTO SANDERS !!hello, welcome to this BTC/USDT update by CRYPTO SANDERS.
CHART ANALYSIS:- Bitcoin (BTC) was back in the green on Tuesday, as the cryptocurrency made marginal gains during today’s session.
The move came as Paypal announced its USD stablecoin, which will be hosted on the ethereum blockchain.
Following the news, CEO Dan Schulman said: “Our commitment to responsible innovation and compliance, and our track record delivering new experiences to our customers, provides the foundation necessary to contribute to the growth of digital payments through Paypal USD.”
BTC/USD rose to a peak of 29,402.65 on the news, following a low of 28,724.14 the day prior.
Today’s peak sees bitcoin trade at its highest point since last Wednesday when it was above 30,000.
Tuesday’s rally has also brought the 10-day (red) moving average to the cusp of an upwards crossover with its 25-day (blue) counterpart.
I have tried to bring the best possible outcome to this chart.
Hit the like button if you like it and share your charts in the comments section.
Thank you

BTC/USD 1DAY UPDATE BY CRYPTO SANDERS !!hello, welcome to this BTC/USDT update by CRYPTO SANDERS.
CHART ANALYSIS:- Bitcoin (BTC) continued to hover near the 29,000 level to start the week, as market volatility was mostly muted on Monday.
After Sunday’s low at 28,963.83, BTC/USD jumped to a high of 29,166.82 earlier in today’s session.
The world’s largest cryptocurrency has mostly been trading between a support level of 28,800 and a resistance of $29,500 for the majority of the last week. the relative strength index (RSI) is also tracking near a floor of its own around the 42.00 mark.
In addition to this, the 10-day (red) moving average has begun to flatline following a downtrend, which is a sign of price stagnation.
Consolidation could likely continue until Wednesday’s inflation report in the United States.
I have tried to bring the best possible outcome to this chart.
Hit the like button if you like it and share your charts in the comments section.
Thank you

BTC/USD 1DAY UPDATE BY CRYPTO SANDERS !!hello, welcome to this BTC/USDT update by CRYPTO SANDERS.
CHART ANALYSIS:- Bitcoin (BTC) consolidated around the 29,000 level on Friday, as traders readied themselves for the upcoming U.S. nonfarm payrolls report.
BTC/USD rose to an intraday high of 29,375.71 in today’s session, following an earlier low of 29,066.24.
Earlier gains have since faded, however, with the world’s largest cryptocurrency now trading at the 29,145.77 mark.
The decline comes as the relative strength index (RSI) fell back toward a support point of 42.00.
After hitting a ceiling above 51.00 in recent days, price strength is now tracking at a reading of 43.71.
There is still optimism that bulls could reenter the market after today’s report, with the 29,500 level as an initial target.
I have tried to bring the best possible outcome to this chart.
Hit the like button if you like it and share your charts in the comments section.
Thank you
