BTCUSDT.1DThe daily chart for Bitcoin (BTC/USDT) illustrates a downward trend with a descending trendline that marks the resistance level (R1). Currently, Bitcoin is priced at $60,082.01, with a significant support level (S1) at $63,097.93, which it has recently broken through. The next support levels are at $59,065.59 (S2) and $56,226.29 (S3).
The resistance marked by the descending trendline and the resistance level (R2) at $74,007.06 highlight areas where sellers have previously entered the market, capping upward price movements. The price failing to maintain above S1 suggests that the bearish momentum may continue.
The RSI is at 36.25, which is close to being oversold, indicating that the market could potentially see a reversal or at least a temporary halt in the downward momentum if buyers step in. The MACD is below zero and shows a continuation of the bearish momentum as the histogram bars are expanding in the negative territory.
For traders, monitoring the price action near the next support levels (S2 and S3) could be critical. A rebound from these levels could provide long entry opportunities, ideally with confirmation from bullish divergence in the RSI or a bullish crossover in the MACD. If the price continues to decline through these supports, it could indicate a stronger bearish trend with lower targets in view. Conversely, a break above the trendline and R1 could signal a potential reversal to bullish conditions, targeting higher resistance levels.
Btcanalysis

📉 BTC Market Analysis 📊Recent Rejection and Retracement:
BTC faced rejection near $67,200 and retraced to $62,000, highlighting the importance of the support zone between $60,000 - $61,500.
Critical Support Level:
The support between $60,000 - $61,500 must hold to avoid potential further decline. A breach could lead to testing lower levels such as $56,000 - $58,000 or $52,000 - $53,800.
Market Sentiment:
May historically witnesses price downturns, raising caution.
BTC's movement may influence broader market trends.
🛑 Caution Ahead:
Maintain vigilance as BTC navigates critical support levels. Market sentiment may impact asset prices accordingly.
📉🔍 Stay informed and observant of market dynamics! #BTCAnalysis #CryptoMarket 🚀📉

🚀Bitcoin Is Ready to Go Up Again🚀🎉Hi guys, I hope that you have a great weekend .
🏃♂️Bitcoin is moving near the 🟢 Support zone($63,370-$62,790) 🟢. Also, Bitcoin managed to break the Resistance lines and is currently completing the pullback .
🌊According to Elliott's wave theory , Bitcoin seems to have completed wave 3 and is currently completing wave 4 .
🔔I expect Bitcoin to rise to at least the Potential Reversal Zone and upper Resistance line .
❗️⚠️Note⚠️❗️: An important point you should always remember is capital management and lack of greed.
Bitcoin Analyze ( BTCUSDT ), 15-minute time frame ⏰.
Do not forget to put Stop loss for your positions (For every position you want to open).
Please follow your strategy; this is just my Idea, and I will gladly see your ideas in this post.
Please do not forget the ✅' like '✅ button 🙏😊 & Share it with your friends; thanks, and Trade safe.

Bitcoin Is Ready to Fall⏰(1-hour time frame)⏰🏃♂️Bitcoin is moving near the Resistance line , 50_SMA(Daily) , and slightly above the 🔴 Resistance zone($66,050-$64,520) 🔴.
🌊According to the theory of Elliott waves , Bitcoin seems to have succeeded in completing the Double Three Correction(WXY) .
📈From the point of view of Classical Technical Analysis , it seems that Bitcoin has managed to form a Symmetrical Triangle and Rising Wedge Patterns so that the lower line of the Rising Wedge Pattern is currently broken.
💡Also, we can see Regular Divergence(RD-) between two Consecutive Peaks .
🔔I expect Bitcoin to start falling after breaking the Support lines(weak) , at least until one of the Fibonacci lines .
💡To have a better view of Bitcoin , I suggest you look at the post below (4-hour time frame) .👇
❗️⚠️Note⚠️❗️: An important point you should always remember is capital management and lack of greed.
Bitcoin Analyze ( BTCUSDT ), 1-hour time frame ⏰.
Do not forget to put Stop loss for your positions (For every position you want to open).
Please follow your strategy; this is just my Idea, and I will gladly see your ideas in this post.
Please do not forget the ✅' like '✅ button 🙏😊 & Share it with your friends; thanks, and Trade safe.

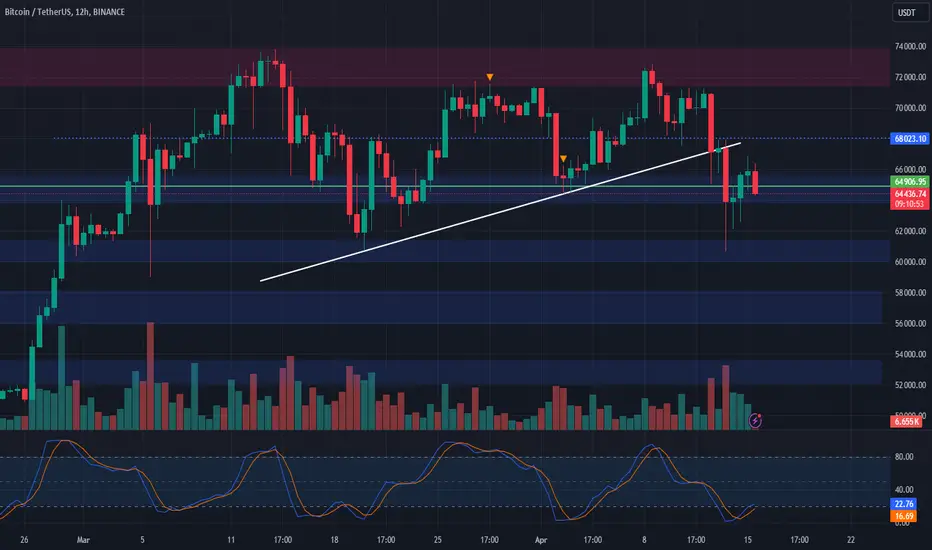
$BTC Daily UpdateCRYPTOCAP:BTC #BTC Nicely gained $64,344 support, currently testing $66,323 support - time to see if it can hold it, seems unlikely judging by current RSI on 4h, but last 1D close looks great and RSI on 1D also good. $64,344 next support from here. $68,546 next key resistance from here. Watch given S/R

🔥Hours before Bitcoin Halving 2024🔥🔥 Bitcoin Halving 2024 is less than 10 hours away.
💡Before the Halving 2024 , Bitcoin seemed to have experienced an increase due to this happening .
🏃♂️Bitcoin managed to break the Resistance lines/Downtrend line and is currently moving in the 🔴 Resistance zone($66,050-$64,520) 🔴.
🌊In terms of Elliott wave theory , Bitcoin seems to have completed wave 3 and is currently looking to complete wave 4 .
🔔I expect Bitcoin to break the 🔴 Resistance zone($66,050-$64,520) 🔴 with the help of wave 5 please break and at least rise to the 🎯 Target 🎯 I specified on the chart.
❗️⚠️Note⚠️❗️: An important point you should always remember is capital management and lack of greed.
Bitcoin Analyze ( BTCUSDT ), 15-minute time frame ⏰.
Do not forget to put Stop loss for your positions (For every position you want to open).
Please follow your strategy; this is just my Idea, and I will gladly see your ideas in this post.
Please do not forget the ✅' like '✅ button 🙏😊 & Share it with your friends; thanks, and Trade safe.

BTC/USD CHART ANALYSISHey There! This is my analysis for BTC/USD. As everyone knows we are in bearish scenario and many of us don't know where the next support would be.
BTC/USD (BITFINEX)
BTC/USD is forming a Falling Wedge pattern as shown in charts and
According to me there are various confluence as shown in chart. After bitcoin broke 0.618 weekly support is now marching towards 0.786 weekly support. That's where I found confluence, 0.786 Fib support was previous ATH back in DEC 2017 and i used Fib Extension in which 1.282 formed fib cluster with 0.786 fib retracement, for those who don't know what Fib cluster is, It is confluence of two or more fib tools.
After the confluence I found support between 19400 to 17600 from fib tools.
The buying zones would be 1.20000-21000✔
2.19000-17500
3. 15500-13500 WORST CASE SCENARIO
NEXT I saw 200MA weekly, Going Backwards During March 2020 Corona period we were almost 30% down from weekly 200MA and now expecting the same as we are 10% down already from weekly 200MA, If price action goes as planned it may kiss the 15500 line as marked in the chart.
The area between 15600-13500 can be a wick area where possibly wicks could be formed in weekly in the worst case scenario. Nobody wants bitcoin to go to that price range. As the cost of mining a bitcoin is $20000,BTC wouldn't be in that area for long time it will rebounce from the above mentioned chart.
If global market become stable we would reverse from
17500-17600
If market is inflated with US intrest rates then 15300 possibly
Any other bad fundamentals of big hedge funds worst case scenario would be 13500 last support according to me, If goes down further i'll have to find another job🤣 till market become stable.
Hit Like and follow button if you like my analysis

BTC Mapped out|Predictive Model for the next few yearsAll cycles consist of 3 tops. The first rally stays the same except for diminished returns and a lengthened cycle by 2 years each time. The last two tops don't stay the same and has different variations based on Convergence/Divergence, either price is diverging over all indications, or price may agree while technical indicators are not like seen with the 2021 top.
As we enter this 3rd cycle I'm expecting a similar pattern to play out. Diminished returns, same rally for top number one, and to end the 3rd cycle off with another variation double top by the end of 2032.

BTC on the way downBitcoin (BTC) against Tether (USDT) is currently priced at $69,731. After an unsuccessful retest, it is anticipated that BTC will undergo another retest before plummeting to a support level of $52,500 to $52,800. The unsuccessful retest indicates a potential weakening in the buying momentum, leading traders and investors to anticipate a decrease in price. This forthcoming retest is viewed as a critical juncture; if Bitcoin fails to maintain its position or show strength, it may trigger a sell-off, driving the price down to the identified support range.
MFI on 4h looks, so there can be some trap, ADX low, lets hope it is safe to open position.
1. Target 53 000

BTCUSDT.4HIn this technical analysis of the BTC/USDT 4-hour chart, we see that Bitcoin has been trading within a defined range, showcasing key resistance (R) and support (S) levels. The price is currently hovering around R1 at $64,257.65, with immediate support (S1) at $59,065.59.
A bearish trend was evident as the price made lower highs, confirmed by the Relative Strength Index (RSI) lingering below the 50 mark, indicating that the bears have had the upper hand recently. The histogram on the Moving Average Convergence Divergence (MACD) is in the negative territory, which further supports the bearish sentiment.
The RSI is close to the oversold region, which could imply a potential reversal or at least a temporary pullback. Traders might be watching for a break above R1 as a sign of bullish momentum, potentially aiming for R2 at $67,100.77 and the high pivot at $73,777.00. Conversely, a break below S1 may lead to further decline towards S2 at $56,226.29.
It’s worth noting that the RSI and MACD are just two indicators, and they should be used in conjunction with other technical analysis tools and fundamental analysis for a more comprehensive trading strategy. This analysis is based on current chart patterns and indicators, and the crypto market is known for its volatility, so I would keep an eye out for any news or events that could impact market sentiment.

BTC/USD Technical AnalysisBTC/USD Technical Analysis
Timeframe: Daily
Bitcoin created all-time high again. We can see in daily TF a symmetrical triangle formed and valid breakout happened. Now we are expecting downward moves to the SUPPORT ZONE.

Bitcoin is Ready to Attack to Resistance zone⚔️💡Bitcoin started to rise after the Spot Bitcoin And Ethereum ETFs were Approved In Hong Kong but failed to break the 🔴 Resistance zone($66,100-$64,500) 🔴and created a Bull Trap .
🌊According to the theory of Elliott waves , Bitcoin seems to have completed 5 downtrend waves in the 15-minute time frame .
💡Also, we can see Regular Divergence(RD+) between two Consecutive Valleys .
📈From the point of view of Classical Technical Analysis , there is also a possibility of forming the Inverse Head and Shoulders pattern .
🔔I expect Bitcoin to Attack the 🔴 Resistance zone($66,100-$64,500) 🔴once again.
❗️⚠️Note⚠️❗️: We must note that there is a possibility of Israel's response to Iran's attacks and the cryptocurrency market may experience another fall.
❗️⚠️Note⚠️❗️: An important point you should always remember is capital management and lack of greed.
Bitcoin Analyze ( BTCUSDT ), 15-minute time frame ⏰.
Do not forget to put Stop loss for your positions (For every position you want to open).
Please follow your strategy; this is just my Idea, and I will gladly see your ideas in this post.
Please do not forget the ✅' like '✅ button 🙏😊 & Share it with your friends; thanks, and Trade safe.

📉 Bitcoin Correction Analysis 📉🔍 Technical Indicators:
Weekly RSI and Stochastic RSI: Both indicators are indicating a shift in momentum and signaling a reversal, suggesting that Bitcoin is entering a correction phase.
Price Action: Despite rejecting above $72,000, Bitcoin is currently being supported above $61,500 by the bulls. However, a drop below this level could lead to further downside.
🐻 Bearish Scenarios:
Support Levels: If Bitcoin breaks below $61,500, it may encounter support levels at $59,500, $52,000, and potentially $48,000.
Bears in Control: A drop below key support levels could signal increased bearish pressure and potentially lead to further price declines.

🔄 BTC Recovery and Halving Precautions 🚀📉📊 Key Insights:
BTC Recovery: Bitcoin is recovering after last week's dump and is approaching the next resistance levels.
Upcoming Halving: The Bitcoin halving is scheduled in around 4 days, which historically has been preceded by price drops.
Cautious Approach: Given the historical trend, caution is advised starting from Wednesday leading up to the halving.
Resistance Levels: BTC may encounter resistance around $68,300 (0.618 retracement) and potentially higher towards all-time high territory.
📉 Risk Management:
Risk Awareness: Be cautious and manage risk tightly, especially in the days leading up to the halving.
Monitoring BTC Price: Pay close attention to BTC's price action, particularly around key resistance levels and halving dates.
Adaptability: Stay flexible and adjust trading strategies based on market conditions and price movements.
📈 Trade Plan:
Observation: Monitor BTC's price closely leading up to the halving, especially around $68,300 resistance.
Caution: Exercise caution and consider reducing exposure or implementing tighter risk management strategies.
Adaptation: Adjust trading plans and strategies based on market dynamics and emerging trends.
📉🚀 Outlook: While BTC's recovery presents trading opportunities, caution is advised ahead of the halving. Managing risk and staying adaptable will be key to navigating potential market fluctuations during this period. 📊📉 #BTC #Halving #RiskManagement
Bitcoin Can Go Down by 🚨Classical Patterns🚨🚨Bitcoin started to fall again after the news of a possible War between Iran and Israel and reacted well to the 🟢 Heavy Support zone($61,100-$58,690) 🟢.
🏃♂️Bitcoin is currently moving near the 🔴 Resistance zone($66,100-$64,500) 🔴.
📈It also seems that Bitcoin has managed to break the lower line of the Symmetrical triangle , and at the same time, it is forming an Eve & Adam Double Top .
🔔I expect Bitcoin to continue falling again , at least to the Pitchfork line .
❗️⚠️Note⚠️❗️: If Bitcoin can go above the 🔴 Resistance zone($66,100-$64,500) 🔴, we can expect an increase in Bitcoin.
❗️⚠️Note⚠️❗️: An important point you should always remember is capital management and lack of greed.
Bitcoin Analyze ( BTCUSDT ), 15-minute time frame ⏰.
Do not forget to put Stop loss for your positions (For every position you want to open).
Please follow your strategy; this is just my Idea, and I will gladly see your ideas in this post.
Please do not forget the ✅' like '✅ button 🙏😊 & Share it with your friends; thanks, and Trade safe.

Bitcoin is Ready to Attack to Support zone⚔️🏃♂️Bitcoin is moving near the 🔴 Resistance zone($71,350-$70,900) 🔴 and seems to have broken the Support line .
🌊According to the theory of Elliott waves , Bitcoin seems to have successfully completed the Zigzag Correction(ABC/5-3-5) .
💡Also, we can see Regular Divergence(RD-) between two Consecutive Peaks .
📈If Bitcoin's downward momentum is high , there is a possibility of forming a classic Double Top Pattern .
🔔I expect Bitcoin to ⚔️ Attack ⚔️ the 🟢 Heavy Support zone($69,300-$67,500) 🟢 once again.
❗️⚠️Note⚠️❗️: An important point you should always remember is capital management and lack of greed.
Bitcoin Analyze ( BTCUSDT ), 15-minute time frame ⏰.
Do not forget to put Stop loss for your positions (For every position you want to open).
Please follow your strategy; this is just my Idea, and I will gladly see your ideas in this post.
Please do not forget the ✅' like '✅ button 🙏😊 & Share it with your friends; thanks, and Trade safe.

No Words! BTC In DrawingsMajors scenarios.
Just one next LL, and BTC is done, bearish turn. Hongkong ETFs approval on Monday, hopefully next week give greens

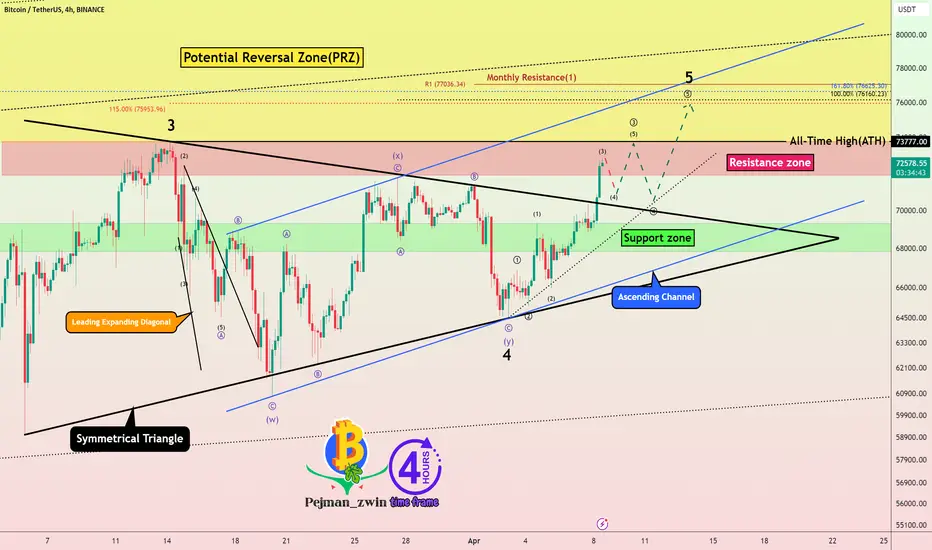
🗺️Bitcoin Roadmap🗺️⏰(4_hour time frame)⏰✅Bitcoin broke the upper line of the classic Symmetrical Triangle Pattern a few hours ago.
🌊Regarding Elliott's wave theory , Bitcoin seems to have completed wave 4 with a Double Three Correction(WXY) in a symmetrical triangle.
🌊Currently, Bitcoin is completing microwave wave 3 of main wave 5 , which can complete around an All-Time High($73,777) ( or even a little higher ).
🔔I expect Bitcoin to start rising again to complete the main wave 5 after the pullback to the upper line of the symmetrical triangle and at least rise to the upper line of the Ascending Channel .
❗️⚠️Note⚠️❗️: If Bitcoin can break the 🟢Support zone($69,300-$67,800)🟢, the scenario will change and we have to wait for Bitcoin to fall further.
❗️⚠️Note⚠️❗️: An important point you should always remember is capital management and lack of greed.
Bitcoin Analyze ( BTCUSDT ), 4-hour time frame ⏰.
Do not forget to put Stop loss for your positions (For every position you want to open).
Please follow your strategy; this is just my Idea, and I will gladly see your ideas in this post.
Please do not forget the ✅' like '✅ button 🙏😊 & Share it with your friends; thanks, and Trade safe.
$BTC Daily UpdateCRYPTOCAP:BTC #BTC $71,379 tested as expected! Trying to hold support at $71,379, RSI on 4H and 1D suggests it could drop below $71,379 unless maintains volume here and heads towards $73,523 test (latest ATH area), 11 Days from halving, Current 4h 25 minutes from close and forming bullish pin bar, let's hope it can remain bullish on close. $68,543 Key support below $71,379, Watch given S/R

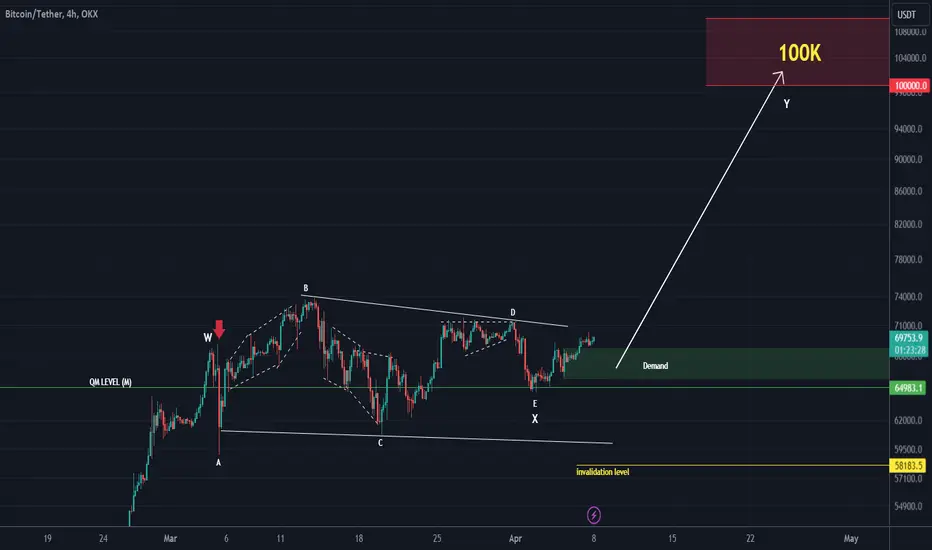
BITCOIN is heading towards 100KBitcoin conditions are such that we see a triangle (or diametric) in an X wave.
The price has formed a continuation pattern above a very important QML. This QM L corresponds to the monthly time frame
As long as we are above the invalidation level and QM L and have not stabilized with a daily candle below this level, Bitcoin is very bullish.
For risk management, please don't forget stop loss and capital management
Comment if you have any questions
Thank You
BTCUSDT.4HIn this 4-hour Bitcoin (BTC) to USDT (Tether) chart, we're seeing several technical indicators and tools applied to determine the market's trajectory. This includes the RSI (Relative Strength Index), MACD (Moving Average Convergence Divergence), and multiple support (S1, S2, S3, S4) and resistance levels (R1, R2, R3, R4).
The RSI is showing a value slightly above 50, suggesting a neutral to mildly bullish sentiment as it is not within the overbought (above 70) or oversold (below 30) areas. Meanwhile, the MACD is providing a bullish signal with the MACD line (blue) above the signal line (orange), indicating that upward momentum may be building.
The price appears to be approaching a resistance level (R2) at approximately $73,390.70, which could act as a barrier to further upward movement. Should the price break above R1, it could suggest a continuation of the bullish momentum, potentially aiming for the next resistance level at R3 ($78,848.72) and beyond.
On the downside, the nearest support level (S1) lies at around $63,369.35. This level, along with subsequent supports S2 ($60,618.19) and S3 ($56,064.14), could serve as areas where buyers might step in to prop up the price if a retracement occurs.
Notably, the chart also shows an ascending triangle pattern forming, with the flat upper resistance line and the rising lower support line converging. This pattern often indicates continuation, so if I were assessing this chart, I’d be watching for a potential breakout above R1, which might be confirmed by increasing volume.
However, trading within the triangle could continue until a breakout or breakdown occurs. Hence, it’s critical to monitor how the price reacts to these levels. A breakout accompanied by high volume would increase the likelihood of the move being sustained.
In conclusion, while the chart suggests a potential bullish scenario, a trader must be prepared for any outcome, including false breakouts or reversals. As such, I’d have a risk management strategy in place, possibly setting stop losses below the latest swing low or support levels. It's also important to stay informed on the broader market sentiment and news that could impact Bitcoin's price.

BTC FOR SCALPERS AND DAY TRADERS *10000 POINTS **Entry price ,stoploss and Target already marked in the chart itself FYI.
Guys pls like, share and follow my ideas .
Thank You All

Bitcoin- Are new ATHs still on the horizon in the near term?Since reaching the recent all-time high (ATH) near 74k in mid-March, BITSTAMP:BTCUSD has corrected to the 61k zone support and has begun consolidating thereafter.
Despite significant volatility over the past three weeks, the overall outlook remains predominantly bullish, offering reassurance to medium to long-term holders.
Furthermore, upon examining the daily chart, it becomes evident that this consolidation is gradually narrowing, forming a symmetrical triangle, which typically signals continuation. Additionally, following the breach below the interim support at 68k on Tuesday, the subsequent reversal has resulted in a Morning Star candlestick formation, while yesterday's NFP report provided further evidence of bullish momentum with a Pin Bar candle.
At the time of writing, the price has returned to the 68k median level, showing determination to retest the 70k mark once more. To confirm a new upward trend, bulls will require stabilization above 71k, at which point, the measured target for the triangle pattern around 80k comes into focus.
My bullish stance persists as long as the price remains above the 62k zone.
