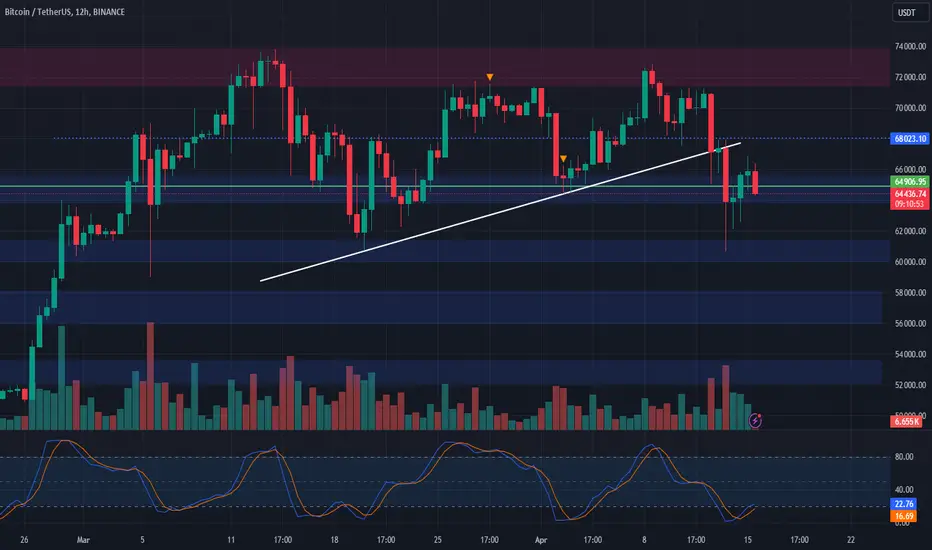
BTC/USD Technical AnalysisBTC/USD Technical Analysis
Timeframe: Daily
Bitcoin created all-time high again. We can see in daily TF a symmetrical triangle formed and valid breakout happened. Now we are expecting downward moves to the SUPPORT ZONE.
Btcanalysis

Bitcoin is Ready to Attack to Resistance zone⚔️💡Bitcoin started to rise after the Spot Bitcoin And Ethereum ETFs were Approved In Hong Kong but failed to break the 🔴 Resistance zone($66,100-$64,500) 🔴and created a Bull Trap .
🌊According to the theory of Elliott waves , Bitcoin seems to have completed 5 downtrend waves in the 15-minute time frame .
💡Also, we can see Regular Divergence(RD+) between two Consecutive Valleys .
📈From the point of view of Classical Technical Analysis , there is also a possibility of forming the Inverse Head and Shoulders pattern .
🔔I expect Bitcoin to Attack the 🔴 Resistance zone($66,100-$64,500) 🔴once again.
❗️⚠️Note⚠️❗️: We must note that there is a possibility of Israel's response to Iran's attacks and the cryptocurrency market may experience another fall.
❗️⚠️Note⚠️❗️: An important point you should always remember is capital management and lack of greed.
Bitcoin Analyze ( BTCUSDT ), 15-minute time frame ⏰.
Do not forget to put Stop loss for your positions (For every position you want to open).
Please follow your strategy; this is just my Idea, and I will gladly see your ideas in this post.
Please do not forget the ✅' like '✅ button 🙏😊 & Share it with your friends; thanks, and Trade safe.

📉 Bitcoin Correction Analysis 📉🔍 Technical Indicators:
Weekly RSI and Stochastic RSI: Both indicators are indicating a shift in momentum and signaling a reversal, suggesting that Bitcoin is entering a correction phase.
Price Action: Despite rejecting above $72,000, Bitcoin is currently being supported above $61,500 by the bulls. However, a drop below this level could lead to further downside.
🐻 Bearish Scenarios:
Support Levels: If Bitcoin breaks below $61,500, it may encounter support levels at $59,500, $52,000, and potentially $48,000.
Bears in Control: A drop below key support levels could signal increased bearish pressure and potentially lead to further price declines.

🔄 BTC Recovery and Halving Precautions 🚀📉📊 Key Insights:
BTC Recovery: Bitcoin is recovering after last week's dump and is approaching the next resistance levels.
Upcoming Halving: The Bitcoin halving is scheduled in around 4 days, which historically has been preceded by price drops.
Cautious Approach: Given the historical trend, caution is advised starting from Wednesday leading up to the halving.
Resistance Levels: BTC may encounter resistance around $68,300 (0.618 retracement) and potentially higher towards all-time high territory.
📉 Risk Management:
Risk Awareness: Be cautious and manage risk tightly, especially in the days leading up to the halving.
Monitoring BTC Price: Pay close attention to BTC's price action, particularly around key resistance levels and halving dates.
Adaptability: Stay flexible and adjust trading strategies based on market conditions and price movements.
📈 Trade Plan:
Observation: Monitor BTC's price closely leading up to the halving, especially around $68,300 resistance.
Caution: Exercise caution and consider reducing exposure or implementing tighter risk management strategies.
Adaptation: Adjust trading plans and strategies based on market dynamics and emerging trends.
📉🚀 Outlook: While BTC's recovery presents trading opportunities, caution is advised ahead of the halving. Managing risk and staying adaptable will be key to navigating potential market fluctuations during this period. 📊📉 #BTC #Halving #RiskManagement
Bitcoin Can Go Down by 🚨Classical Patterns🚨🚨Bitcoin started to fall again after the news of a possible War between Iran and Israel and reacted well to the 🟢 Heavy Support zone($61,100-$58,690) 🟢.
🏃♂️Bitcoin is currently moving near the 🔴 Resistance zone($66,100-$64,500) 🔴.
📈It also seems that Bitcoin has managed to break the lower line of the Symmetrical triangle , and at the same time, it is forming an Eve & Adam Double Top .
🔔I expect Bitcoin to continue falling again , at least to the Pitchfork line .
❗️⚠️Note⚠️❗️: If Bitcoin can go above the 🔴 Resistance zone($66,100-$64,500) 🔴, we can expect an increase in Bitcoin.
❗️⚠️Note⚠️❗️: An important point you should always remember is capital management and lack of greed.
Bitcoin Analyze ( BTCUSDT ), 15-minute time frame ⏰.
Do not forget to put Stop loss for your positions (For every position you want to open).
Please follow your strategy; this is just my Idea, and I will gladly see your ideas in this post.
Please do not forget the ✅' like '✅ button 🙏😊 & Share it with your friends; thanks, and Trade safe.

Bitcoin is Ready to Attack to Support zone⚔️🏃♂️Bitcoin is moving near the 🔴 Resistance zone($71,350-$70,900) 🔴 and seems to have broken the Support line .
🌊According to the theory of Elliott waves , Bitcoin seems to have successfully completed the Zigzag Correction(ABC/5-3-5) .
💡Also, we can see Regular Divergence(RD-) between two Consecutive Peaks .
📈If Bitcoin's downward momentum is high , there is a possibility of forming a classic Double Top Pattern .
🔔I expect Bitcoin to ⚔️ Attack ⚔️ the 🟢 Heavy Support zone($69,300-$67,500) 🟢 once again.
❗️⚠️Note⚠️❗️: An important point you should always remember is capital management and lack of greed.
Bitcoin Analyze ( BTCUSDT ), 15-minute time frame ⏰.
Do not forget to put Stop loss for your positions (For every position you want to open).
Please follow your strategy; this is just my Idea, and I will gladly see your ideas in this post.
Please do not forget the ✅' like '✅ button 🙏😊 & Share it with your friends; thanks, and Trade safe.

No Words! BTC In DrawingsMajors scenarios.
Just one next LL, and BTC is done, bearish turn. Hongkong ETFs approval on Monday, hopefully next week give greens

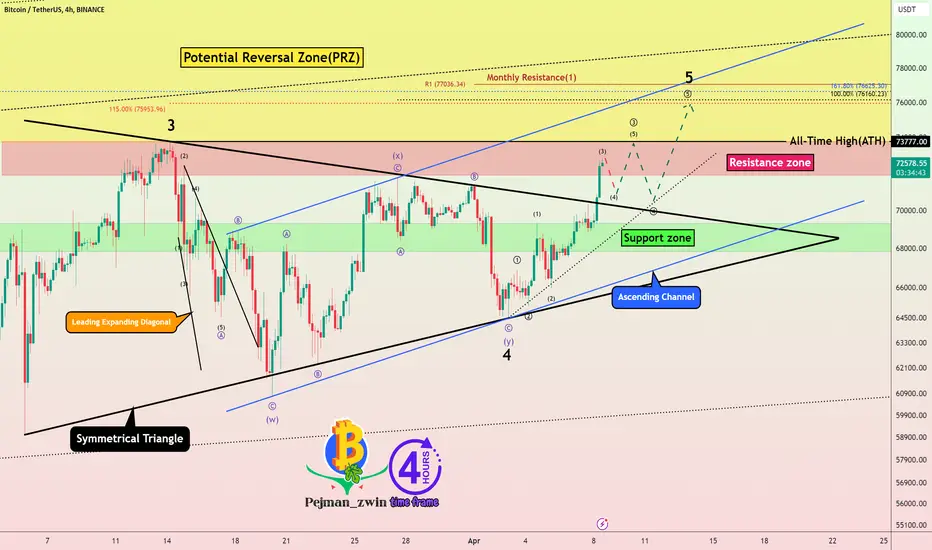
🗺️Bitcoin Roadmap🗺️⏰(4_hour time frame)⏰✅Bitcoin broke the upper line of the classic Symmetrical Triangle Pattern a few hours ago.
🌊Regarding Elliott's wave theory , Bitcoin seems to have completed wave 4 with a Double Three Correction(WXY) in a symmetrical triangle.
🌊Currently, Bitcoin is completing microwave wave 3 of main wave 5 , which can complete around an All-Time High($73,777) ( or even a little higher ).
🔔I expect Bitcoin to start rising again to complete the main wave 5 after the pullback to the upper line of the symmetrical triangle and at least rise to the upper line of the Ascending Channel .
❗️⚠️Note⚠️❗️: If Bitcoin can break the 🟢Support zone($69,300-$67,800)🟢, the scenario will change and we have to wait for Bitcoin to fall further.
❗️⚠️Note⚠️❗️: An important point you should always remember is capital management and lack of greed.
Bitcoin Analyze ( BTCUSDT ), 4-hour time frame ⏰.
Do not forget to put Stop loss for your positions (For every position you want to open).
Please follow your strategy; this is just my Idea, and I will gladly see your ideas in this post.
Please do not forget the ✅' like '✅ button 🙏😊 & Share it with your friends; thanks, and Trade safe.
$BTC Daily UpdateCRYPTOCAP:BTC #BTC $71,379 tested as expected! Trying to hold support at $71,379, RSI on 4H and 1D suggests it could drop below $71,379 unless maintains volume here and heads towards $73,523 test (latest ATH area), 11 Days from halving, Current 4h 25 minutes from close and forming bullish pin bar, let's hope it can remain bullish on close. $68,543 Key support below $71,379, Watch given S/R

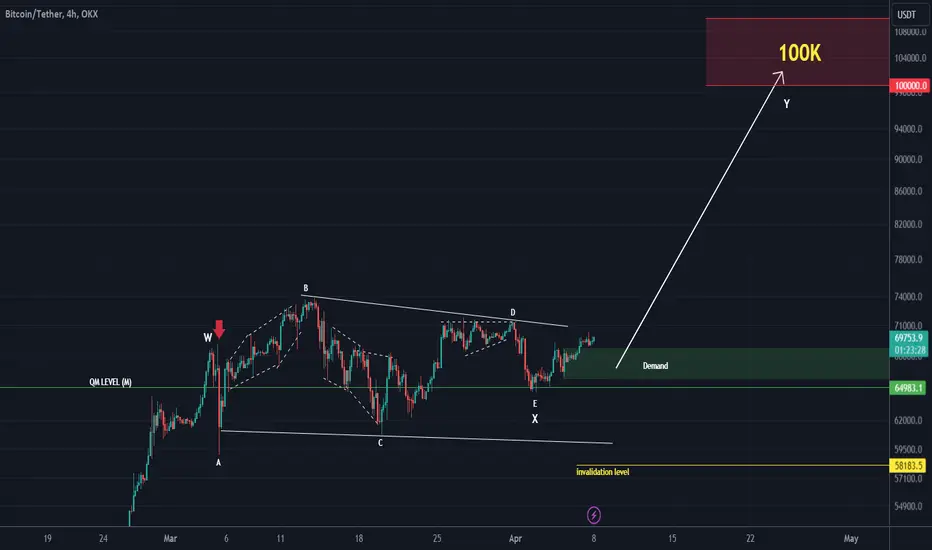
BITCOIN is heading towards 100KBitcoin conditions are such that we see a triangle (or diametric) in an X wave.
The price has formed a continuation pattern above a very important QML. This QM L corresponds to the monthly time frame
As long as we are above the invalidation level and QM L and have not stabilized with a daily candle below this level, Bitcoin is very bullish.
For risk management, please don't forget stop loss and capital management
Comment if you have any questions
Thank You
BTCUSDT.4HIn this 4-hour Bitcoin (BTC) to USDT (Tether) chart, we're seeing several technical indicators and tools applied to determine the market's trajectory. This includes the RSI (Relative Strength Index), MACD (Moving Average Convergence Divergence), and multiple support (S1, S2, S3, S4) and resistance levels (R1, R2, R3, R4).
The RSI is showing a value slightly above 50, suggesting a neutral to mildly bullish sentiment as it is not within the overbought (above 70) or oversold (below 30) areas. Meanwhile, the MACD is providing a bullish signal with the MACD line (blue) above the signal line (orange), indicating that upward momentum may be building.
The price appears to be approaching a resistance level (R2) at approximately $73,390.70, which could act as a barrier to further upward movement. Should the price break above R1, it could suggest a continuation of the bullish momentum, potentially aiming for the next resistance level at R3 ($78,848.72) and beyond.
On the downside, the nearest support level (S1) lies at around $63,369.35. This level, along with subsequent supports S2 ($60,618.19) and S3 ($56,064.14), could serve as areas where buyers might step in to prop up the price if a retracement occurs.
Notably, the chart also shows an ascending triangle pattern forming, with the flat upper resistance line and the rising lower support line converging. This pattern often indicates continuation, so if I were assessing this chart, I’d be watching for a potential breakout above R1, which might be confirmed by increasing volume.
However, trading within the triangle could continue until a breakout or breakdown occurs. Hence, it’s critical to monitor how the price reacts to these levels. A breakout accompanied by high volume would increase the likelihood of the move being sustained.
In conclusion, while the chart suggests a potential bullish scenario, a trader must be prepared for any outcome, including false breakouts or reversals. As such, I’d have a risk management strategy in place, possibly setting stop losses below the latest swing low or support levels. It's also important to stay informed on the broader market sentiment and news that could impact Bitcoin's price.

BTC FOR SCALPERS AND DAY TRADERS *10000 POINTS **Entry price ,stoploss and Target already marked in the chart itself FYI.
Guys pls like, share and follow my ideas .
Thank You All

Bitcoin- Are new ATHs still on the horizon in the near term?Since reaching the recent all-time high (ATH) near 74k in mid-March, BITSTAMP:BTCUSD has corrected to the 61k zone support and has begun consolidating thereafter.
Despite significant volatility over the past three weeks, the overall outlook remains predominantly bullish, offering reassurance to medium to long-term holders.
Furthermore, upon examining the daily chart, it becomes evident that this consolidation is gradually narrowing, forming a symmetrical triangle, which typically signals continuation. Additionally, following the breach below the interim support at 68k on Tuesday, the subsequent reversal has resulted in a Morning Star candlestick formation, while yesterday's NFP report provided further evidence of bullish momentum with a Pin Bar candle.
At the time of writing, the price has returned to the 68k median level, showing determination to retest the 70k mark once more. To confirm a new upward trend, bulls will require stabilization above 71k, at which point, the measured target for the triangle pattern around 80k comes into focus.
My bullish stance persists as long as the price remains above the 62k zone.

WILL THIS HALVING BE A TRAP FOR ALL THE RETAIL TRADERS?I have seen a lot of charts of BTCUSDT since its beginning and I have not seen BTC every made its ATH before halving even its price surged after a couple of months of the event of the halving. But as you can see in the chart BTC has made 2 extra all time high if we do not count the first surge because it was already expected because of the previous halving but it made a new ATH in 2022 and then again in 2024 on the year of the halving and at the time this near the halving event when as it should be marking its bottom.
WILL THIS HALVING BE A TRAP FOR ALL THE RETAIL TRADERS? Where all the retail traders will be looking to hit 150k and make huge profits and then suddenly the institutions will hop into the market near 100k where everyone will be looking to buy they will sell all their BTCs and make the spot and futures traders lose their money becuase we have to face this reality somebody's loss is somebody's victory. This is how this goes, this is the rule of nature, whales stay alive by eating smaller fishes then them.
This is just my theory and nothing more, it got into my mind when I saw all the previous pre and post halving data, all the last 3 halving data were same except for this one.
The comment section is open for discussions, share your theories as well.

BTC Symmetrical Triangle ! We go up or down ?Bitcoin has been consolidating within a symmetrical triangle pattern for the past 24 days.
A breakout above the triangle's upper trendline would signal a continuation of the previous uptrend. This bullish scenario could propel prices the opening up the path towards the $80,000 target.
Conversely, a breakdown below the triangle's lower trendline would indicate a bearish reversal. This could lead to a retracement towards the , with further support at $53,000.
With Bitcoin nearing the apex of the triangle, a breakout is imminent, likely within the next few days. This heightened volatility presents both opportunities and risks for traders.
It's important to emphasize that this analysis is for informational purposes only and does not constitute a recommendation to buy or sell Bitcoin. As always, conduct your own research and employ sound risk management strategies when making any investment decisions.
Here are some additional factors to consider:
Overall market sentiment remains bullish, with positive on-chain metrics supporting this view.
Bitcoin's dominance has been rising, indicating a shift in investor preference towards BTC.
The Fear & Greed Index is currently in the "Neutral" zone, suggesting a balanced market sentiment.
While the technicals favor a bullish breakout, traders should remain vigilant and exercise caution due to the unpredictable nature of the cryptocurrency market.
Disclaimer: This content is not financial advice. Please do your own research before investing in Bitcoin or any other cryptocurrency.

$BTC Daily UpdateCRYPTOCAP:BTC #BTC nice getting back above $66,323, currently testing resistance at $68,546 required to reattempt at $71,379. previous 4h close failed to follow up to bullish pin bar, $66,961 could be tested if followed thru on previous 4h bearish close. RSI on 1D looks good, just needs a bit of a push to breakout, so close! Watch given S/R
🚨Bitcoin Analysis🚨✅As I shared with you in previous posts, Bitcoin attacked the 🟢 Support zone($69,000-$67,800) 🟢 two times.
🏃♂️Bitcoin is moving in the 🟢 Support zone($69,000-$67,800) 🟢 and near the Support line .
🔔Based on Market Cap USDT Dominance% (USDT.D%) conditions, I expect Bitcoin to rise to $70,200 at most and then attack the Support line . The Rising Wedge Pattern is still Valid .
💡Bitcoin also seems to be completing a pullback to the lower line of the symmetrical triangle .
❗️⚠️Note⚠️❗️ : If Bitcoin can break the Resistance lines , we can expect a new All-Time High(ATH) for Bitcoin.
❗️⚠️Note⚠️❗️: An important point you should always remember is capital management and lack of greed.
Bitcoin Analyze ( BTCUSDT ), 4-hour time frame ⏰.
Do not forget to put Stop loss for your positions (For every position you want to open).
Please follow your strategy; this is just my Idea, and I will gladly see your ideas in this post.
Please do not forget the ✅' like '✅ button 🙏😊 & Share it with your friends; thanks, and Trade safe.

BTC can drop moreThe price structure looks bearish due to the bearish CH and the sweep of the liquidity pool above the chart.
By maintaining the specified supply, it can drop to the specified demand.
Closing a daily candle above the invalidation level will violate this analysis
For risk management, please don't forget stop loss and capital management
When we reach the first target, save some profit and then change the stop to entry
Comment if you have any questions
Thank You

BTC - Fortnightly Outlook - 01/04 to 12/04The bulls won! They pushed prices above their historic highs, and ETFs also performed remarkably well, backed by securities houses. A beautiful victory! But now, who will be the next opponent?
Just like gold, is Bitcoin (BTC) fulfilling its role as a protective reserve? Given recent news, it appears so. Everyone is rushing into cryptocurrency, just like they rush into gold when things in the world seem to go off the rails. Curious, isn't it?
Let's analyze the graph:
Long term: There are no signs of a change in direction in the long term. The uptrend remains firm and strong, pointing towards new highs. Impressive, isn't it?
The SETUP used does not indicate a weakening of this trend. Therefore, we do not expect abrupt corrections (or disasters) at the moment, unless something unexpected happens (lol) and the market decides to treat BTC as a punching bag (regulation, government interference, etc.). See the image below, with all SETUP targets achieved, including forming the “Golden Triple of SETUP”. Incredible strength!
Mid-term: The dispute between bulls and bears continues. Sometimes bulls thrust their horns upwards, while other times bears lunge downwards.
The corrective channel outlined previously is being respected, and there are signs that we may have an H&S (Head and Shoulders) pattern. Interesting, isn't it?
An important warning: The bears appear to have set a trap for the bulls. The loss of the 66.5K range makes room for corrections up to 42K. For this to happen, prices just need to start working below 70K, especially if this week's candle closes below that level. See the image below.
Short term:I leave a beautiful image below for you to contemplate. Graphical analysis is really fascinating, isn't it?
Do your analysis and good business! Be aware.
If you buy, use Stop Loss.
See also other graphical analyses. 📈🚀

BTC- I'm still bullish but with some cautionIn my analysis of BITSTAMP:BTCUSD yesterday, I mentioned my expectation for a new all-time high from Bitcoin in the near future.
However, during yesterday's trading session, the price once again failed to surpass the 72k mark, raising some doubts about my outlook.
Firstly, after breaking above the 68k zone and retesting it, I anticipated a new local high. However, this didn't materialize.
Secondly, the rise from 62k wasn't as impulsive as one had wanted.
Considering these factors, while I remain bullish in the short term, I am closely monitoring the 68-70k zone.
If we break below 68k, we can expect a continuation of the downward move, possibly even testing the support zone at 62k again.
BTCUSDT.4HIn this BTC/USDT chart, the overall structure is bullish, as indicated by the price being well above the Ichimoku Cloud. However, currently, the price action is showing some consolidation after a significant uptrend.
The Ichimoku Cloud's span is wide, which usually represents a strong trend, but the price nearing the Conversion Line (blue) might suggest a short-term retracement or consolidation phase. The Lagging Span is above the price action and cloud, reinforcing the bullish sentiment over the longer period.
The RSI is around 55, which is fairly neutral and gives room for movement either way without immediate overbought or oversold concerns. This is indicative of potential further upward movement if the market sentiment remains bullish.
The MACD shows the histogram trending downward, and the MACD line is below the signal line, suggesting that the bullish momentum is currently weakening. A close watch is necessary here as this might signal the onset of a bearish phase or just a temporary pullback within a larger bullish trend.
Key resistance levels are identified as R1 at 74084.32 USDT, R2 at 78848.72 USDT, and R3 at 82704.45 USDT. These are important barriers for the bulls to overcome to continue the upward trajectory. On the flip side, support levels are found at S1 (67238.06 USDT), S2 (60665.16 USDT), S3 (56202.15 USDT), if a bearish reversal occurs.
My analysis suggests a cautious approach. The potential for continuation of the bullish trend is there, but the recent weakening momentum warrants vigilance. I would consider taking a long position if the price bounces off the Conversion Line with strong volume and an RSI that avoids the overbought territory. A close below the Cloud might shift my stance to bearish, considering short positions towards the nearest support levels.

$BTC Daily UpdateCRYPTOCAP:BTC #BTC second attempt at $71,379 followed by bullish engulfing on 4h from yesterday as expected! Hanging above $69,813 support, moving sideways with very weak volume. Put bullish engulfing on last daily close, needs volume to follow thru, Which could result in a test of $73,523 previous highest resistance - first and last tested on March 13-14. Support area $69,813-$68,546 to watch as RSI support test likely. Watch given S/R.

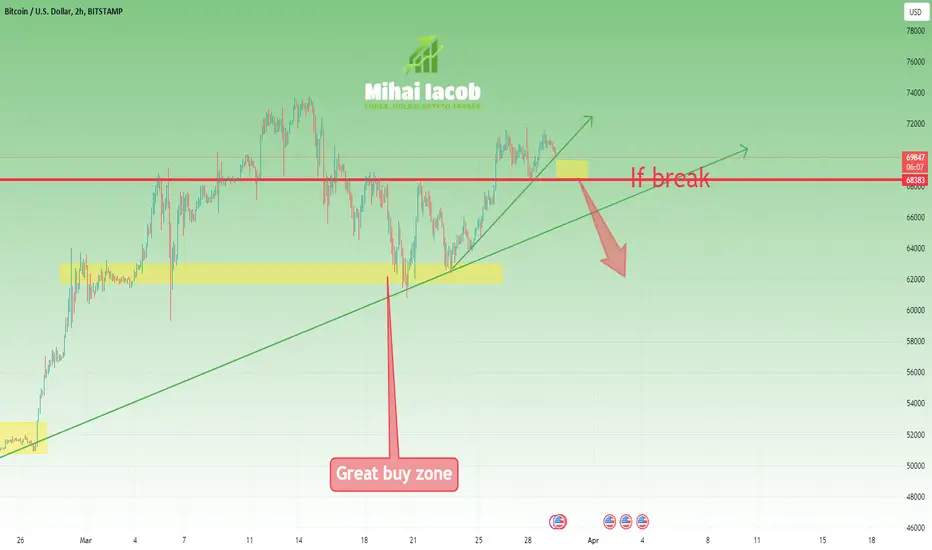
Bitcoin- New ATH coming soon?In my analysis of BITSTAMP:BTCUSD from March 17th, I pondered whether Bitcoin's bullish trend should cause concern for its bulls. I concluded that there was nothing to worry about and highlighted the importance of the 62k zone, suggesting that buying within that zone would be advantageous.
As anticipated, the price reversed precisely from that zone and even surpassed my initial short-term target of 70k.
As of today, the price remains above the 70k mark, and I anticipate further upward movement. My current target is in the range of 78-80k, with yesterday's low serving as support.
