BTC Bottom & New ATH..... when ?!!! Hello Guys
There are some notes of BTC weekly Chart:
1. We have a new ATH every 4 years ( 1428-1477 ) days..
2. After the ATH we take about ( 52-59 ) weeks to make a new bottom then we go up a little ...
3. Every time we reach a new ATH we drop down in a same angle (-55) before the new bull run starting .... look at my chart ( Red angles and curves ):
****** We dropped from ATH 2013 to Bottom 2015 by an angle ( -55 ) .
****** We dropped from ATH 2017 to Bottom 2018 by an angle ( -55 ) .
****** Same (24 July 2019) we dropped from local top to the local bottom by Angle ( -56 ) .
****** Will we drop from ATH 2021 to Bottom (2022 - 2023) by the same angle ( -55 or -56 )??
4. In my opinion , I expect we will reach the final bottom between ( 26 December 2022 : 6 march 2023 ).
5. I don't care what will be the price of BTC then , but I care only for when will be the possible bottom !!.
But if we can try to expect the price it will be in a range of ( 11900 : 9000$) ...
Note:( 10K - 10500$) is very very strong demand area for BTC .
-------------------------------------------------------------------------------------------------------------------------------------------------------------------------------------------------------
Finally , I think the new ATH will not be before Nov 2025 ( 150k $ ).
It is not a financial advice , I am only share my thoughts with u :)
Thank u and good luck.
Btcanalysis

$BTC Daily UpdateMIL:BTC #BTC Reattempted $27,478 as expected, testing $26,963 for a support, holding above $26,650 good sign, previous 4h closed bearish, last 1d closed with beautiful follow up to bullish engulfing from Monday, next resistance $28,298, watch given S/R
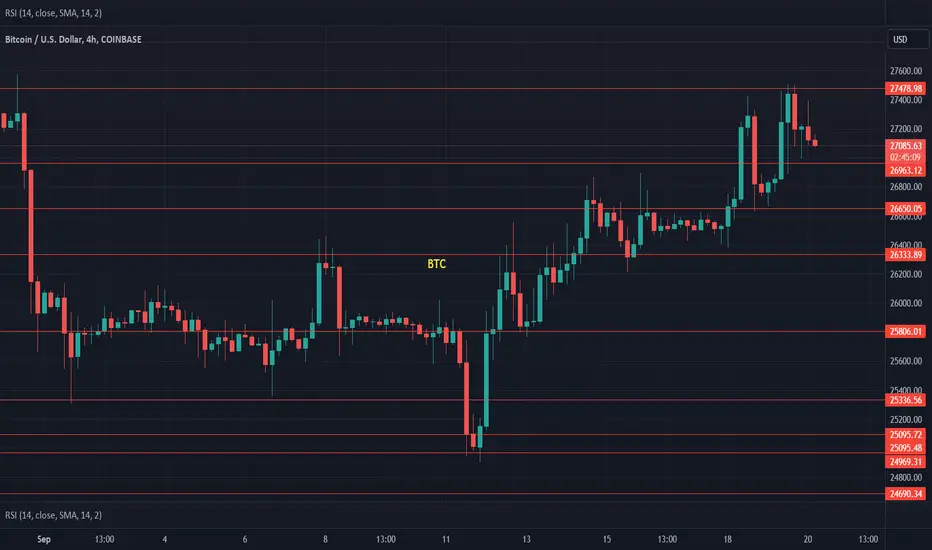
$BTC Daily UpdateCRYPTOCAP:BTC #BTC As expected $26,963 tested, gained $26,650 key support, $27,478 rejected which was informed days ago, last 4h close looks good, 1D closed with bearish pin but bullish engulfing, RSI looks good on 4h and 1d, must hold $26,650 support to reattempt at $27,478

Bitcoin is not bullishBitcoin to hit support around 21 to 22k.if Bitcoin will not cross 28k and hold there then I am super bearish and if you want to short btc then don't short here. If btc break support of 25k then short and target will be 21700.

$BTC Daily UpdateCRYPTOCAP:BTC #BTC Struggle gaining $26,650 key support, last 4h closed bearish with possibility to test $26,333 support, 1D closed neutral, weak volume as of now, watch given S/R

Bitcoin Still Wants That 27.3Despite BTC showing sell signals on Stoch RSI and Rising Wedge. its still holding the range and trying to slowly crawl higher.Will Momentum pick up today ? If Momentum picks up which side we going? These are the questions to ask.
Thanks for watching

$BTC Daily UpdateCRYPTOCAP:BTC #BTC $26,333 support gained, $26,650 resistance testing as expected, $27,478 key resistance to watch for support, $26,650 will be key support if gained.

Bitcoin Could Go Higher After A Liq Grab Bitcoin made a higher high and a higher low in the past days, showing bullish sign.with this rising wedge at hand we have to see if its valid or not.
Thanks for watching

$BTC Daily UpdateCRYPTOCAP:BTC #BTC Last 4h closed bearish, $26,333 resistance holding, Previous daily closed fine, RSI rising on 1D and 4H, needs volume to push towards $26,650 support. Watch given S/R, FUD coming up with FTX selling it's crypto assets
Bitcoin (BTC) is Turning Up in H4Technical Analysis:
- BTC is doing wave (3) in blue which is part of wave ((1)) in black
- When wave ((1)) is completed, we expect a ABC correction in wave ((2)) in black around at 32,500
- H1 & H4 right side is turning up
Technical Information:
- We only consider the buy opportunity in wave (4) in blue once it's completed

Bitcoin Getting Weaker After Each Pump!Bitcoin successfully cleaned the liquidity above 26.4 liquidating shorters.There is still a sweep to the downside that will liquidate the longers. The sweep can be combined with CPI Move today
Thanks for watching and your support ^_^

$BTC Daily UpdateCRYPTOCAP:BTC #BTC pushed thru and gained $25,806 support! $26,333 resisting as expected, previous daily failed to close with bullish engulfing, Must take $26,963 to avoid retrace towards $25,336-$25,095.

BTCBTCUSDT Analysis for week ahead, Currently, I make this prediction that, first, we have a pullback to around $30K and then the end of the upward trend.

Where will bitcoin go?According to the price action structure on the chart, it seems that Bitcoin will drop to the green range of ob after hitting the red range of supply.
We have sets of ob's that have been mitigated and now it looks like the way is open for a drop to the green range.
This upward movement of the price seems to be the time to collect sell orders
Also, we should not forget that we are under major dynamic resistance.
I have specified the invalidation level. Closing a 4-hour candle above this level will violate the analysis
For risk management, please don't forget stop loss and capital management
Comment if you have any questions
Thank You

BTC Bitcoin Technical Analysis and Trade IdeaIt's evident that Bitcoin has faced sustained downward pressure for a considerable period. A close examination of the chart reveals a decisive breach of the existing trading range to the downside, followed by a subsequent retracement. In our discussion, we explore the prospect of a potential entry point, while also carefully analyzing certain adverse indicators that are clearly visible on the chart. It's crucial to emphasize that all insights and analyses are comprehensively explained in the accompanying video and should not be interpreted as financial advice.

$BTC Daily UpdateCRYPTOCAP:BTC #BTC FTX Dump will effect the market as FUD rises, $25,806 given resistance holding strong, $25,336-$25,095 support range which will be weak against FUD, $24,129-$22,379 supports to watch

Bitcoin Yet To decide Where To GoBitcoin showing mixed signals,above 27K or below 25K!
My guess : 27K then 25K
Thanks for watching

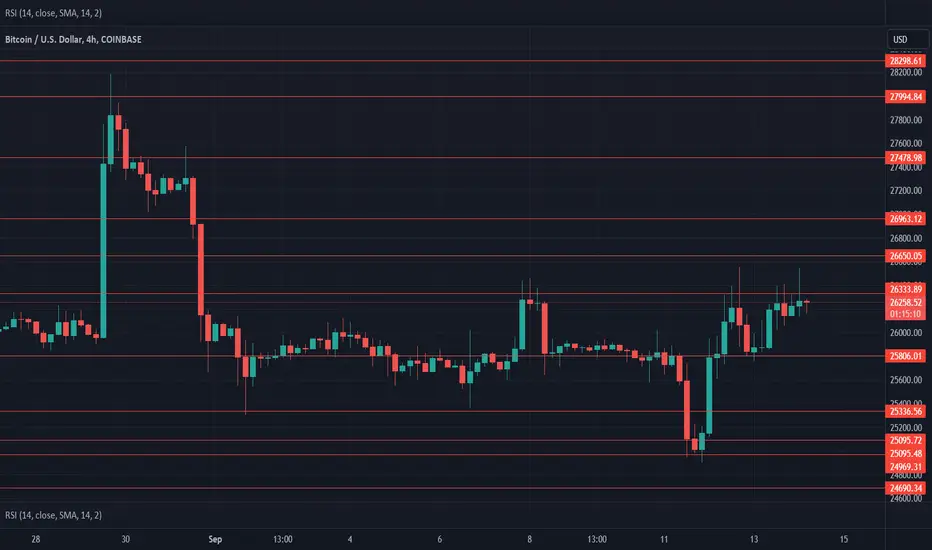
$BTC Daily UpdateCRYPTOCAP:BTC #Bitcoin continues to struggle at $25,806, last 1D close looks fine, bearish engulfing on previous 4H close, volume remains weak. Spent over 10 days below $26,333 now, $27,994 key resistance, $26,963 support required to test, $25,336 current support.

Bitcoin Might try 26.1 over the weekendBitcoin went up and dropped back to our yellow line - some FVG gap to clear at 26.1 and could also sweep the lows.
Thanks for watching

$BTC Daily UpdateCRYPTOCAP:BTC testing $26,333, Previous 4h closed bearish with resistance holding good, bullish engulfing on 1D previous close, gaining $26,650 support will allow to test for $27,478. Watch given S/R

Bitcoin Might Change Direction to upside todayBitcoin hit 25.3 for the third time. Everytime we touch it we went up.touching 25.3 for fourth time could result in losing the support and going lower
Thanks for all your support.

$BTC Daily UpdateCRYPTOCAP:BTC $25,336 support retested, struggling to regain $25,806, $27,478 support required to reattempt at $28,298. Poor volume as it was, watch given S/R

Bitcoin Gives More Sell Signals.Is it a Pullback Or Reversal?Bitcoin Giving us multiple sell signals so far.Losing 25.1K could be catastraphic for BTC.Whatever it is, its comin very soon (maybe today)
Thanks for watching
