BITCOIN- MONSTER ORDERS IN THE BOOK -> You Know What This Means COINBASE:BTCUSD “Monster orders” are exceptionally large buy-limit orders clustered roughly 7 % beneath the current market price.
Large buy-limit walls can act like a price magnet—deep liquidity attracts algos and traders hunting fills, often pulling price straight toward the level.
Once the wall absorbs the selling pressure, the magnet flips: liquidity dries up, supply thins, and price can rip away from that zone with force.
They create a visible demand wall in the order book, signalling that whales / institutions are ready to absorb a dip and accumulate at that level.
Price will often wick into this zone to fill the wall, then rebound sharply—treat the 7 % band as potential support or entry.
Such walls can act as liquidity traps : market makers may push price down to trigger retail stop-losses before snapping it back up.
Confirm that the wall persists as price approaches and that spot + derivatives volume rises; if the wall disappears, it may have been spoofing.
Always combine order-book context with trend, momentum and higher-time-frame support for higher-probability trades, Just like the extremely powerful indicators on the chart.
🚀 Marty Boots | 17-Year Trader — smash that 👍, hit LIKE & SUBSCRIBE, and share your views in the comments below so we can make better trades & grow together!
BTCAUD

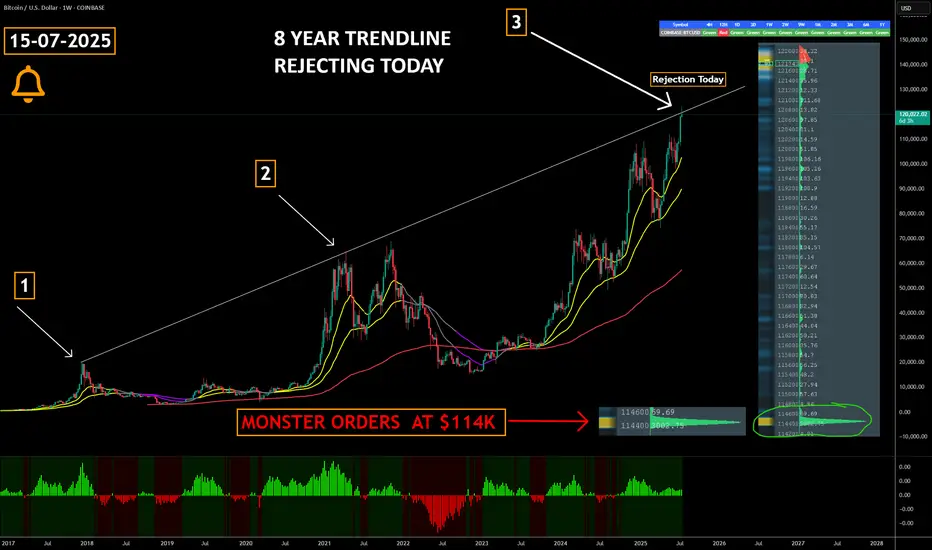
Did Bitcoin Just TOP OUT ??????
COINBASE:BTCUSD has just collided with an 8-year rising trendline that capped the market’s last two cyclical peaks—historically, this level has triggered multi-month corrections and Bear Markets.
Triple-test significance : a third touch of a long-term trendline ➜ heightened odds of a reaction; failure to break cleanly often confirms a major top.
Watch for confirmation signals —weekly bearish RSI divergence, waning volume, or rejection wicks can validate a reversal scenario.
Breakout = regime change : a decisive close and hold above the line flips it to support, opening the door to fresh price discovery and potential parabolic upside.
Large Orders at $114k create a visible demand wall in the order book, signalling that whales / institutions are ready to absorb a dip and accumulate at that level.
Risk-management alert : consider tightening stops, reducing leverage, or hedging until trendline fate is resolved.
The buy pressure has been relentless but this is always worth paying attention to
Marty Boots | 17-Year Trader — smash that , hit LIKE & SUBSCRIBE, and share your views in the comments below so we can make better trades & grow together!
Ethereum Is Not DEAD ... WHY ??? Because BlackRock Says SoMartyBoots here , I have been trading for 17 years and sharing my thoughts on ETH here.
ETH Is Not Dead — It’s Just Getting Started
Narrative of ETH being “dead” is short-sighted. Here’s why:
1. Ethereum Is Still Younger Than Bitcoin
• Ethereum launched in 2015, a full 6 years after Bitcoin.
• BTC had over a decade of network effect, price discovery, and global trust before ETH even got its first DApp.
• On the charts, ETH still has room to mature, just like Bitcoin did pre-2020.
• Fundamentally, Ethereum is still evolving — from PoW to PoS, scaling solutions (L2s), and now modular chains.
You’re not late to ETH — it’s just halfway through the marathon.
⸻
2. BlackRock’s BUIDL Fund Is a Massive Signal
• The BlackRock BUIDL fund, launched on Ethereum, already has $3B in AUM — and it’s growing.
• It shows that legacy institutions aren’t ignoring ETH — they’re building directly on it.
• This isn’t speculative hype. It’s tokenized real-world assets backed by the biggest asset manager on earth.
• Smart money is moving into ETH, not away from it.
The narrative is shifting. Institutions aren’t betting on meme coins — they’re betting on Ethereum rails.
Final Thought
ETH is not dead. It’s undergoing the same early-stage skepticism BTC did in its early years. With foundational upgrades and institutional validation, ETH might be the most undervalued top asset in the market today.
⸻
Watch the chart. Track the fundamentals. And don’t sleep on ETH.
#Ethereum #ETHUSD #Crypto #fundamentals #BUIDL #BlackRock #OnChainData #NotDead #TradingView
Watch video for more details

☄️ Bitcoin : If You're Believer 🅱️ I'd Be A Buyer ☀️Bitcoin 🌏
I'm Going To
Put It To
You Plain And
Simple
If You're Long Term Investor/Believer
I'd Be Buying At These Levels
🎱
BTC/USD
BTC/JPY🏯
BTC/AUD
BTC Total Market Cap
BINANCE:BTCUSD
CRYPTOCAP:BTC
INDEX:BTCUSD
👩🏼🚀👩🏼🚀🚀

BREAKING NEWS - India launches missile attack on Pakistan
🚨MartyBoots here , I have been trading for 17 years and sharing my thoughts on btc here..
🚨
BTC is a geopolitical asset
Could The Stock Market Crash? - WARNING 🚨MartyBoots here , I have been trading for 17 years and sharing my thoughts on SPX .🚨
🚨 SP:SPX Could It Crash?🚨
Lets look into it deeper, very interesting chart but also a dangerous one. Need to see buyers soon or this is could be worse than people expect. 5-10% drop minimum and extreme bear could drop 40% total🚨
Watch video for more details

Were To Buy BITCOINMartyBoots here , I have been trading for 17 years and sharing my thoughts on COINBASE:BTCUSD here.
.
BTC is very interesting chart for now that it has dipped 30% and trying to find support.
Do not miss out on BTC at the important levels as this will be a great opportunity
Watch video for more details

How Trumps Tariffs Are Affecting Bitcoin & Crypto MartyBoots here , I have been trading for 17 years and sharing my thoughts on COINBASE:BTCUSD talking about how Trump Tariffs affect COINBASE:BTCUSD here. I also talk about the stock market SP:SPX at the end of the video and TVC:GOLD as the chart give us real insights .
Watch video for more details
Trump’s tariff policies have had a notable short‐term impact on Bitcoin’s price. When tariffs are announced—such as the recent ones imposed on imports from Canada, Mexico, and China—the resulting trade tensions and uncertainty tend to trigger a “risk-off” reaction in the markets. Investors, worried about higher inflation and potential rate hikes by the Federal Reserve, often sell off volatile assets like Bitcoin, which can lead to steep, albeit temporary, price declines. For instance, following tariff announcements, Bitcoin’s price has sometimes dropped significantly (even approaching multi‐week lows) before partially rebounding when there’s news of tariff pauses or negotiations easing the pressure.
In the longer term, however, the picture is less clear. While the immediate market reaction is one of volatility and decline, some analysts argue that if tariffs contribute to sustained economic uncertainty or inflation, Bitcoin could eventually be seen as a hedge—similar to digital gold—potentially restoring investor confidence over time. Ultimately, the overall effect on Bitcoin will depend on whether the trade policy uncertainty continues and how broader economic conditions evolve.
There is still lots of bullish news for BTC www.tradingview.com

Where To Buy The Blood On BTC & ALTsMartyBoots here , I have been trading for 17 years and sharing my thoughts on BTC and where to buy the BLOOD .
BTC looks weak so be careful
Do not miss out on the dip as it can be a life changing opportunity
Watch video for more details

BITCOIN Is Following 1970s GOLD Parabolic Run MartyBoots here , I have been trading for 17 years and sharing my thoughts on Bitcoin here.
Bitcoin is looking beautiful , very strong chart for more upside
Very similar to Gold which ran huge coming into a new year
Do not miss out on Bitcoin as this is a great opportunity
Watch video for more details

WARNING -------We Are HereMartyBoots here , I have been trading for 17 years and sharing my thoughts on Bitcoin.
Bitcoin is looking beautiful , its a great chart with lots of buying pressure
Very similar to Gold back in the 70s
Do not miss out on the next dip as it may be your last chance = this is a great opportunity
Watch the video for more details

Bitcoin Production Cost Strategy With 100% Success Rate $$$MartyBoots here , I have been trading for 17 years and sharing my thoughts on PEPE .
BTC is looking beautiful ,Very nice chart for more upside
Production cost has NEVER been wrong
Be Prepared
Watch the video to see for yourself

BTC Dip - Sunday 4th August 2024BTC-USD BABB 12 Hour Chart
Sunday 4th August 2024
We appear to have melted through the channel marked out, but are on target for the Fibonacci retracement levels of $59,460 USD . We have already hit $59,877 and we have a lower fib level of $58,170 USD to hit, which I think we would get a good bounce off to continue trading in the range we have seen the last month or two.
I did say in the previous report that in AUD it translates to a $90k to $94.5k AUD buy range, which would be a good entry if you wanted to trade this chop. We are currently at $93k AUD, and did dip into the GETTEX:92K area. Keep some bids in for some lower dips to lower your average buy price.
On the daily, we are on a TD5 count and if this was to be perfected, we are looking at a low on Wednesday 9th August before we head back up into the top of the range.
Note there has been weakness in the DXY, and BTC has followed on the news of weak unemployment figures in the US and talks of possible rate cuts in September, all lining up to prop up markets leading into the US elections.
Be on the look out for more PsyOps, Cyber Attacks or war flare ups which would increase the cost of crude oil and crash markets.
Stay vigilante Crypto Pirates.
Peace in the Middle East.
f.society, f.police, f.govt, f.politicians.

BITCOIN IS THE NEXT AMAZONMartyBoots here. I have been trading for 17 years and I am here to share my ideas with you to help the Crypto space. The Bull market is here
Even tho the bull market is here BTC has not fully mooned yet there is still time to buy on DIPS . The market has just hit a critical level . This is a bullish structure and dips are buys, when these dips happen BTC can start its move higher . This needs to be watched carefully.
BTC To The MOON
Please watch the video for more information

Bitcoin - Dont Fear The Dip MartyBoots here. I have been trading for 17 years and I am here to share my ideas with you to help the Crypto space. The Bull market is here
Even tho the bull market is here BTC has not fully mooned yet there is still time to buy on DIPS . The market has just hit a critical level but should go lower when ready. This is a bullish structure and dips are buys, when these dips happen BTC can start its move higher . This needs to be watched carefully.
BTC To The MOON
Please watch the video for more information

Combined script of MavilimW and DARVAS BOXBuy Signals:
MAVW Buy Signal: This signal is generated when the MAVW crosses above its previous value. You can use this as a bullish confirmation.
Darvas Box Buy Signal: The Darvas Box doesn't have a specific buy condition defined in your code, so you might want to add one. Typically, traders look for price breaking out above the upper boundary of a Darvas Box as a potential buy signal.
Sell Signals:
MAVW Sell Signal: This signal is generated when the MAVW crosses below its previous value. You can use this as a bearish confirmation.
Darvas Box Sell Signal: Similar to the buy condition for the Darvas Box, you can define a sell condition based on the price breaking below the lower boundary of a Darvas Box.
To make these signals more actionable, you can consider using a combination of these conditions. For example:
Ideal Buy Points:
Buy when MAVW crosses above its previous value (MAVW Buy Signal) AND the price breaks above the upper boundary of a Darvas Box (Darvas Box Buy Signal).
Ideal Sell Points:
Sell when MAVW crosses below its previous value (MAVW Sell Signal) OR the price breaks below the lower boundary of a Darvas Box (Darvas Box Sell Signal).
Keep in mind that you may need to adjust the parameters and conditions based on the specific financial instrument you are trading and the time frame you are using. Additionally, consider using stop-loss and take-profit levels to manage risk and lock in profits when trading with this strategy. It's also a good practice to backtest the strategy on historical data to evaluate its performance before using it in a live trading environment.

BTC AUD Price Monthly Chart Leading into the End of the YearBTCAUD Monthly Chart
VZO PZO is indicating it is overbought.
Saturday 12th August 2023
Monthly Chart
Take note crypto pirate heads, we are on a green TD8. USD Chart -
The candle is green so far just above the short MA.
So we could be up for 1 more month of upside, if any? Then a 1 to 4 correction leading into the end of the year, which is what we encountered in 2019, and similar downturns leading into the end of the year in 2014 and 2018.
The halving is now estimated to occur on the 5th April 2024.
So this is sort of playing out as in previous halving's where there is a bit of a downturn, or choppy mostly sideways action before BTC rips. So, could we be seeing a similar sequence of events here? Time will tell.
But also be aware of macro market events worldwide, could also have a impact on BTC price. September / October 2023 will be interesting to see what happens with stocks and bonds and how it impacts BTC price.
We may get some more juicy entry points that others may not anticipate, or we could see complete decoupling of BTC price action compared to fiat systems.
If you bought in Feb this year when the blue hash ribbon signal flashed a buy, you are sitting pretty good at this point, well positioned for the next halving / post halving rocket.
Time will tell.
In AUD terms we are currently sitting at $45,260. We could see price move up to circa $46,966 to $48,579 before we see the 1 to 4 correction or we could just continue to chop sideways. It will be interesting to see if we get sub $33,707 AUD.
Happy sailing crypto pirates!
f.govt, f.society f.banksters f.police
Snake Plissken is clockin out.

BTC - Leading into the end of the year - 2023Saturday 12th August 2023
Monthly Chart
Take note crypto pirate heads, we are on a green TD8.
The candle is green so far just above the short MA.
So we could be up for 1 more month of upside, if any? Then a 1 to 4 correction leading into the end of the year, which is what we encountered in 2019, and similar downturns leading into the end of the year in 2014 and 2018.
The halving is now estimated to occur on the 5th April 2024.
So this is sort of playing out as in previous halving's where there is a bit of a downturn, or choppy mostly sideways action before BTC rips. So, could we be seeing a similar sequence of events here? Time will tell.
But also be aware of macro market events worldwide, could also have a impact on BTC price. September / October 2023 will be interesting to see what happens with stocks and bonds and how it impacts BTC price.
We may get some more juicy entry points that others may not anticipate, or we could see complete decoupling of BTC price action compared to fiat systems.
If you bought in Feb this year when the blue hash ribbon signal flashed a buy, you are sitting pretty good at this point, well positioned for the next halving / post halving rocket.
Time will tell.
In AUD terms we are currently sitting at $45,260. We could see price move up to circa $46,966 to $48,579 before we see the 1 to 4 correction or we could just continue to chop sideways. It will be interesting to see if we get sub $33,707 AUD.
Happy sailing crypto pirates!
f.govt, f.society f.banksters f.police
Snake Plissken is clockin out.

BTC/AUD | Short Assumption | Rate Hike NewsExpecting BTC to continue its push down range against the AUD off the back of interest rate hike news expected out of australia in the coming minutes. Expecting price to reach indicated TP-1 level and may even continue to push down further.

BTC UpdateBTC As suggested we testing the $28k previous bottom will see if can hold daily candle above 90mins

BTC AUDMonday 9th May 2022
The ascending channel is still in play
In this current bear, this is the second time it has tapped the bottom of this channel, so it could be getting ready to spring board up
But with all the uncertainty around at the moment, there could be some more downside, with wicks down to the next lower fib curve at $42,328.
So long as closes are above the bottom of the channel, we should see some upside and a test back up tot he 33 day MA and the downward yellow dashed trend line.
Approximately 24th June 2022 (24/06/2022 - 666) we could see a break up.
The bottom of the ascending channel and the yellow dashed descending trend line converge here.
Or this could be the sign of the break down further and final shake out of all the weak hands before the next grind up out of here, for the full parabolic move on the logarithmic growth curve we have been waiting for.
All MA's are tipping further down
MACD has some more downside to go before reversing
Price and volume oscillator has just triggered and oversold green signal, and has hit the bottom purple band indicating a bottom is in. From here, we could see a bounce into the middle of the ascending channel where the 88 and 147 day MA's are at ~ $$56,087 to $64,816.
Further downside could be located at the $33,689 TD Risk Level.
Tuesday 10th May 2022
The ascending channel is still in play
We have had a wick down to $43,607, but the body of the candle is still within the channel.
But, we are still only on a TD 3 count, so still early days.
If the channel gets broken, then next two Fibb channels are target buys.

💡#i31: GlassNode BTC Avg. #️HASHRATE Daily's👨🏻🔧🎇🧵Blazing into fresh grounds 🔥
Bitcoin Average Est. Hashes P/Sec
*Note* Current diverging strength 💪🏼
of the #HashRate as compared to
Softer BTC/Crypto Price action.
Detailed Variants of Idea Chart Below :
GLASSNODE:XTVCBTC_HASHRATE
COINBASE:BTCUSD
BINANCE:BTCBUSD
BINANCE:BTCUSDT
BITFINEX:BTCUST
FOREXCOM:BTCAUD
CRYPTOCAP:BTC

BTC 1 month time horizonStructure looking weak, kinda looks like a mini fractal of the April breakdown. If the lower high prints, further weakness
