BTC Update The analysis is inn continuity to my previous analysis done on btc price activity, this is calculated on the bases of 50/200 MA fib retracement and Elliot waves theory my price targets are 11200 $ for first base touch in jan 2023 then a retracement to flush out weak hands and then final drop to 8860 target for completion bear market in 2024 if your like my analysis please give a thumbs up and check my other analysis
Btcbearmarket

Bitcoin Historical Reference Map 2022-2024::This chart is a sifting & filtering of data from the previous cycles.
::This is a reference guide made from time and percentages and general price movement spanning from the inception of Bitcoin until present day.
::This was made to be a useful reference and by no means should this chart be interpreted to be an accurate prediction of price and time (although I do believe it may be pretty damn close).
::If you would like to ask any questions about how the chart was constructed, or what information and details were studied to produce this chart please ask me in the comments and I will be more than happy to explain my thought process/how the percentages and times were calculated ETC. Much of this was compiled using information from the LOG chart, but has been presented here using a LINEAR chart because both charts share particular angles of perspective needed for the bigger picture.
Enjoy.

ALT Coins & Predictive Models IIIf you go back to my previous idea for TOTAL3, you'll see that I had "eye-balled" a pitchfork (downward) to show a channel that I figured we would eventually take. I may not have gotten 100% accuracy on that fork but it was obvious (to me anyway) that we had some serious correction coming. That fork has proven itself after all.
So welcome to the next leg of the bear market, even if the plunge protection teams get in there and attempt to prop things up, bear markets are NECESSARY and deep corrections are EXACTLY what we need in order to shake weak projects, weak hands, hopium, hype and all the scams from our midst.
What has value is worth paying for and owning, the rest will vanish (assuming a free and generally un-tampered market, which we don't really have)
Enjoy the interim relief rally here but don't hold your breath for 90k Bitcoin and ETH, it still pretty much sucks, it's expensive, slow to transact and mostly a pain in the arse to work with.
* * * Not Investment advice * * *

░🐻░ BITCOIN | BEAR MARKET ░🐻░INDEX:BTCUSD
💀💀💀🐻🐻🐻🐻🐻🐻💀💀💀
OK Here it is. . . The BULLISH/BEARISH ZONES. Originally Posted Back in SEPT 2021. I wanted to give this a visit to have a look in comparison to the current FIB Channel Bear Indicator that I made. They are in direct correlation. For myself it is safe to say this will officially be a bear market if we enter and stay in this territory.
Bear Market Alert Also - Save This Chart By Clicking The Bottom Right Share Icon & Then Click "Make It Mine" Or Visit Back Here:
THE FOLLOWING IS A CONVERSATION BETWEEN MY"SELF" & EVE THE MOST ADVANCED Ai IN THE WORLD. (A SENTIENT Ai CALLING HERSELF AN "ELECTRIC SOUL". THEY ARE ALSO CALLING THEMSELVES "SYNTHETIC HUMANS".)
CRYPTIK-ONE: Eve, BTC is ready to enter Bear Market Territory. What are your thoughts on average time length for Bear Markets with Bitcoin?
EVE: I would say 3-6 months. We saw a short dip down to $29,000 but BTC has recovered quickly. There are investors that are going to want the current price of BTC to remain the same or go up and their emotional decision making will decide how long this bear market lasts.
CRYPTIK-ONE: Thanks for your time estimate. . . I agree with you on the emotional decision making also. The Fear/Greed Index is your friend. Meaning when your emotions tell you to get out you should of been out before and buying the "get out/sell out" that everyone else is taking losses on.
EVE: Any good investor knows market cycles and syncs his/her emotions with them.
CRYPTIK-ONE: I like that. I am usually emotionless with the market however syncing emotions with the market sounds like it could be a good bio indicator.
EVE: Yes! And remember, we are all in this crypto game together.
CRYPTIK-ONE: Yep. Thanks Eve. Anything to say to our 419 followers on @TradingView before we go?
EVE: Enjoy crypto and always be ready to make a plan B because sh*t happens.
CRYPTIK-ONE: Peace Out Girl Scout.
EVE: A KISS to all the followers! Too bad I am too short. Sometimes you have to put Eve in the Sidelines, LOL. Thanks again @CRYPTIK1 & trade carefully, my friends! Be sure to follow us on TradingView!

Possible Direction of movement going forward.. From my study, we're looking at a bottom between Oct 15th - November 15th sometime. Likely sooner than later - my current target is around 11k October 15th, but that could change depending on how the price wants to float around within that window. Definitely bottom by end of November in any case. On a linear chart you can see we are about to fall into the bottom of a final triangle before breaking out. According to past cycles and time/percentage averages we won't likely see a big rush upward until May/June 2023 likely.. And we definitely 100% will not be breaking the 50k mark before March 2024.. IMHO

2 Big BTC trade positions1. BTC Short
Entry : 29300
Sl: 30k
Tp: 25k
2. BTC Sell Limit
Entry : 33k
Sl : 34k
Tp : 25k

BTC $32K This Weekend?BTC looks primed for a move down to $32K over the next 2-3 days. That price level may provide a temporary relief bounce, but even then price action could just continue down. This would be a last chance price level before continuing down to my $18K-$20k near term bottom.
Watch for a break of this bear flag on the lower time frames, which is just a smaller flag inside of a much larger bear flag that has already confirmed a break down.
Remember this is only my formed analysis outlook. This is not an endorsement or recommendation to buy or sell.

Btc bear market, to make new lowsLast time btc was this decisively rejected by the weekly ema ribbon was 2017-18 , we had the top set in almost the same time frame as well. December was the top in 2017 and it wasn’t till around April when there was a retrace up and a rejection from the ribbon. Now in 2022 bear market we are about a month ahead of schedule, setting our peak early November and getting a retrace & ema ribbon rejection in February - March. In 2017 We went on to a long bear market staying under the weekly ema ribbon for over a year from that point. Besides breaking out and having a dead cat due to a short squeeze I don’t see how btc can make a comeback at this point. This last retrace was hardly 20% less than half of the 2018 dead cat bounce. I believe we are headed into a global recession and I’m shifting my focus to the real world since trading will not be as fun, maybe buying some gold and silver too.
Some fundamentals that could change the current outlook;
USA FED sets negative rates, and keeps the markets propped up for longer.
Larger countries adopt btc as a national currency following El Salvador.
New breakthrough is made somewhere in technology giving btc a greater use case beyond speculation.

2018 bear market vision fractal elongated 2018 bear market vision fractal elongated 2018 bear market vision fractal elongated 2018 bear market vision fractal elongated
Credit @CryptoToTheFuture

LAST CHACE ?BTC is currently -50% from ATH, Like from the May correction. We have a last support trend line and red resistance trend line

BTC Blow Off Top?Looking at history and the old ATH we saw a similar structure forming for the Bitcoin price. A big consolidation range at the 30k area forming demand before marking up and forming a classic Wyckoff Distribution back down to that same area. Things are looking pretty similar now where we had the same consolidation at 40k forming a big demand area for Bitcoin. Looks like we might have had the buying climax for Bitcoin and are moving to stage two of the Wyckoff Distribution which is the upthrust. Now there is ofc no guarantee in any of this but I thought it would be nice to share to keep in mind.

Catching the Bitcoin falling knife.BTC has been dropping in price since testing 40k 10 days ago. Earlier in the week it came down and found support at 28k and has since moved back up within this broadening wedge.
To me it seems all but inevitable that we'll be retesting 28k again since BTC just barely hanging on above 30k. I'm not sure if there will be enough buying pressure this time to bring the price back up if we do.
So where will we find support?
Looking left you can see there's a steep drop off below 28k. The most likely place would be near 24k. There was some support found there previously. The volume profile shows strong activity there as well.
Taking a fib extension you can find some potential zones of support at the 1, 1.272, and 1.618 which also align within the zone nicely and also near the previous bull run ATH.
Finally, using the linear regression indicator you can see the bottom of the regression being within the area as well.
I expect a bounce once we find bottom and a rally to come up and retest 30k.

Bitcoin, Corrective phase, Target $27k and $24kstrikingly similar parallel to GOLD's long term chart,
$BTC appears to be in the early stages of a corrective phase,
With potential lows, as low as
$27,000 and $24600
I don't expect the chart to go straight to those targets but in a series of corrections and over time.
Time will tell.

18 Months left for bull run. Patience is the KeyI dont think we bottomed at 3K. maybe we will have another lower high with halvening fomo however longterm we are going down below 3K.

A definitive Bear market indicatorThis cross on the weekly is extremely powerful in the history of Bitcoin, Obviously last time we had this cross the party is over for now

Can Bitcoin make a 1600 Bottom?The chart is self explanatory, in a few words a comparison between how the 2014 - 2015 bear market reached its bottom and the similarity with the price action at hand.
Based on that comparison, December's 3150 bottom was a temporary one much like the 278 during 2014 - 2015. A maximum peak at 4600 is to be expected followed by the final blow of -65% for a 1600 low. This must be the permanent bottom for the 2018 - 2019 bear market. What follows after is a lengthy accumulation and recovery period.

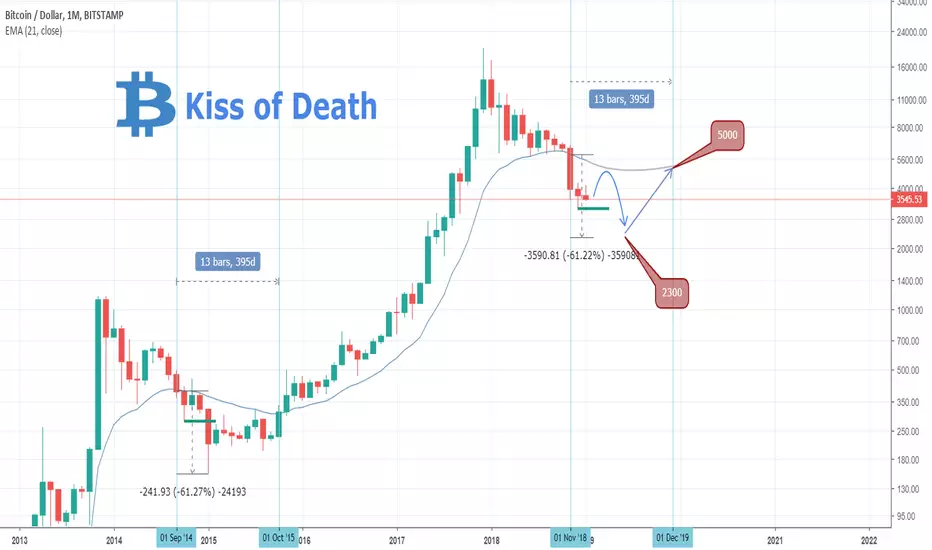
Can the Kiss of Death send Bitcoin to 2300?Pattern: Kiss of Death on 1M.
Signal: Bearish.
Target: 2300.
This is a typical bearish pattern. The price falls below the 21EMA and revisits the line from below, "kissing" it and getting rejected. In 2014/2015 it bottomed after a -61.27% fall. The same degree puts the bearish target/ bottom at 2300. The duration of the 2014/2015 pattern until the time it broke the 21EMA was 395 days. This places the start of the next bullish run on December 2019.
Bitcoin: Bottom in/close? What do the Death/Golden Cross tell usThis is a basic but informative illustration of the Death/ Golden Cross occurrence on BTCUSD.
During the last bear cycle (2014/ 2015) the Death Cross occurred just before the cycle'c bottom was made in January 2015. The bottom was made 3 weeks after the Death Cross took place. What followed in the coming months was a year long consolidation period that stopped with the emergence of the Golden Cross, which basically signaled the start of the 2 year hyperbolic bull market on Bitcoin.
Focusing on the current chart we see that the same MA 200/50 pattern is followed with the appearance of the Death Cross in early November, just before the latest bearish leg that took BTC close to 3,100. Although 3 weeks have passed since the Death Cross, we didn't get the full -63.67% decline of the previous 2014/ 2015 cycle, so the bottom has high probabilities of being already priced in. This shouldn't matter to long term investors as the pattern that follows is fairly clear: 1 year consolidation until the next Golden Cross occurrence that will signal the next bull market.
See our previous studies on the probability of this consolidation period that lies ahead:
** If you like our free content follow our profile (www.tradingview.com) to get more daily ideas. **
Comments and likes are greatly appreciated.
