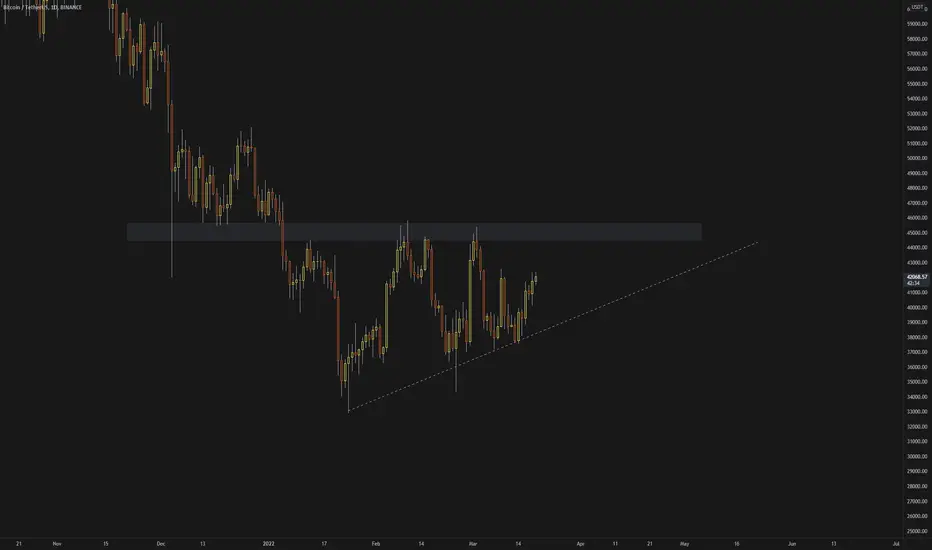
📈 BTC Chart AnalysisBTC has had a semi-impulsive move to the upside after finding some support.
The next target for BTC is to break $46,000 with a full candle close above this price.
We would then be looking at heading north of $50,000.
Btcbullish
BITCOIN 165k before 22k!Happy Sunday Everyone! 😃
This is a mid to long-term bullish scenario for Bitcoin.
The Idea is simple, as you can see BTC has never fallen below the 200 Week SMA (black line), not even during black swan events like the start of the pandemic in 2020.
We can also see that after the previous ATH's in 2013 and in 2017 , the price dropped roughly by an average of 85% .
The conclusion of this idea is that Bitcoin hasn't found the top yet as an 85% correction from the current 69k top would take us to about 10k and we would have to break the 200 week SMA which as previously mentioned, has never been broken.
Hence a result, to imitate the behaviour of Bitcoin during and after the ATH's in 2013 and 2017, BTC would have to rally to about 165k before dropping back down to the 200 week SMA roughly between 25k and 22k .
I would like to add that this post is meant exclusively for educational purpose and that non of my posts are financial advise.
As always, A BIG THANK YOU for stopping by, I hope you liked my post! If you did, please take a second to drop a like or comment, every engagement puts a smile on my face, but also helps me to get my ideas out to many more of you guys! 😃🙏
Happy Trading ✌♥📈

165k BITCOIN Prediction Too CONSERVATIVE?!Happy Monday Everyone! 😃
The title says it all, I'm going over my very controversial chart from yesterday where I predicted a 165k top for BTC .
I will post an updated more detailed version of the chart in the coming days.
Please make sure to check out my other posts too if you liked this one!
And finally a massive THANK YOU to all of you new followers and THANK YOU to @TradingView for publishing my post on to the front page of the website! 🙏🚀😃📈
I would like to add that this post is meant exclusively for educational purpose and that non of my posts are financial advise.
As always, A BIG THANK YOU for stopping by, I hope you liked my post! If you did, please take a second to drop a like or comment, every engagement puts a smile on my face, but also helps me to get my ideas out to many more of you guys! 😃🙏
Happy Trading ✌♥📈

BTC Wave-by-Wave Analysis 2: Bullish ScenarioThe recent pump of BTC from 37k to 44.2K is a clear sign of an impulsive wave, however, the internal counts of the said pump are not yet completed. I am projecting a 5th wave extension of the third wave 44.8K-46K zone which will also challenge the 45.8K horizontal support. When these zones are reached I am expecting a retracement of the completed 5th wave extension of the third wave that can go as low as 39.4-41.4K which is also supported by the volume going down. Invalidation of the 5th wave is at 37948 and will be confirmed when it goes down below 37K.
Although, I have chosen neutral here for I am only expecting a mini pump but in the higher timeframe, I am still bullish unless my technical analysis gets invalidated.

BTCUSDT 4HRS CHART UPDATEHello friend,
Welcome to our BTCUSDT 4hrs chart.
As we can see in the chart of BTCUSDT a Double Bottom is forming.
Which is a Bullish sign.
The price is currently Level 2 and Level 3.
The price can move to its next Level 4 and Level 5.
Thank You
And
God Bless You All!

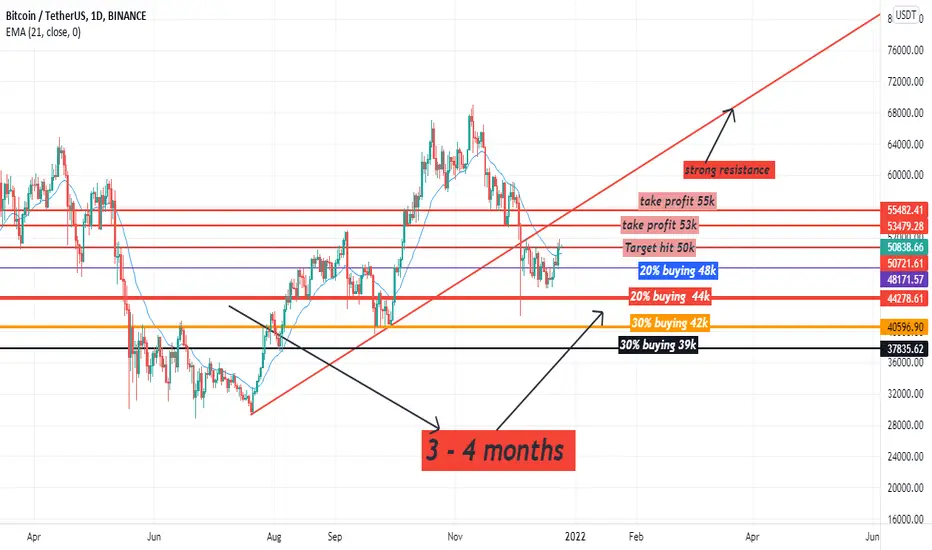
BITCOIN Support & Resistance Levels Identified!Hi Everyone! 😃
Hope you are all doing well after we had some better news in the last couple of days!
Just a quick and easy one to identify our current levels that are relevant to keep this potential BTC trend reversal going.
It's all in the chart 👆📈
THANK YOU for your time!
Like 👍 = 😃
Comment 📜 = 😁
Follow 🚀🚀🚀
Happy Trading ✌♥📈

Bitcoin Flipping bullish after months of getting dumped onbut how far will the baby bulls go this round? but how far will the baby bulls go this round? but how far will the baby bulls go this round?

BTC Closed with WEEKLY Green Dot. Significant sign!!!! BULLISHNotice Past 3 green dots on cipher since JULY, ALL significant. TO the MOON! Also inverse h&S on daily
Targets to 48k,

BITCOIN Weekend Zone!Happy weekend everyone! 😃
This is where I see BTC this weekend, it's all in the charts, but I would like to add that the fact that stock markets showed a solid performance on Friday,
and that shows up in the form of bullishness including higher lows on the smaller TF BTCUSDT charts.
That is what leads me to believe that we won't reach the bottom support here just yet and aremore likely to stay above the 35k area throughout the weeken.
On the upside I expect a few attempts to break up above the 38k resistance , but as for now I don't see enough volume to take us above 39k to a high maximum of 40k .
I would like to add that this is only for educational purpose and in no way a guarantee that it will play out this way, nor is this or are any of my posts financial advice.
Make sure to check out my video 🎬👇 from yesterday where I speak about everything more specifically including larger TFs :
Thanks for stopping by, I hope you liked my post, and if you did, please drop a like or comment, it helps me to
improve my ideas and puts a smile on my face! 😃🙏

Bitcoin Cryptocurrency 4H ForecastBitcoin (BTCUSD)-
BTCUSD trades weak for the past one week and hovering near a major support zone of $40000.

BTCUSDT Long on Cup & Handle Reversal PotentialNon-traditional use of the cup & handle, but it's too clean not to play. Stop losses tight as always. I did multiple timeframe analyses, and BTC looks bullish at this point, so this only further confirms it for me.
Chart speaks for itself. I'm getting in and riding it to that previous support zone. (Never financial advice)
Happy trading, everyone,
Stefan
A-Stock Trading

BTC USDT technical analysisHI I am just 12 years old. I learned of crypto and trading for 4 months. And can you see my mistakr. And thank you so much. Pls follow me and like :)

BTC Full update my target hit
in this time btc in bear market
so set your limit order to support and hold btc

BTC-USDT ( bullish )Hi , I am 12 years old. This is my 8th technical analysis. This is only my analysis. And can you see my mistake and give me some advice. And thank you so much. Pls pls Follow me :) 💕💕

when will BTC bottom out sideways double top
could head down to the $41k support then bounce up
boring BTC

Bat Btc and Usdt pair looking great Bat both BTC and Usdt pair are ready to fly for a leg up. BTC pair moving up in the ascending channel and Usdt pair forming Cup and handle. Trade wisely and have some of these in your bag for web 3.0 hype.


Bitcoin is deciding ...Bitcoin is making a decision. Go or stay or fall.
Mr. Bitcoin Emperor is building the floor. And provided a good floor.
A beautiful triangle with a horizontal floor is a sign of this flooring.
There are two trend lines above the bitcoin movement that are waiting to be stopped.
The first trend line (No.1) is the floor triangle chord, which if the candle is closed today, Bitcoin will rise to $ 57,800, and after a break on the way will go up to $ 69,000.
There is another resistance which is the main downtrend line (trend line number 2). If Bitcoin starts to rise again tomorrow and closes the daily candle above line No.2, then we will see a rally.
The pattern ahead and Bitcoin's desire to climb reinforce this analysis.
The Bull market is ahead ... ... ...
Good Luck.

Fractals Fibs and a Feeling The 3 F'sI think we bounce from here then revert to 40 k this is just my opinion if I hurt your feeling I also own a tissue business I can send you the link lol ;)

btc going to 98k in novBTC super bullish so don't panic and don't trader with high leverage
because when BTC make new ath BTC every time show correction so this time
It's just a market correction So don't be a fool make the market super cool
I m bullish in nov every nov month BTC bullish
take a great look at this idea if you agree with the idea don't forget the like button

BTCUSDT short-term BullishBTCUSDT has broken the bearish trendline resistance, and now BTCUSDT seems to be making a short term bullish move. I predict the bullish movement of BTCUSD will reach the 53677.06 - 52630.94 area for two reasons.
First, there is minor resistance in that area. Second, both Fibonacci Expansion and external Fibonacci retracement golden ratio create a cluster area around the area. So based on these 2 views I assume BTCUSDT will continue its short term bullish run.

BTC BullishBINANCE:BTCUSDT
Bitcoin bullish tread line.........................................................
next target will 92k usdt
