BITCOIN DOMINANCEBTCDOM/USDT looking bullish we have a STRONG Support Trendline on Dominance and we have Demand Zone on 15min timeframe im waiting for this move on BTCDOM
Disclamer:
We are not financial advisors. The content that we share on this website are for educational purposes and are our own personal opinions.
Btcd

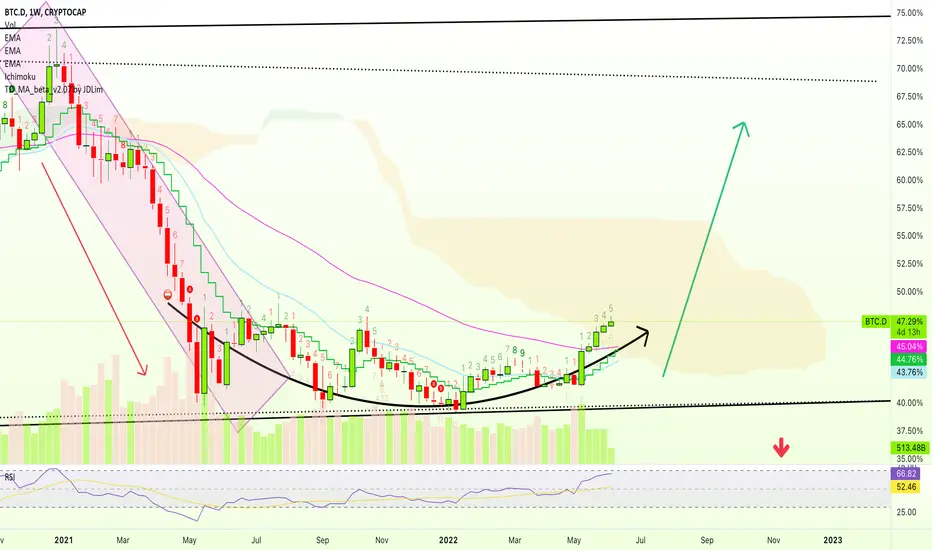
BITCOIN DOMINANCE giving us the right rally signalThis is an offer overlooked metric. The symbol BTC.D which represents the percentage of Market Cap BTC Dominance can be a reliable indicator for Bitcoin's (BTCUSD) long-term moves on a Cycle scale.
As this chart on the 1D time-frame shows, during the previous Bitcoin Cycle (pane below displayed in orange), the rally coincided with the BTC.D breaking above its 1W MA100 (red trend-line). On June 12 BTC.D approached it but fell sharply again below the 1D MA50 (blue trend-line), finding Support on the 1D MA200 (orange trend-line).
Right now the price is attempting another rebound, compared to late 2018 we can be anywhere within October - early December 2018, meaning that such volatility may be indicative of one last bottom before entering the new Bull Cycle. Regardless of that, crypto investors with patience in their mind can wait for the right opportunity to buy when the Bitcoin Dominance closes a week above the 1W MA100.
--------------------------------------------------------------------------------------------------------
** Please support this idea with your likes and comments, it is the best way to keep it relevant and support me. **
--------------------------------------------------------------------------------------------------------

Bitcoin dominanceBitcoin dominance seems to be in a wyckoff accumulation. Getting ready for the next major leg up. Which means, for long positions, it's probably better to long BTC. And for short positions, probably better to short altcoins. I'm overall pretty bearish on both.

$BTCDOM/USDT 4h (#BinanceFutures) Evening star on resistanceBitcoin Dominance just printed a reversal pattern with a shooting star on top, seems ready for a correction.
www.binance.com

Bitcoin Dominance letting Altcoins fly?Right now a lot of people are ready to send BTC.D to anywhere from 50 to 60 %.
50 % would be and obvious level to get rejecting and for the chart to turn around.
I've said it before. I believe we will see Dominance go to 47-49 %.
One last $BTC drop to $24-26,000 sending Dominance up in that area. That dip won't be long and Bitcoin would be back around $30,000 in no time.
More and more will start believing Bitcoin has bottom -> Faith in Etherium and Altcoins will be restored -> Dominance falls.
Be careful out there.
Please share and comment.

BTC.D can drop to 43%#BTCD
Bitcoin Dominance reached almost long term resistance and rejected.
🐻 it can drop to support zone around 43%, which is a bullish sign for #BTC and #ALTs
break down from 42.5% can drop it more to long term support zone and descending support, that give us great opportunity to make profit from #ALTCOINS.
🐮 if bitcoin dominance reject from support of 43% it will head up to long term resistance again and cause more drop for $BTC.

$BTCDOM/USDT 2D (#BinanceFutures) Rising wedge on resistanceBitcoin Dominance Index looks locally topped and about to reverse mid-term, let's give it another try!
Current Price= 1517.1
Sell Entry= 1517.1 - 1572.5
Take Profit= 1411.7 | 1311.6 | 1211.1
Stop Loss= 1656.1
Risk/Reward= 1:1.2 | 1:2.1 | 1:3
Expected Profit= +17.24% | +30.20% | +43.20%
Possible Loss= -14.40%
Fib. Retracement= 0.236 | 0.382 | 0.559
Margin Leverage= 2x
Estimated Gain-time= 5-6 months
Tags: #BTCDOM #BTCDOMUSDT #BTCD #BitcoinDominance #Index #Futures #Derivatives #Dominance
Contract:
www.binance.com

📊BITCOIN destroys ALTCOINS! How long will this go on?Bitcoin is falling but all money flows into it. Almost all alts are destroyed and fall for 85-90%. Only few of them still follow the BTC and fall for 65-75%. But is it finish for alternative coins fall?
Now the Dominance is close to the 50% which were described in this idea. I think the 50-53% are become the top for the BTC.D.
📊Even if Bitcoin falls to the bottom and consolidates there, altcoins continue to lose capitalization. And even if the decline of the crypto market has stopped, altcoins will continue to lose value. As a rule, this happens because long-term holders of altcoins become not by their own choice. If you know what I mean.
This was in 2018 and 2020 after Bitcoin fell to its lows. Altcoins begin their huge growth and Altseason✅ after the main cryptocurrency (BTC) renews✅ its highs and hype returns to the crypto market. So keep this in mind!
📈Why the Dominance in the long-term downtrend? The numbers of Altcoins is growing through the time and in any case money flows to the alternative coins. So, the dominance will fall to 20-30% with high possibility in 7-10 years .
Friends, press the "like"👍 button, write comments and share with your friends - it will be the best THANK YOU.
P.S. Personally, I open an entry if the price shows it according to my strategy.
Always do your analysis before making a trade.

BTC.D Intermarket Analysis This is the BTC Dominance (BTC.D) chart.
BTC.D Down = BTCUSD UP
BTC.D UP = BTCUSD Down
Right now the BTC.D Chart is at a discounted market, however, it seems to be trading up into a premium market which is (technically speaking) why BTCUSD has been falling recently. Based on this chart, BTC will likely drop a lot more from where it's at should we reach up into a further premium for the BTC.D market.
What is BTCD? BTCD is short for Bitcoin dominance (BTCD) and is defined as the ratio of Bitcoin's market capitalization to that of the rest of the cryptocurrency markets. Bitcoin (BTC) is a digital currency that was first introduced back in 2009.

BTC DOMINANCE WEEKLY UPDATEHello guys, here's a weekly update on the BTC Dominance chart.
We can see BTC is trying its best to maintain and stay above the $28k support level and on the other hand, the BTC Dominance is breaking all the ceilings. In the hourly and daily chart, the dominance is increasing and the picture isn't clear enough to understand where the resistance is. But in this weekly chart, we can actually see resistance 1 at 49.9% and resistance 2 at 52.9%. It is interesting to see that resistance 1 (49.9%) is the same resistance level from where the BTC.D got bounced and rejected multiple times in the past and once when the BTC.D broke above the R1 level, it made support at 52.9% which is now a resistance 2 level.
If we are expecting a bounce in the market then these are two resistance levels from where the BTC dominance should get rejected. Also, if BTC is completely bearish with a possibility of getting rejected below then our expectation then the BTC dominance can aim towards the 69% range which will be a 76% rally from the lower support trendline.
So, let's be vigilant cause the next move in the market will surprise us.
Thank you.

#BTC.DOMINANCE 1Hour CHART UPDATE !!Hello dear traders, we are new here so we ask you to support your ideas with your LIKE and COMMENT, feel free to ask any questions in the comments, and we will try to answer for all, thanks, Friends.
I have tried my best to get the best possible results in this chart.
Hello, dear traders welcome to this BTC.DOMINANCE 1Hr chart analysis.
Now Rejected from resistance and Holding 47.11% support.
We can see more Blood baths in #Altcoins
Remember:-This is not a piece of financial advice. All investment made by me is at my own risk and I am held responsible for my own profit and losses. So, do your own research before investing in this trade.
Sorry for my English it is not my native language.
Do hit the like button if you like it and share your charts in the comments section.
Thank you...

Bitcoin Dominance Mirror ImageBTC.D (Bitcoin Dominance) still needs to complete its "mirror image" back from December...
Currently, prices are trading safely above EMA10 and EMA50, long-term/weekly... This signal is strong enough.
We have multiple candles of bullish consolidation (green above EMA10) and the RSI is also super strong.
The signals are also bullish on this chart.
We wait and see how it goes.
Namaste.
USDT.D OutlookUSDT.D has made a descending pattern and cannot already tolerate above 6% range. Falls' phases expected by: 1st: 5.90% -- 2nd: 5.30% -- 3rd: 4.20%

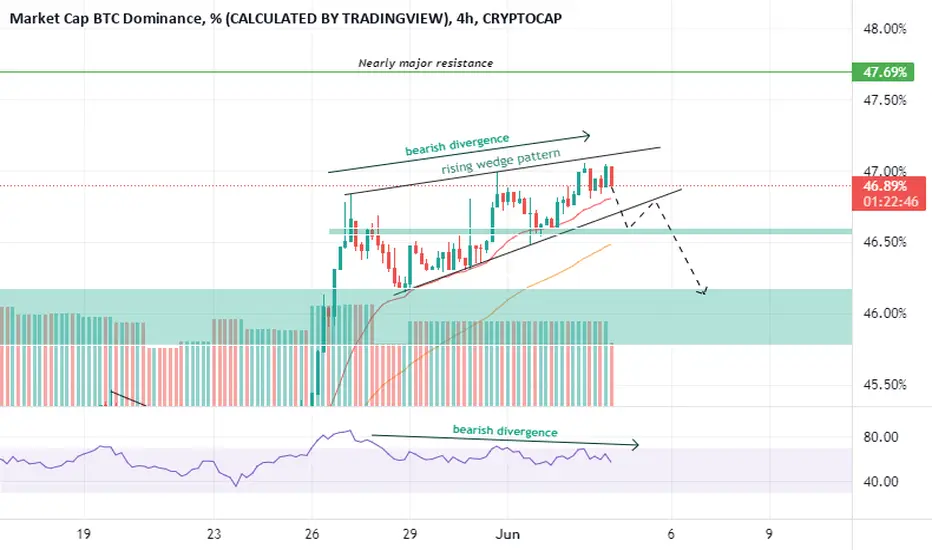
BTC.Domination Analysis 4 June 2022#BTC.D ANALYSIS
we can see BTC.D now make a rising wedge pattern And also any bearish divergence in RSI . Rising wedge valid if BTC.D breakdown . if this can happen, good for ALTS coin
BTC.D Dominance of BTCBTC.D is on the daily resistant should be dump big and Altcoins pump big , will see

BTC.DOMINATION ANALYSIS BTC.D consolidation and make a bullish flag pattern . has breakout and also retest and now still consolidation in lower timeframe , we see have double doji pinbar candle on support and confirmation close with green candle , potential continue upward movement minimum 46.82%
so this is bad for ALTS if BTC.D up and BTC down ALTS will dump

Bitcoin To Continue Higher as Tether Dominance Goes LowerWe continue seeing bearish signals on the Tether Dominance Index (USDT.D) chart.
Yesterday we looked at the long-term chart and the RSI (weekly), the signals were clear there.
Looking at it closer today, our view remains the same.
- We can see prices moving below EMA10 on a full bearish candle.
- The RSI is trending down strong.
These signals are pointing lower.
The blue space on the chart is the main target/support.
Namaste.

BTC DOMINANCE | BITCOIN | ALTCOINS: THE RELATION.Hello guys, this is the BTC dominance update in 2 days timeframe.
Things are taking quite an interesting turn in the market. I am not completely sure yet but comparing the BTC dominance with Bitcoin and other altcoins, looks like some big move is about to come.
Let's compare the dominance and BTC chart side-by-side.
Bitcoin: In my recent BTC update, BTC is holding the $28k support level and it is trying to bounce back. The RSI is at the oversold area and most likely it's gonna rally higher.
BTC Dominance: We saw BTC.D making greens for the last couple of weeks breaking out of the upper trendline and also close to hitting the resistance level. The RSI on the other hand has crossed the 70 level which shows a clear sign of rejection.
What I am understanding from the current scenario is BTC is trying to make a bullish rally and the BTC dominance is possibly getting rejected. According to the experts, whenever the BTC.D gets down and BTC goes up, the altcoins go up quicker.
Is that possible in the current phase? Are we going to see a bullish rally or is it just a trap? Well, I am not sure enough to confirm it. Like I said many traders including me are assuming this to be a bear market but nobody knows exactly and no one can be deadly accurate at this. It is all a probability. As of now, for this chart, my invalidation point will be 47% resistance level. If the BTC.D breaks above this then all these assumptions will go to nothing.
What do you think about this? Do share your ideas and correct me if I am wrong.
I'll see you in my next update.
Thank you.

Bitcoin Dominance RENKO (Weekly)We have a strong buy signal on the RENKO BTC.D index chart.
We can the last green brick closed above EMA10.
Supporter by really high volume.
A higher compared to February...
There is room for Bitcoin Dominance to go up.
Namaste.

Bitcoin Dominance Move Above EMA50 Weekly (Strong Signal)The Bitcoin Dominance Index (BTC.D) has gone bullish on the weekly timeframe.
We can see it growing above EMA50, which is a very strong signal.
We can also appreciate an RSI above 60 which is also really strong as this is the weekly timeframe.
Looking at the big trading channel above, it looks like Bitcoin Dominance is preparing from a strong price JUMP!
Namaste.

#BTC.DOMINANCE 1DAY UPDATE !!Hello dear traders, we are new here so we ask you to support your ideas with your LIKE and COMMENT, feel free to ask any questions in the comments, and we will try to answer for all, thanks, Friends.
I have tried my best to get the best possible results in this chart.
Hello, dear traders welcome to this BTC.DOMINANCE 1DAY chart analysis.
Dominance is getting rejection by the resistance. The reason we see some green in many Alts across the market.
ALT/ BTC Pairs are likely to continue the rally unless broken upside.
The trend for alts looks strong for now but keep in mind this will only stay this way as long as BTC holds the $28k level. That is the key level we need to keep an eye on.
Thank you for your time, we hope that our work is good for you, and you are satisfied, we wish you a good day and big profits.
Sorry for my English it is not my native language.
Thanks.

#BTC.DOMINANCE UPDATE BY CRYPTOSANDERS !Hello dear traders, we here new so we ask you to support our ideas with your LIKE and COMMENT, also be free to ask any question in the comments, and we will try to answer for all, thank you, guys.
Hello, dear traders welcome you to this BTC.DOMINANCE 1hr chart analysis.
Dominance is getting rejection by the resistance. The reason we see some green in many Alts across the market.
ALT/ BTC Pairs are likely to continue the rally unless broken upside.
The trend for alts looks strong for now but keep in mind this will only stay this way as long as BTC holds the $28k level. That is the key level we need to keep an eye on.
THANK YOU.Thanks for your time, we hope our work is good for you, and you are satisfied, we wish you a good day and big profits.
THANK YOU.

#BTC Dominance Rejection in progress.. ALTSEASON??#BTC Dominance getting rejection from the resistance. Reason we are seeing some green in many Alts across the market.
ALT/BTC Pairs are likely to continue the rally unless broken upside.
The trend for alts look strong for now but keep in mind this will only stay this way as long as BTC holds the $28k level. That is the key level we need to keep an eye on.
Make sure you keep enough cash to buy the Dips and always DCA your entires and use SLs.
Cheers
Smash that like button if you like it and share your views in the comment section.
Thank you
#PEACE
