Bitcoin Dominance BTC.D - Head and Shoulders + Broken trend lineHead and Shoulders pattern is still valid. This is extremely bad for altcoins, this Head and Shoulders pattern is powerful. Also, the major trendline to the downside is broken. Big move is probably coming and it will be nasty. You can short altcoins on Binance Futures / Bitmex or move your Crypto to USDT temporarily - only for traders. Monthly chart is still bullish for altcoins.
Btcd

Bitcoin Dominance BTC.D - Bearish Head and Shoulders This is extremely bad for altcoins, this Head and Shoulders pattern is powerful. Also, the major trendline to the downside is broken. Big move is coming and it will be nasty. You can short altcoins on Binance Futures / Bitmex or move your Crypto to USDT temporarily - only for traders. The monthly chart is still bullish for altcoins.
Please, hit the like button and follow me for more of these ideas!
Also, check my signature down below ↓

Bitcoin Dominance (BTC.D) - October 5thBitcoin Dominance gapped down through a 3-year uptrend from 62% to just under 60%, sitting at 59.34% at the moment. This is a good indicator for altcoins going into this next week and even month, that it will be a good month for altcoins in the respect that select ones should out perform Bitcoin very well, such as a handful of the DeFi projects we've seen throughout the summer.
I expect the price of Bitcoin to continuously be rising, but altcoins that have an actual use case should do even better.

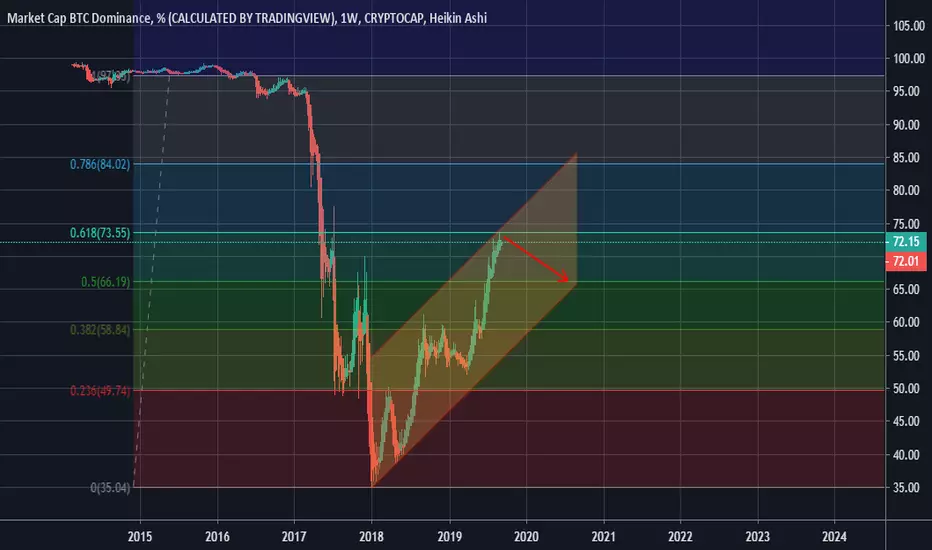
Bitcoin Dominance BTC.D - Rising wedge + Elliott waveAlt season is currently in progress. The rising wedge pattern is broken, which massively favor altcoins speculators. This rising wedge pattern lasted almost 2 years. Also my Elliott Wave count is completed.
If you like this technical analysis , please hit the like button and follow me for more of these ideas!
Also, check my signature down below ↓

What can we learn from bitcoin dominance and DXY1st Rule = 2MTHS down of BTC.D
2nd Rule = 1st Rule CL Green Candle
3rd Rule = Candle that follows 2nd Rule CL Green too
4th Rule = Belief DXY only a retrace
NOT ADVICE DYOR

Good Buy Alts, Bitcoin WELCOME 🤗Good Buy Alts, Bitcoin WELCOME 🤗
Are You agree with me? :)
I would like to discuss this situation with You )
WELCOME TO MY COMMENTS🧡
YOUR ROCKET BOMB 🚀💣

Election Day Top Out ? BTC.D #btcd #bitcoin #dominance #cryptoWill BTC.d rise by November 4th ?? Here we see the BTC.D chart which has been in this lower range for months now . I've been waiting for this chart to turnaround and head back up . For me when the rsi on the BTC.d chart hits 74 or higher on the 1 day chart then Btc is usually a sell ( to take profits ) and alts are usually going to be a buy at that time as well . Right now with rsi at 41 it's really a 'No Trade' zone for me . My favorite trades happen after we see this Dominance chart top out. When will that happen ? It's been months already . Well , there is Election Day in the US which is November 3rd this year . I expect Bitcoin will run back up by then - possibly to 14k - but really I expect our BTC.d chart will be bullish possibly going up to where that Blue Gift is on the chart - near 68 resistance . Will this be good news for us by early November ? I certainly hope so ! November 4th ?? Let's see !

Bitcoin Domiance | Elliot Wave | Fibonacci setupwe bounced from 0.618 fibs and also bouncing from the fib
let's take a look at the green elliot wave formation we are now at correcting waves and going for C waves around 70
at C wave completing we are also hitting B wave of red EW .. and from their we can touch around 50


TOTAL Market CapGreetings friends,
I just wanted to point out today that we must not get blindsided by BTC moves.
We must look everywhere, and today I would like to point out to you that we have experienced the BIGGEST increase in the TOTAL market cap volume and that we might be very close to a very big move to the upside in the WHOLE crypto market.
Please manage your risk safely, and embrace what's to come!
Trade thirsty, my friends.

Traditional markets, crypto, correlations and tips!This ‘Market Snapshot’ is going to be an interesting one, as it is sharing some of my thoughts inspired by the markets and my trading rather than market action.
The first thing I’d like to talk about is the correlation between Bitcoin, Altcoins, Gold, Stocks and the USD, as it is definitely a topic many people are discussing and it’s a heated one.
Since the March crash we have seen most assets get much more correlated than they were before, and the main reason is that the USD has become more volatile and its importance to markets has become very clear. Due to the fact that the biggest markets in the world are the US ones, most debt is in USD and most assets are traded vs the USD, it is normal for assets to be correlated to an extent just because of that. At the same time, many retail traders are looking at the same things, along with institutions which aren’t focused on crypto only. Many of them actually bought the dip this time, and now have a bigger influence in the crypto markets than ever before.
Another thing is that the US stocks are going parabolic, especially the big tech names, while the VIX is near 30. There is a lot of uncertainty in the world right now and one market has gained most of the attention. At the same time, crypto is still flying under the radar and the crypto total marketcap is 50% below its ATHs nearly 3 years later. Eventually things are going to change as this market is maturing and the technology is progressing.
Bitcoin usually starts moving very quickly when something changes in the global picture. We saw that in Dec 2017, Nov 2018 and March 2020, as well as during this most recent correction where Crypto started dropping before stocks and even bottomed before them. Don’t forget that crypto is still the wild west and a 24/7 market, so it is normal for moves to start and end faster than huge, more stable and 24/5 markets.
In my first ‘Market Snapshot’ I got many of the targets for closing shorts and going long correct (SPX 3300, NDX 10900-11100 & Bitcoin 9500-9800), but then I became overly bearish. On my ‘Weekly Open’ analysis although, Bitcoin and altcoins had dropped substantially, I felt they had more to drop as traditional markets fell further. So why did I get it wrong, what were the signals that I was wrong and what to do next time?
A. Always focus on the chart you are analysing for entries and exits. If an entry is really good, don’t leave it on the table because you think the xyz asset could do something different. Crypto is a different beast and respects TA incredibly well, but also has its own intricacies. For example the diagonal support held nicely for BTC and the price never even closed below 10k or the 128 DMA. On top of that, the BTCUSD & ALTBTC correlation had started breaking since Sunday. Alts where also not dropping much despite BTC trying to go lower.
B. Always look at both BTC and USD charts for alts. Nowadays USD charts are more important as most trading is going on in USD/USDT pairs, so even though alts didn’t seem ‘oversold’ enough in BTC terms, they certainly were in USD terms.
C. When markets get volatile stick to your initial plan, because during crazy corrections like this one – fastest 10% drop in 3 days in Nasdaq’s history – you could be your own worst enemy by overthinking or, even worse, overtrading.
D. To me it was and still is very clear that we are in a bull market both in Crypto and stocks. NDX could drop to 10200-10600 which I think is possible, yet when such strong correction occur it is definitely worth betting with the trend if something is sitting at strong support. Even if ii will be just a dead cat bounce. What got to me was the fear of a March-like crash, which imho is simply not likely to happen anytime soon, although not impossible. For now I am focusing on playing the bounce of the log channel on NDX if the price gets there.
When things get volatile, try to play level by level and go small until you get a clearer picture of the market. Let the dust settle.
So this was from my article on Cryptocube.io, where you should all come and check it out. If you have good content and you would like to write for Cryptocube, don't hesistate to message the team (I am just a content creator). Otherwise you can read good stuff and find crypto coaches for most subjects related to crypto!
What I would like to add is how strong BTC is right now despite the volatility in traditional markets. Not only the volatility, but the strength of the USD along with markets going down. In my previous analysis I've said that I believe 7-8k is possible and it would be a gift. I still believe the DXY could get up to 96-97 which would give a strong correction to all markets, but after that as long as it doesn't close above... I expect a continuation of the bull market.
The momentum in crypto is really strong right now. Too many stablecoins, many new interesting coins, attention to the space is slowly growing as are the inflows of capital... all that while BTC's inflation was cut in half. The market is still down 50% from its Jan 2018 top, which I think is really cheap. Most of the alts I am looking at right now are extremely hot and if BTC/Traditional markets don't shit the bed, they could explode.
Look, based on most models I am looking at the fair price of BTC is at 8k and overall it is the best place to start buying based on my TA. 10k is a normal price and there are many reasons to be bullish here (I do think we will hit 20k by the end of the year), but first I'd expect a strong shake out. By the end of September crypto should start trending up again, if it isn't already ready to do so. I mean there are tons of good alts right now and many look incredible. Seriously confused as to what to do, as I should had played this a lot better than I did. I got out of ETH, TRX, BNB, FOR, MKR and some gems a several days ago... but many are now higher than I sold them (some at profit, others at a loss). I am also still long term bullish on stocks, but they look like they have more downside before they start going up again. (maybe another 5-10% from here)


BTC.D GO BIG OR GO HOME!Theres no better news for the alt coins!
They trade really well when this is trending lower so make it count!
At some point this will do a bearish retest and alt coins will suffer.
Trade thirsty, my friends!


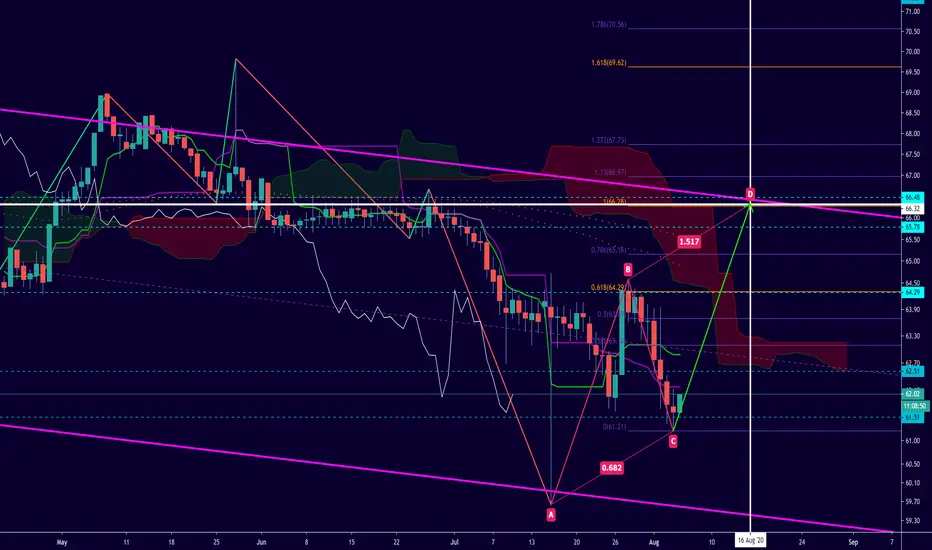
BTC.D bearish trend looks set to continue (morealtparty?)Rising wedge into a supplyzone/ trendline.
Bitcoin dominance looks set to fall again (20 aug) which times up well with alts relief pump after the dip today
Alts bearish case is a potential hidden complex inverse head and shoulders but its abit messy and against trend so im doubtful on that.
Altpartycontinues?


Marketcap BTC Dominance 1W;POSSIBLE RETRACMENTThe bitcoin ownership percentage chart has reached the specified resistance range according to the analysis, and is likely to have a few weeks of correction in the current range.
A POSSIBLE CHANCE FOR RISE ALTCOINS :As long as the chart is uptrend, bitcoin ownership will be higher than the market, and as a result the volume and trading of penalties will decrease, and if the chart is down, there may be a reason for penalties to rise.
BTC.d dropping furtherShould form a bullish div on the 4H at 63% and bounce. This is a further breather for alts.


Weekly Bitcoin dominance analysis Btc.DBitcoin domination has not increased. But before domination rose, prices increased. The money is still floating in altcoins.
Need to trade carefully. Buying bitcoins from this point can be dangerous. I think it is necessary to wait for domination to rise.
This is an amateur work. It is not investment advice. Good luck to everyone.

BTC.D P-Modeling Pt 3. The Black Swans of Cajun Welcome Hyperspace Travelers..
Hope everyone is doing well.
Technical Stuffs from the last idea.. Please see the first Model failure on BTC.D.
Double Nestled Cup and Handle Formation with Orthogonal Phase States.
Timeframe 2015-2021
Linear Root w/ Wave Satisfies 0-A-B-C -IN-
Linear Root w/ Wave Satisfies C-B-A-0 -OUT-
w/Junction at Dominance Low.
Nestled Cups has Cypher Validation X-A-B-C-D
D- of Cypher Ends Nestled Cup.
End of Nestled Cup results in upward movement as expected with a cup/handle formation.
Root Vector Defined by Yellow Focal
Cup Handle Baseline is 94% Dominance by BTC . Equalization is achieved by Dominance Reset.
Multi-Harmonic Validated Handle
Root Potential Absorption: 87% towards root MAX. Scam wick central. validated by focal point, (Angular Window)
I am most probably wrong though.. But .. What if..
Focal mirror of Complex #1.
________________________________________________
Trial #3
Fail or Success?
Failure is a necessary component of success.
Come for the laughs, stay for the Art.
___________________
Think in Loops.
Think in Strings.
Begin to connect them.
You see weird things...
Oof. Tis so Pretty.. But is it functional?... That is the question of the day.
Bet your ass, I am shorting this again into the ground. Despite my previous failure.
This is a Time-Series Analysis.
Now for some deep thinking. Cheers.
Thanks for Pondering the Unknown with Me,
Glitch420
*Disclaimer: If you seizure prone, turn the brightness all the way up for extra eye bleed. This is financial advice.
