BTC.D - alts going to recovermany of altcoins found their bottoms. but always have stoploss in case things go against your will.
Btcd


Bitcoin Dominance SUPPORT LEVELS to watchBTC.D is likely to return to the mean after testing the upper trendline of the ascending channel. it could take time, but I'd expect the main downside corrective wave to start in November. It could last approximately 2 months after which the btc dominance would continue to rise.


BTC dominance % Mar 2014 - 99.38%
Nov 2015 - 98.84%
Jan 2018 - 37.26%
Jul 2018 - 50.25%
Aug 2019 - 70.20%
Oct 2021 - ?

BTC.D: potential BTC dominance declineNov 2015 - last peak of BTC dominance
Aug 2016 - halving 2016
Jan 2018 - last dip of BTC dominance
Aug 2019 - 4 years minus 3 months(halving offset) from the last peak of BTC dominance(which is potentially the current peak of 70% BTC dominance)
Nov 2019 - 4 years percisely from the last peak of BTC dominance
May 2020 - halving 2020
2nd leg of decline could be just across the corner

Bullish Shark for BTC.DReaching our C target of 70.76
BTC.D is looking overextended and broke downwards out of the rising wedge and 70.76 can be treated as a retest.
There looks like a bull flag was formed from legs XAB, but I am not confident in it because of the rising wedge.


When BTC Dominance DownHere is a patter that should confirm the correction. Prior to that the uptrend trendline (the mean) has to be broken, which could be the very start of correction.

Long Term View on Bitcoin DominanceYet its unclear whether BTC will take over most coins and go back to 80% or higher dominance. But fundamentally it just seems pretty unlikely. This week/month closing price should play very important role in further price development. And I'd expect some nice spice to be produced, before/if reversing to the downside.

Bitcoin Dominance Back to 50% is ImminentMost are now are all in Bitcoin, especially considering BTC.D growth. This is market panic, which does result in a lot of money being moved from alts to Bitcoin.
But this is exactly when smart money goes in. The market pshycology tells me, that this is perfect time for BTC.D to start reversing. Nevertheless, the it could be too early for the Alt Season to start.
I'd expect it to BEGIN at the end of this year.... or, to END by the end of this year. Soon we'll find out, but I am holding my alts long term.
Now you might ask why BTC will lose so much dominance. Well, BTC is a store of value, a long term "GOLD" investment. But, blockchain continues to develop with mass adoption on its' way. This will stimulate the growth of other chains and capital will be slowly distributed. People don't like to keep all eggs in one basket, even if this is a basket of Gold. They will buy Silver, Diamonds, Property etc simply to diversify.

BTC.D SHORT Bitcoin Domi has officially encountered a problem here and in my opinion it will reduce the BTC price will go down slightly.

BTC.D showing control until August 8thSlight retrace coming in before rocketing up to complete D of our BAT

Time for ALT DominationMedium term, Bitcoin could start losing dominance, giving some room for growth to alts
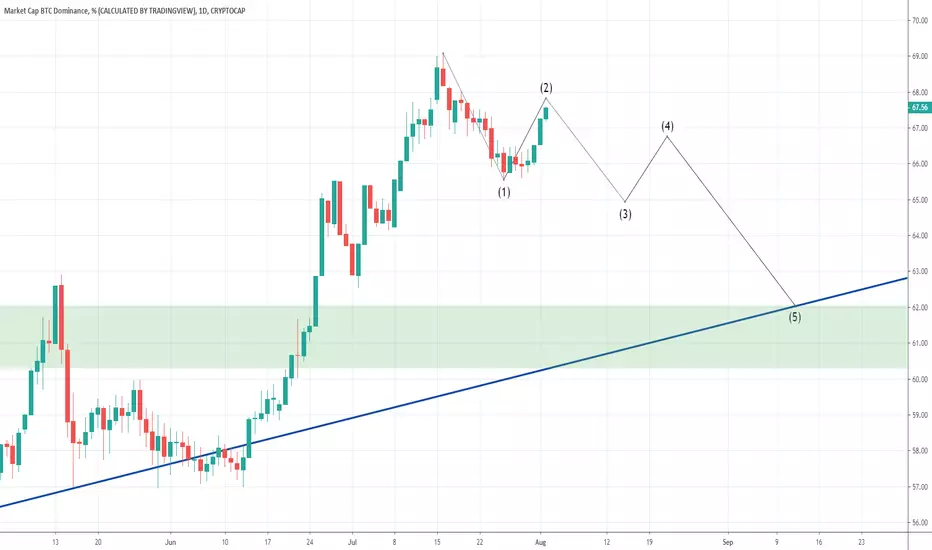

BTC Dominance to 66% (short term)BTC Dominance is in a very slow decline. I expect the level to drop to 66 and from there it could drop further to 63 or make a run back to 70 or even 80.
Decision point expected around August 10th - say +/- a week
If you find this idea helpful, please leave a like!

BTC.Dominance Short - ALTS LONG
BTC.Dominance now printed a nice head and shoulders bearish pattern. At MACD we have bearish cross which means the bearish movement in 12hour timeframe is confirmed. A breakdown from here BTC.Dominance will go to 65.88% for Head and shoulders target.
Tonight the weekly candle will close,there is a nice rejection. Altcoins will going up in sats value.Good luck

Update - BTC still going to 7200 (or lower)If you've found this helpful, please leave a like and subscribe.
Do you agree or disagree? I would love to hear your thoughts in the comments!
We've broken two trend lines and the price currently finds support at .382
7200 represents the .618 retrace line and hence, the basis for my target.
BTC.D (Bitcoin Dominance) is waning and alt coins are seeing those 20-40% daily gains.
This seems likely to continue to (or around) August 6th, where BTC could bounce or see selling accelerated.

Bitcoin dominance (Bitcoin) Altcoin season is come?Bitcoin dominance (Bitcoin) Altcoin season is come?
1) We are under 200 - MA
2) We are testing 1.618 Fibo
3) On RSI:
Overbought on RSI
And Rising wedge (Bear pattern)
A good question will be whether altcoin season. I am an optimist in this matter.

LTCBTC Update on the massive H&SAn update on the LTCBTC massive H&S chart
Price now: 0.01000 BTC
Target: 0.001900 BTC
Minus 80% from now.
Correlates with the massive BTC Dominance Chart. Not smart to keep ALTS if you want to have more BTC.
RSI in the weekly also had a huge divergence.

Will ALTCOINS Die Now? The MOST Interesting Chart - Must SeeI want to share this chart with you. Nobody is really paying attention to this, but I will! This chart is revealing a truth nobody is talking about.
This is the Bitcoin Dominance Chart. BTC Dominance is telling us, how big a share Bitcoin represents of the Total Global Market Cap. I follow this every day, and update My Family about this, to spot any changes in these Macro Trends, so we know where our focus should be at.
In the beginning of this year our Family focus was on Altcoins, because I saw that altcoins were doing better than Bitcoin. So we made a lot of money on that in January and February.
But since April Bitcoin has just fared better. And right now it seems like it will not stop. We are in ascending triangle, that most likely will take us to almost 90%(!!). Yes, 87.27% on this chart to be precise!
Consequences
This will mean, that Ethereum, which is 2nd largest coin, measurred on Marketcap, will take a massive hit. ETH right now represents around 10% and will drop hard. Ripple with 5% right now, will feel it, and the same with Bitcoin Cash, Litecoin, EOS, Bincance Coin, Tron, BSV etc.
What I have shown you here is just pure facts based on data. That is what this chart is telling us. This chart is also asking a lot of questions, like: Will there be no Altcoin season anymore, and will we only see a few altcoins survive this massacre?!
Please remember to give a LIKE, and I also want to hear you guys, what you think will happen in the future with Altcoins. Lets get a healthy debate going.
D4 Loves You <3
