Bitcoin Dominance Is About Give a New Life To Altcoins!Hello, Skyrexians!
We have already mentioned the importance of different crypto assets dominance analysis. Today we are goin to update the main one CRYPTOCAP:BTC.D . Last month it makes us nervous with the potential intention to set the new high. Current formation looks like a triangle - trend continuation pattern and it scares many traders. Is this nightmare is going to be true, or altseason is coming?
Let's take a look at weekly time frame. Now we use the combination of our hand made indicators: Bullish/Bearish Reversal Bar Indicator and Fractal Trend Detector . Trend detector started printing the red candles, the bearish trend late in 2023, but those time this tendency shift failed. This time we have seen two red dot on other indicator and after that trend change. In our opinion this is much stronger confirmation that altseason is really coming.
You probably already know that predicted earlier the dominance drop to 27%, but today we are talking about short term forecast, 0.61 Fibonacci level below 50% is the target for February.
Best regards,
Skyrexio Team
___________________________________________________________
Please, boost this article and subscribe our page if you like analysis!
Btcd

another IHS on BTC.D? Chop chop more?We have successfully completed an IHS on a lower time frame (see my other chart)
Now we seem to have the beginnings of what could be another IHS on a higher time-frame?
Another scary pump of Bitcoin dominance incoming?
Interesting, let's see
(the chart is inverted)

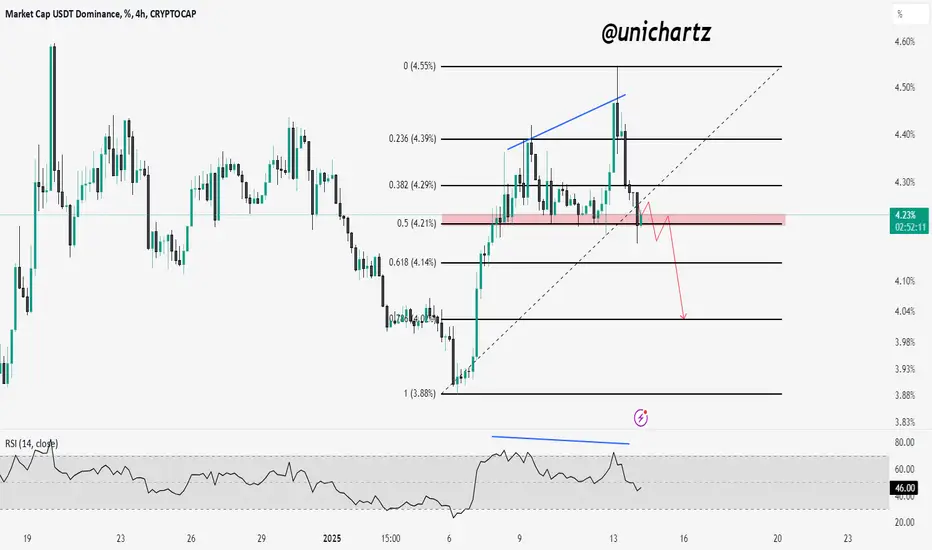
USDT.D at Key Support: Altcoin Bull Rally Ahead?USDT.D has repeatedly bounced off the marked red support zone, a strong Fibonacci level at 0.5. This support has been tested multiple times, and based on my experience, I anticipate USDT.D may break below this zone. If it does, it could trigger a bullish rally in altcoins.
I believe this is the final shakeout phase, so stay strong and focus on accumulating fundamentally solid coins. Remember to maintain discipline and practice strong money management.
USDT Dominance Falls, BTC Rises: What It Means for TradersThe chart highlights the inverse relationship between BTC/USDT and USDT.D (Tether Dominance). When USDT.D drops, capital flows out of stablecoins into Bitcoin, driving BTC’s price higher.
Conversely, a rise in USDT.D signals increased caution, often leading to BTC price declines. This correlation helps traders gauge market sentiment and identify potential trend shifts.

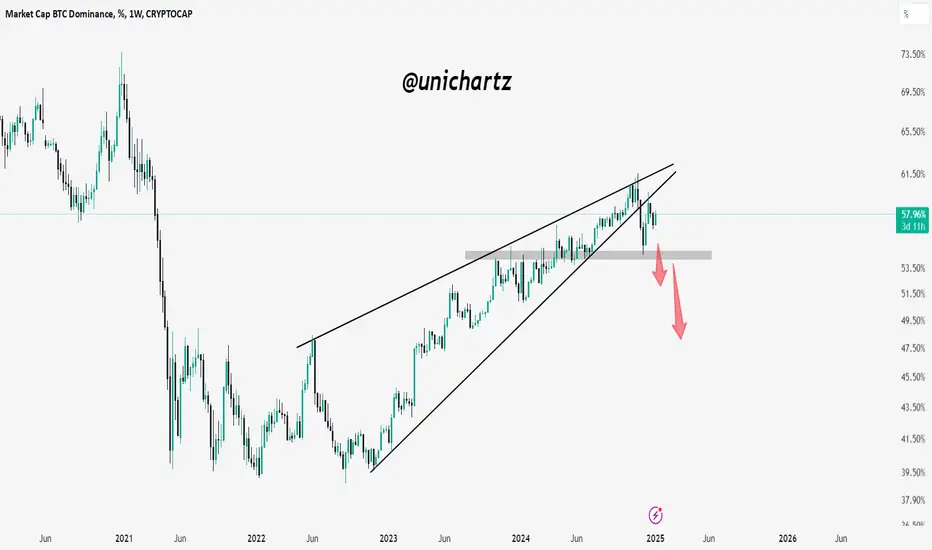
BTC Dominance Breakdown: Altcoins Poised for a Rally?BTC dominance has broken below a rising wedge and is retesting the 57.80% resistance.
If rejected, dominance could drop to 53.50% or 50.00%, signaling potential capital flow into altcoins.
Capital Shifts in Crypto: Liquidity, Corrections, and the FutureOn a growing market, each correction serves as a mechanism for capital redistribution. In the cryptocurrency sector, where the market is relatively small, profit-taking on major assets like Bitcoin (BTC) and Ethereum (ETH) has a significantly negative impact on less capitalized altcoins.
Analogy with traditional markets
Traditional financial markets follow similar principles. Here, Bitcoin can be compared to gold, while altcoins are akin to stocks or bonds. When positions in gold are closed, the fluctuations are less noticeable due to the market's greater liquidity and volume. However, stocks, with their lower capitalization, show significant volatility, leading to an equivalent increase in potential dollar gains.
Depth and structure of the crypto market
The crypto market still lacks depth, predominantly involving small-scale investment funds by global standards. Competition among expert traders and investors is limited, leading to low profitability or zero gain on bear markets, where professionals trade against each other, for instance, Wintermute traders against GSR traders. In traditional markets, where both professionals and retail investors participate, professionals have an advantage due to more variables.
Liquidity and spread
Both markets allow for earning on the spread, although currently, spreads are relatively small. The redistribution of liquidity, especially during market downturns, is driven by both psychological factors and the technical aspects of position closing, particularly when comparing futures trading with combined spot and futures trading.
Indexation and synthetic assets
The creation of indexes in the crypto sphere could be the next step. There are already examples like Reserve Rights (RSR), where real-world assets are tokenized to create stablecoins. Forming indexes similar to the S&P500 or US100 could combine crypto assets by similar characteristics, increasing liquidity and opening new investment avenues. However, this could lead to issues similar to those in 2007 in traditional markets, where "packages" included high-risk assets.
Conclusion
Implementing such tools might soften the liquidity redistribution effect for retail investors but could complicate things for funds and market makers, reducing their ability to buy assets at reduced prices. The cryptocurrency market is at the stage of mass adoption, and upon completion of this process, new forms of digital money may emerge.
Written by Alexander Kostenich (WIDECHAR),
Horban Brothers.

IHS on LTF for BTC.Das per title, on the short term timeframe BTC.D should go higher
where next we reassess when reach it

Next Alt sessionBTC.D tends to drop right after its halving cycle; this may be the last altcoin season.
BITCOIN UPDATE 2025 | ALTSEASON | BTC.DWe'll kick of the first analysis of the new year by taking a look at BTC, and whether or not the conditions are met to say the ATH is in.
Furthermore, let's loo at altseason by comparing the TOTAL3 chart and the Bitcoin Dominance chart. Many secrets lie in these charts if you overlap them, and look for patterns.
Soon, I will be making an update on the top Altcoins to watch in 2025 so be sure to follow so you don't miss it!
__________________

They wanna Cill us, But we will rise again soon!Bitcoin is oscillating in a rather boring price range, while altcoins have experienced a significant price drop. However, we shouldn't lose hope. A historical comparison suggests that we can expect growth in altcoins. This is not an investment advice, and I do not consider myself an expert analyst. Please invest in the crypto market with risk management in mind. Wishing you all the best!

Alt season is just around the corner#BTC.D #Analysis
Description
---------------------------------------------------------------
+ Bitcoin dominance had an unsuccessfull breakout from the resistance line.
+ dominance is around the resistance zone and now it is headed in the right direction
+ a drop in the bitcoin dominance will push the altcoin prices higher
+ if the dominance is headed in the right direction we can expect a altseason soon.
---------------------------------------------------------------
Enhance, Trade, Grow
---------------------------------------------------------------
Feel free to share your thoughts and insights.
Don't forget to like and follow us for more trading ideas and discussions.
Best Regards,
VectorAlgo

BTC.D Analysis: Retest of Key Area Highly LikelyBitcoin Dominance Looking
Bitcoin dominance looks very strong but BTC has entered the range. So I think dominance may follow a calmer course for a while, a few coins that have separated from the herd may make good moves in these few days, but it is too early to claim that the general atmosphere is completely bullish, because SP500 seems to be making a deep correction and is giving signals of this. I do not buy anything during the New Year, and I will not buy, but then I will spend all of these corrections with buying because I believe that 2025 will be good.
A retest of this area in BTC.D (Bitcoin Dominance) seems very possible based on current market behavior. This level holds significance as a potential reaction zone for further movements.
Also, I see no point in saying that this view of dominance supports the blue box analysis I shared here:
Because when BTC goes down to blue box we will see an upside move on dominance then we blue box of dominance chart will support the price, we will see an upmove on both.
Key Points:
Current Setup: BTC.D is approaching a critical area of interest.
Retest Likelihood: Market dynamics suggest a probable revisit to this zone.
Focus: Monitoring the reaction at this level for future directional clarity.
If you think this analysis helps you, please don't forget to boost and comment on this. These motivate me to share more insights with you!
I keep my charts clean and simple because I believe clarity leads to better decisions.
My approach is built on years of experience and a solid track record. I don’t claim to know it all, but I’m confident in my ability to spot high-probability setups.
If you would like to learn how to use the heatmap, cumulative volume delta and volume footprint techniques that I use below to determine very accurate demand regions, you can send me a private message.
My Previous Analysis
🐶 DOGEUSDT.P: Next Move
🎨 RENDERUSDT.P: Opportunity of the Month
💎 ETHUSDT.P: Where to Retrace
🟢 BNBUSDT.P: Potential Surge
📊 BTC Dominance: Reaction Zone
🌊 WAVESUSDT.P: Demand Zone Potential
🟣 UNIUSDT.P: Long-Term Trade
🔵 XRPUSDT.P: Entry Zones
🔗 LINKUSDT.P: Follow The River
📈 BTCUSDT.P: Two Key Demand Zones
🟩 POLUSDT: Bullish Momentum
🌟 PENDLEUSDT.P: Where Opportunity Meets Precision
🔥 BTCUSDT.P: Liquidation of Highly Leveraged Longs
🌊 SOLUSDT.P: SOL's Dip - Your Opportunity
🐸 1000PEPEUSDT.P: Prime Bounce Zone Unlocked
🚀 ETHUSDT.P: Set to Explode - Don't Miss This Game Changer
🤖 IQUSDT: Smart Plan
⚡️ PONDUSDT: A Trade Not Taken Is Better Than a Losing One
💼 STMXUSDT: 2 Buying Areas
🐢 TURBOUSDT: Buy Zones and Buyer Presence
🌍 ICPUSDT.P: Massive Upside Potential | Check the Trade Update For Seeing Results
🟠 IDEXUSDT: Spot Buy Area | %26 Profit if You Trade with MSB
📌 USUALUSDT: Buyers Are Active + %70 Profit in Total

Return Of The Alts Season. Wait For It!Macro scenario shows falling RSI for Bitcoin Dominance , BTC.D . We may be welcoming a return of the Alts Season that seemed to go on a pause when CRYPTOCAP:BTC went to 92k.
I foresee a near support level where it will bounce a bit, hit a near-resistance and continue downward. The overall daily trend is already bearish.
Some major alt coins have completed their correction and can't wait to go parabolic. Coins like CRYPTOCAP:DOGE , CRYPTOCAP:LTC , CRYPTOCAP:SOL and others.
See d rawings on the chart it's as clear as day!
Comment and like if you disagree. Merry Christmas 🎄

BTC.D Chart: A Bullish Signal for Altcoin HoldersRight now, I can't find a better example of a rising wedge breakdown and retest on the weekly timeframe than on the BTC dominance chart. This is incredibly promising for anyone holding altcoins
Six months to glory for our alts !!
ETHBTC to the moon in Q1

Confluence of supports to warrant drop in BTC.DBTC.D chart is very complex, but overall, poised for dropping (it's an inverted chart; hence drop looks like pump)

Altseason coming.Btc.d is currently forming a ascending wedge after a huge drop. This is a bearish trading pattern. If btc.d will drop there will be an altseason. I think the lowest btc.d will go is ~47%.
Time will tell.

BTC DECEMBER FOMC Going into FOMC the consensus is we'll see a 25bps cut from the FED (95% chance), this would take interest rates from 4.75% to 4.5%. Because the expectation of a cut is so certain, we can assume that the markets have priced this in so baring any craziness in the form of a different result we should see market sentiment remain the same, bullish.
A FED pause,(although unlikely according to data) would be very bearish in the the short term in terms of volatility. I would expect to see price revisit the $98-99K mark where the 4H 200EMA would roughly be. In a bullmarket the 4H 200EMA can be used as a great support level often bouncing off of it.
For a 25bps cut which is the expected outcome, we have two paths IMO. The bullish path is consolidation under the ATH then a break above, retest and off we go towards $110,000. The bearish path is a loss of this key S/R level after a consolidation above support and break under with a confirmed retest of new resistance. I know it's typical "could go up, could go down", however it's the context that matters here.
Alts have taken a back seat for the last week or so, BTC.D at a key level and a rejection off this level would mean alts can play catch-up while as BTC consolidates. We very rarely see BTC drop and altcoins pump so this is the most likely outcome to me baring no upsets in FOMC.

Bitcoin DominanceCRYPTOCAP:BTC.D has lost the supply zone after a long time and the weekly bearish breakout and retest is completed, as well as the two-year uptrend downtrend breakout and retest is completed.
We're moving towards a long-term recovery for #Alts

Btc Dominance appears to be getting rejected from channel retestBitcoin dominance chart just recently bounced back up in an attempt to climb back inside the ascending channel it recently broke under and as of now both candles that sent a wick back inside the channel upon the current retest both closed their candle bodies with the channel still as resistance. Since then we are now seeing the current candle appear to head lower again suggesting the bottom trendline of the channel will be confirmed as solidified resistance, in which case price action has a much higher probability at this point of validating the breakdown and dumping to the 53% target. If this occurs we are very likely to see alt season really tart too kick in here soon. *not financial advice*

Can we consider this a retest?In my last post on bitcoin dominance I noted that for the first time in a year and a half we had broken our wedge to the downside. This was hugely bullish for altcoins and indeed, we saw some massive pumps occurring in the space. But I also cautioned that we could reverse and head back up to retest the underside of our wedge. This is a classic technical move. I call it "Kiss Mamma Good-bye" as price always seems to like to come back one more sentimental time to an area of supreme significance before moving on. This retest would then cause alts to drop significantly, liquidating many. And we saw this occur this past week. So, can we consider this our retest? I know we didn't touch the underside of our wedge completely but bulls are in a hurry here. They want one last good pump before Christmas. And if my chart is correct, I think we'll get that.
✌️ Stew

The fall of Bitcoin dominance and the dawn of AltcoinsAltseason is about to begin! Hope you're on the last type finished accumulating your altcoins. According to blockchain data, the market maker has distributed its Bitcoin and finished accumulating altcoins. The chart shows an Adam and Eve top and a double bottom at the bottom. In my last forecast I was a bit wrong with the scale, but the point was correct and the target was reached! Dominance <53% is on the way!


USDT.D retest 5.5%?USDT.D been falling for 90days with no real retests, this might be it.
Also fully completed previous projection of a Dump.
Fibb Golden zone around 5.5%
Also BTC looks like it's in Diamond Top pattern. If that plays out we might see CRYPTOCAP:BTC at $85k.
But this is Bullrun so probably some Elon musk post will randomly revive market out of nowhere and the dump will stop mid way.
Keep eyes on twitter.
