BTC DOM is about to fall. Alt season is near"Alt season is about to begin. If you bought any coin at the bottom, hold your bag tightly. BTC dominance is about to fall." Be carefaul on your trade.
Btcdominance

ALT SEASON Nearly in SessionThe bitcoin dominance chart shows a strong resistance line being hit in which a rejection will likely occur, leaving alts to go bezerk
I think Ethereum will lead the alt mania but alts around the board will pop off
Lets go

The Line That Define Your Upcoming Generational Wealth [BTC.D]Since Q3 this year, the VWAP line has been acting as a fairly strong support level. This maybe indicates that crypto market participants are closely watching this indicator as an important reference point for Bitcoin's positioning relative to other cryptos.
If this line gets breached, it could signal a broader shift in market sentiment. A breakdown of this support could open the door for a more dominant altcoin movement, with capital flowing from Bitcoin to the wider crypto ecosystem.
This could provide a valuable technical clue to help answer the $420trillion question : 'wen altszn?' .
Thanks for reading 😊
🚀🚀🚀

Last words BTC.D as you can see I think we are in last moves and soon we will see bull run? maybe
just don't lose you entry and keep holding your invest

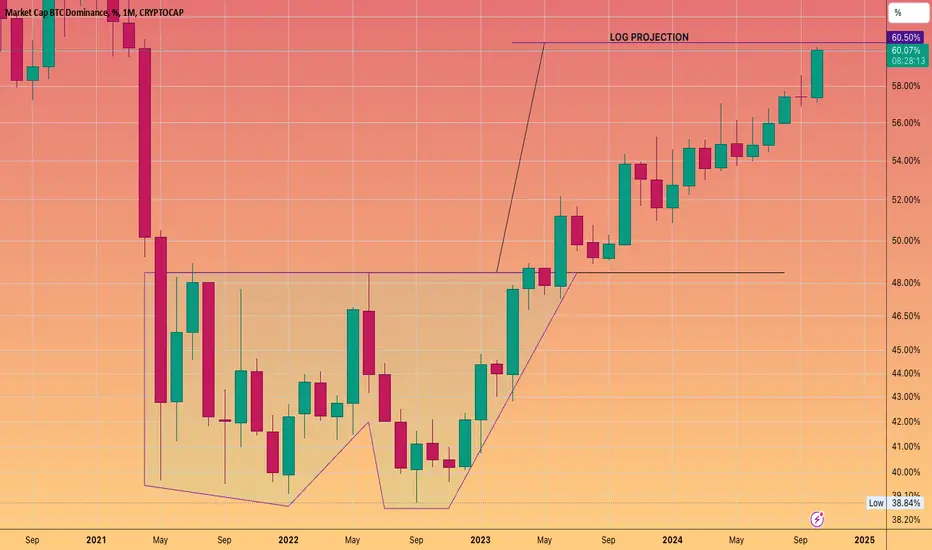
Bitcoin Dominance: Elliott Wave and Harmonics ComboBitcoin Dominance ( BTC.D) is giving a fantastic trading setup.
It's preparing a BIG Bullish Swing.
From an Elliott Wave point of view, a bullish Impulse Wave is about to start.
In this case I'm talking about Super-Cycle (C) (turquoise).
Moving on to Harmonic Patterns, there are two:
The smaller one is the Bullish Shark, which is preparing its completion.
The second one, and the bigger view, is the Cypher Pattern, which will commence one the Shark is done.
So, bottom line: BTC.D is gonna start flying, and will push the Crypto market into a fantastic Bull Cycle.
Bitcoin Dominance ( BTC.D ) Technical Analysis:
* Elliott Wave Impulse: Super-Cycle (C) (turquoise)
* Harmonic Pattern: Bullish Shark
* Harmonic Pattern: Bullish Cypher
* Double Bottom
* Bullish Divergence
* 88.6% Fibonacci Retracement
* 61.8% Fibonacci Extension
* Demand Zone
Conclusion: Bitcoin (BTCUSD) is and always will be the one and only driver of the Crypto Markets.

Altseason Starts SoonThe Chart above show Bitcoin Dominance (BTC.D) over time, with highlighted patterns and cycles that may be tied to Bitcoin halvings and market trends. Here’s my analysis based on the chart's structure:
Key Observations:
Repeated Patterns:
The chart highlights similar phases of Bitcoin dominance decline across three separate cycles, lasting roughly 231 days.
Each phase seems to correspond to a bearish period for Bitcoin dominance, where altcoins gain relative strength.
Halving Impact:
Vertical lines mark Bitcoin halving dates (green lines), which historically have a significant impact on the crypto market.
Following halvings, BTC dominance often rises as Bitcoin leads the market in initial rallies.
Projection:
The chart projects a decline in dominance after the current rally, extending into mid-to-late 2024.
A potential drop to ~44%-46% dominance is outlined, indicating a possible altcoin season or broader market rotation.
Support and Resistance:
The chart highlights a resistance zone around 62% dominance, which Bitcoin dominance seems to have tested recently.
A bearish breakout is suggested, aligning with a downward trend in the future.
Possible Interpretation:
Short-Term View: Bitcoin dominance might continue upward for a while but could face resistance near 60%-62%. If this area holds, a reversal could lead to dominance declining, benefiting altcoins.
Medium-Term View: If the projection holds, BTC dominance could see a prolonged decline lasting nearly a year, dropping below 50%. This scenario typically coincides with altcoin seasons where altcoins outperform Bitcoin in relative gains.
Risk Factors:Bitcoin dominance does not always drop due to bullish altcoins; it can also decline during a market-wide sell-off where Bitcoin loses less than altcoins. Macroeconomic factors, regulatory changes, and adoption rates could alter the outcome.

Possible Top for BTC/ETHI can see a possible top on the BTC vs ETH chart. It has clearly gone up alot and if you combine that with the divergence on the RSI + BTC Dominance about to fall the possibility for this to happen gets stronger!
This means that Ethereum is about to go for a run and if that happens alot of projects based on ETH will have a big rally.

BTC Dominance Do you know what it means? The lower the BTC Dominance gets, the more trader's eyes will be on alttcoins! Good for us 😄

BTC dominance and AltsznLet me preface everything with "NOT FINANCIAL ADVICE."
Right.
So, it’s been a crazy Uptober, hasn’t it?
When we thought CRYPTOCAP:BTC was going to continue its bear market trend from February 2024, the Trump trade happened.
Everyone was caught off guard—or maybe, like me, you were too.
So, I set out to find the next alphas. Presenting...
The Three Amigos: VeChain ( NYSE:VET ), Zilliqa ( GETTEX:ZIL ), and Helium ( FWB:HNT ).
Why these three? And why the 1986 comedy title?
Well, first...
VeChain ( NYSE:VET )
Targets and ROI if you bag them today..
Zilliqa ( GETTEX:ZIL )
Targets and ROI if you bag them today..
Helium ( FWB:HNT )
Targets and ROI if you bag them today..
(Side note: I love how TradingView has incorporated these subcharts into posts lately!)
In the 1986 comedy, a small Mexican village hired three out-of-work silent film actors to defend their community.
Initially, the trio thought they were performing a paid acting gig but soon realized the danger was real. Using humor, limited skills, and newfound courage, they rose to the occasion.
Similarly, today’s crypto markets have plenty of altcoins that have been underwater for ages—out of hype, out of demand, and far from a bull run.
It seemed Bitcoin’s dominance was going to climb even further, but then I spotted this resistance level. Digging through my list of coins from 2020, I found crypto’s Three Amigos.
Fundamentally, this trio has endured upheavals and enjoyed comebacks.
Technically, they’re either approaching or breaking their long-term down-sloping trendlines.
If I had to pick my top three to defend my portfolio against Bitcoin dominance, these would be my choices.
These are my Three Amigos. Perhaps you can share yours!

Bitcoin dominance is on a razor's edgeKeep an eye on the 62-63 Bitcoin dominance level; we will see a strong rejection from this range, which will lead to an altcoin pump. The duration of this drop is expected to be 60-90 days.
For risk management, please don't forget stop loss and capital management
Comment if you have any questions
Thank You

BTC Dominance May Take Reaction From HereDOM can get reactions from here. It makes this pattern frequently after sharp rises. Be careful on alts.

Alt-season? Bitcoin BTC Dominance past cycles behavior analysis The best way to spot an altseason is looking at the Bitcoin BTC Dominance graph.
On this analysis, of the behavior of the Bitcoin BTC Dominance, I spotted in the graph , what happened on the last two cycles, 2017 and 2021, looking back to the 2013 BTC price top.
In the analysis I spotted three types of events:
All Time High (ATH)
Cycle Bottom
Attempts to break the past cycle's ATH
This brought me some interesting "coincidences" that leads to some insightful predictions.
My conclusion, so far, is that an All Time High breakout is a very important moment to the possible alt season beginning. One thing that should be considered is that the current cycle has some different characteristics as, probably in detail, all of them have. This means that maybe it could take some more time to the alt season start, as it did for the ATH be finally broken.
One thing I did'n mention in the video is that the BTC dominance has broken a theoretical downtrend line. That said, considering the end of the year calendar change that is a mentally important moment, I wouldn't be surprised if the altseason waits till January to pick up.
To be continued...

USDT.DOMINANCE Chart Update !
USDT dominance is showing a downward trend after breaking out of a previous channel, which may indicate a decrease in stablecoin dominance in the market. The price of testing a green support zone is around 4.4%. If it fails to hold above this level, a further downside to the lower red support zone around 3.9% may be possible.
This decline in USDT dominance could imply a potential increase in buying pressure within the crypto market, as funds flow out of stablecoins and into more volatile assets, fueling upward momentum in the broader crypto market. However, a bounce back above the support zone may signal a temporary reversal in trend.
Traders should watch for reactions at these key support levels to better assess the direction of market sentiment.
Disclaimer: This analysis is for informational purposes and is not financial advice. Always stay updated with market movements and adjust your trading strategies as needed.
You can DM us for information on any other coin.
@Peter_CSAdmin

BTC DOMINANCE UPDATEBTC DOMINANCE ANALYSIS :
In the past 7 months, Bitcoin has been ranging between 50k and 70k, then Bitcoin made a new all-time high, during this period, altcoins have struggled to rise …yes, some have seen significant growth but the majority are still at very deep lows. The main reason for this is rise the dominance of Bitcoin alongside Bitcoin!
We are looking at the current level, I hope there will be a rejection …If it rejected here, we could see a great altcoin season, but if it continues to rise, we could reach 70% (2020 high) before the alt-season.
Keep following this chart!
Best wishes

Bitcoin's Final Push: Altcoin Rotation LoomsBitcoin dominance seems to be nearing its peak, but as with every end, we often see one last strong push.
It’s clear that only specific coins are currently outperforming Bitcoin, so I suggest continuing to focus on those until January/February. I believe Q1 will bring a massive rotation of capital into altcoins.
Just remember: most Bitcoin dominance tops tend to come after strong surges. So, I expect Bitcoin to continue climbing before we start calling the top.
If, by some chance, dominance hits 72%, I’ll be shifting the majority of my BTC stack into altcoins.

BTC DOMINANCE After a Trump victory the markets are booming, a new BTC ATH pushed bitcoin dominance to new local highs of 60.6%. Now we've seen a decent retracement on the daily candle and BTC is still in price discovery. This indicates to me that we have an altcoin resurgence on our hands, returning confidence in crypto and the green light for crypto support by America is a very important to this current rally.
I could see BTC dominance dropping to 59.5% before any continuation (bottom of the trend channel) higher and that's not particularly from a BTC selloff although that is possible as a SFP, but more likely is just BTC staying where it is and altcoins making up some ground.
RSI has dropped out of the oversold zone with this daily candle, a cool off is eventually inevitable as long as price stays flat while RSI cools it's very bullish.
A lot of that altcoin move needs to be from ETH imo, with BTC @ ATH Ethereum is 72% away from ATH... A massive difference and one that should close up going into Q1 2025.
The standard process for a crypto bullmarket is:
BTC --> ETH --> LARGE CAPS
--> MID CAPS --> SMALL CAPS
So far we're clearly still in the BTC phase, keeping a close eye on the ETHBTC chart to see if the momentum shifts towards Ethereum but that doesn't seem likely until next year at the earliest.

BTC dominance regaining strenghIn lower time frame, it looks #bitcoin #btc dominance is about to make a bounce after the recent short term dump.

Bitcoin's Necessary Correction: Why $69k is the Next Move!Hello Traders!
do you know why bitcoin is not falling ? let me tell you , BTC's Dominancy is just increasing and the 24H increasing from the day of election even not dropped 1% from 5th Nov till now , bitcoin will fall soon within days to the target in chart which is 68000-69898.
without giving these targets bitcoin can not go up to 92K.
follow me for more technical analysis and signals

BTC Dominance Transitioning from a range-bound market to a trending one:
EMAs and other indicators can stay highly overextended for longer than usual without signaling an immediate price retracement.
We expect any upcoming pullbacks to be relatively shallow.

BTC DominanceWe're approaching a crucial level in the market. While I can't say for sure this will be the peak, we're definitely getting close. Sentiment is low, frustration is high—clear signs we're hitting a psychological resistance point.

BITCOIN DOMINANCE about to hit double bottom target.Let's see how it reacts once there
Does it pus on through
tap it
does it consolidate
or start its reversal
BTC Dominance: 60% - "I'm the captain Now"Hello friends,
A quick follow-up to my previous BTC dominance analysis!
Remember when we talked about BTC at 54% and said 58% could be next?
Well, look where we are now - 60% dominance! Everything played out exactly as discussed.
What this means:
- We're deep in the "Alts Bleeding" phase
- The 50% danger zone is far behind us
- That 54% resistance? Completely crushed
- Next major target could be 65%
Real talk:
- This is NOT the time for alt trading
- Strong alts are barely keeping up with BTC
- Weak alts are getting destroyed
- BTC is the safest play right now
Keep it simple:
If you're still in alts, you might want to reconsider that position. BTC is showing who's boss ""Look at me, I'm the captain now"" , and fighting that trend is dangerous.
Previous analysis was spot on, and the trend is still strong. Sometimes the best trade is staying away from what's bleeding.
----------------
NFADYOR
----------------
GL & trade safe!

#BTC DOMINANCE, LAST OPPORTUNITY TO BUY CHEAP ALTS!Bitcoin Dominance is currently around 60.51%, keeping BTC in the 68k–70k range while altcoins drop 20-40% from recent highs.
This pattern is common in bull runs, as rising BTC dominance typically pulls altcoins down. In my experience, a rejection zone between 64% and 65.81% could trigger an altcoin rally while BTC hits new all-time highs and moves sideways.
Here are three key points to watch:-
1. BTC Dominance reaching rejection levels.
2. BTC closing above the monthly resistance of $71,378.
3. Altcoins holding higher time frame supports and showing reversal signs.
If these align, it could be a strong opportunity for altcoins.
Patience here pays off – holding USDT or stablecoins now could let you buy altcoins at lower levels soon.
I'll be sharing important updates as needed. Currently, I’m on complete bed rest due to a fractured wrist and some deep wounds, but my DMs are open if you need to reach out. I'll do my best to answer questions whenever I'm able.
Thank you for your understanding!
For now, stay focused, and let’s spot these opportunities.
If you enjoy these insights, hit like and share your thoughts. Let me know if you’d like any specific chart requests.
Thank you!
