Bitcoin Retests Breakout Zone – Will It Bounce Again?Hello traders, here is the Quick CRYPTOCAP:BTC update
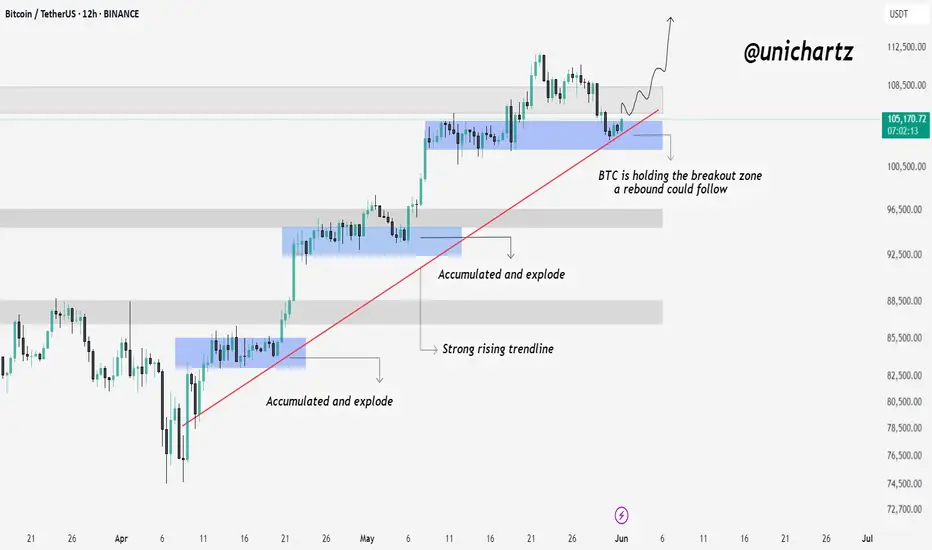
Bitcoin is currently holding right at the previous breakout zone, which also aligns with the rising trendline and previous accumulation area.
This zone has acted as a strong launchpad in the past — where BTC accumulated and exploded higher. If buyers defend this level again, we could see another rebound play out from here.
As long as BTC holds this structure, the bullish trend remains intact.
Btcdominance
ETH/BTC vs btc dominanceethereum received a reaction as we expected from the current demand zone in the bitcoin pair, and it seems inevitable that the upward momentum from the current area will continue. on the bitcoin dominance side, the same situation exists, but I think we will witness a bearish absolute process.

Bullish Altcoins: Bitcoin Dominance In Correction ModeHere BTC.D is still moving within a classic ABC correction. The peak happened 7-May. After 14-May there was a bounce but this bounce ended in a lower high. The correction is not over.
As this index moves lower, the Altcoins market will grow.
When Bitcoin turns sideways, retraces or consolidates, it is an opportunity for the smaller Altcoins to move forward. This is the scenario we are entering right now.
» Bitcoin sideways. Altcoins bullish. Long-term growth.
The 2025 bull market is only starting now. Prepare for growth until late 2025 or beyond (early 2026).
Namaste.

USDT dominance chart!The chart shows USDT.D (Tether dominance) moving within a descending channel.
Currently, USDT.D is testing the upper resistance of the channel, around 4.65%.
If the dominance gets rejected at this level, the next potential target is the lower channel support around 3.9-4.0%.
This could indicate a risk-off environment where traders move capital from stablecoins (USDT) to more volatile assets like Bitcoin or altcoins.
The 50 and 200 moving averages provide dynamic resistance levels that support this potential downside move.
Thanks for your support!
DYOR. NFA

WARNING! Sell Your Altcoins, -40% Drop AheadHello, Skyrexans!
The title of this article is made specially for haters. I see euphoria on each small drop of CRYPTOCAP:BTC.D and understand that altseason now will not happen. People are still holding and dreaming Lambos. This is very bad for potential growth, so I expect only dump on risky alts with the new dominance push!
Look at the 4h time frame. As you remember from my previous analysis I expect the global wave 5. In my opinion waves 1 and 2 have been finished already. Wave 2 represented as an irregular ABC correction. Target at 0.38 Fibonacci has been reached. Now it's time for wave 3 which will reach 67%. During this dump on altcoins I wanna see total disappointment of moon boys and selling on every local bounce. I will repeat once more, market shall be cleared from the crowd to go up.
I am not an altseason hater. I am also holding some altcoins, but it's important to understand the real picture and have the right exaltations. Otherwise you will be disappointed and go out from rocket. I wish for clever, patient and realistic people to earn on the altseason, but first of all market need to persuade greedy and disrespectful people to escape altcoins.
Best regards,
Ivan Skyrexio
___________________________________________________________
Please, boost this article and subscribe our page if you like analysis!

TradeCityPro | Bitcoin Daily Analysis #104👋 Welcome to TradeCity Pro!
Let’s dive into Bitcoin and key crypto indices. As usual, in this analysis I’ll walk you through the triggers for the New York futures session.
⏳ 1-Hour Timeframe
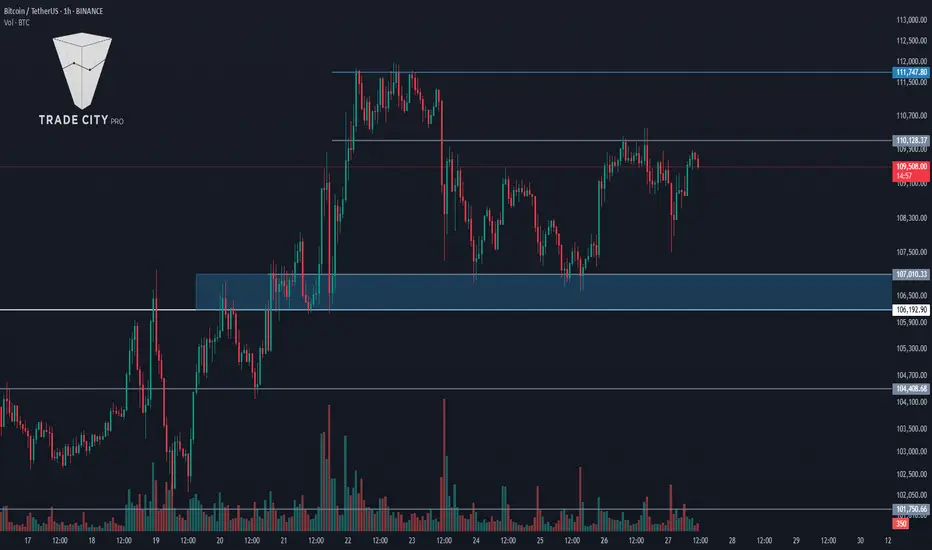
On the 1-hour chart, as you can see, Bitcoin was once again rejected from the 110128 level yesterday and is now hovering near 108237.
✔️ At the moment, price hasn’t yet touched the 108237 support. If it manages to stay above this level without breaking below, the chances of retesting 110128—and even breaking above it—increase.
🔍 If 108237 is broken, a short position could be considered. However, keep in mind that this setup goes against the current uptrend. As mentioned in previous analyses, the 106192–107010 range is a major support zone, and as long as price remains above it, the trend remains bullish.
📉 The main short trigger would be a break below this key support. If that occurs, it could introduce strong bearish momentum. An RSI break below 38.57 would serve as a momentum confirmation.
✨ During this pullback from 110128, market volume has been decreasing, which indicates the strength of the ongoing uptrend.
💥 If 110128 is broken, and considering the strong trend, a long position could be initiated. An RSI break above 50 would provide additional confirmation. The primary long trigger remains a break above 111747.
👑 BTC.D Analysis
Bitcoin Dominance continued to fall yesterday, reaching as low as 63.87. It has shown a slight bounce from that level and is currently in a mild upward correction.
⭐ If a lower high forms below 64.18, the chances of breaking below 63.87 increase. However, if the correction goes beyond 64.18, the probability of resuming the uptrend will grow.
📅 Total2 Analysis
Yesterday, Total2 was rejected from 1.24 and corrected down to 1.21. If price bounces from here and heads back toward 1.24, the chances of breaking that resistance will rise.
📊 If 1.21 fails to hold, a deeper correction toward 1.18 could follow.
📅 USDT.D Analysis
USDT Dominance is forming a lower high compared to 4.56. If this plays out and 4.49 is broken, it would confirm a bearish move.
⚡️ On the other hand, if 4.56 is broken to the upside, the move could extend toward 4.62.
❌ Disclaimer ❌
Trading futures is highly risky and dangerous. If you're not an expert, these triggers may not be suitable for you. You should first learn risk and capital management. You can also use the educational content from this channel.
Finally, these triggers reflect my personal opinions on price action, and the market may move completely against this analysis. So, do your own research before opening any position.

What is Bitcoin Dominance, and When Can We Expect Altseason?What is Bitcoin Dominance, and When Can We Expect Altseason?
✅ In the fast-paced and ever-changing world of digital currencies, traders and investors are continually seeking signs and tools to aid them in making informed decisions. One key sign is Bitcoin Dominance (BTC.D).
Understanding this and examining its chart can provide us with important clues about what the market might do next, especially regarding when Altseason (the period of growth for altcoins) might begin.
CRYPTOCAP:BTC.D
What is Bitcoin Dominance (BTC.D)?
Simply put, Bitcoin Dominance indicates the percentage of the total value of all digital currencies that is held by Bitcoin. For example, if the total value of all digital currencies is $1 trillion and Bitcoin's value is $600 billion, then Bitcoin's Dominance is 60%.
This number is very important because:
It shows market feeling: When Bitcoin Dominance goes up, it usually means money is moving to Bitcoin as a safer option, and people are less willing to take risks. When Bitcoin Dominance goes down, it can mean people are more confident in altcoins and are ready to take more risks for bigger profits.
It shows money flow: Changes in BTC.D show how money is moving between Bitcoin and altcoins.
❓ What is Altseason?
Altseason is a time in the digital currency market when altcoins (digital currencies other than Bitcoin) do much better than Bitcoin, and their prices go up a lot.
During Altseason, money often flows from Bitcoin to altcoins, and many altcoins can see their prices increase many times over.
Looking at the Current Bitcoin Dominance Chart and forecasting Altseason
If we look at the provided chart for Bitcoin Dominance (BTC.D), we can see a few key things:
Long-term upward channel: The chart shows that Bitcoin Dominance has been in a long-term upward path. The bottom of this path is marked by a blue support line , and the top is marked by a red resistance line . This means that, in the bigger picture, Bitcoin's control over the market has been growing.
Broken short-term upward trend: There was a shorter-term upward trend line (shown in black on the image) that the price broke below on May 9th . This break could be an early warning sign that Bitcoin's dominance might be weakening in the short term, and its dominance might start to fall.
⚠️ But here is a very important point:
We cannot be sure that Altseason has definitely started until the price clearly breaks below the main support line of the channel (the blue line) and stays below it.
The break of the short-term upward trend line (black line) is an early signal. However, to confirm a change in the trend and the possible start of a significant Altseason, we need to see stronger support levels, like the blue support line on the chart, get broken.
⏳ So, When Should We Expect Altseason?
Based on the chart analysis and the points mentioned:
Early Sign: The break of the short-term upward trend line (black) on May 9th might make people pay more attention to altcoins, but it's not enough on its own.
Key Condition for Altseason: The most important signal for the start of a real Altseason would be if the Bitcoin Dominance price breaks below the blue support line of the long-term upward channel. As long as Bitcoin Dominance stays above this support line, Bitcoin will likely keep its relative strength in the market, and altcoins might only see limited growth or could even face selling pressure.
Conclusion:
Analyzing Bitcoin Dominance is a useful tool for understanding how the digital currency market works and for predicting possible trends. Right now, because the short-term trend line has been broken, the market is at a sensitive point. However, traders and investors should watch the BTC.D price movements very carefully and wait for stronger confirmations, especially a possible break of the blue support line, before announcing the start of Altseason.

TradeCityPro | Bitcoin Daily Analysis #103👋 Welcome to TradeCity Pro!
Let’s dive into Bitcoin and key crypto indices. As usual, in this analysis I’ll walk you through the triggers for the New York futures session.
⏳ 1-Hour Timeframe
As you can see on the 1-hour chart, Bitcoin was rejected from the 110128 resistance yesterday and began a pullback, but it didn't reach the support at 107010 — instead, it formed a higher low and is now moving back toward 110128.
📊 Buy volume during this bullish leg has been relatively low, which isn’t ideal for a strong uptrend and indicates potential weakness.
📈 If the 110128 resistance breaks, a long position can be considered. However, if you take this trade, I suggest not setting your target at 111747 — instead, aim for higher targets and hold the position longer.
💥 The main long trigger remains at 111747. So if you missed or don’t want to trade the 110128 breakout, you can wait for this higher confirmation.
🔽 As for short setups, just like yesterday, it's still better to wait for a trend reversal. As long as the price remains above the support zone, the uptrend remains intact.
👑 BTC.D Analysis
Bitcoin Dominance broke above 64.32 yesterday but failed to hold and fell back below it, also breaking the 64.18 support. It’s now moving toward 63.97.
⭐ Currently, there is strong bearish momentum in BTC.D, and if 63.97 is broken, this downward move is likely to continue.
📅 Total2 Analysis
Total2 printed a higher low above 1.18 and has now broken above the 1.22 resistance.
✨ If it can hold above this level, we could see an upward move toward 1.26. For bearish confirmation and short positions, a break below 1.18 would be the key trigger.
📅 USDT.D Analysis
USDT Dominance printed a lower high compared to 4.62 and is now sitting on support at 4.49. A break below this level could push the dominance down to 4.38.
🎲 To confirm a bullish reversal in USDT.D, we would need to see a break above 4.62.
❌ Disclaimer ❌
Trading futures is highly risky and dangerous. If you're not an expert, these triggers may not be suitable for you. You should first learn risk and capital management. You can also use the educational content from this channel.
Finally, these triggers reflect my personal opinions on price action, and the market may move completely against this analysis. So, do your own research before opening any position.
Bitcoin DominanceThe bear market in altcoins—characterized by their continued underperformance relative to Bitcoin—remains in effect. However, a strong bearish divergence is forming on the Bitcoin Dominance chart, indicating a potential reversal. This suggests that Bitcoin's dominance may decline soon, potentially signaling the beginning of a capital rotation into altcoins.

BITCOIN DOMINANCE Update (12H)This analysis is an update of the analysis you see in the "Related publications" section
After hitting the two resistance lines marked on the chart (yellow circle), we saw a reaction, but it doesn’t seem like the trend has changed.
There’s a possibility that a double top could be forming on the dominance chart.
This suggests that selling pressure on altcoins may continue until this index approaches its peak zone.
For risk management, please don't forget stop loss and capital management
Comment if you have any questions
Thank You

TradeCityPro | Bitcoin Daily Analysis #102👋 Welcome to TradeCity Pro!
Let’s dive into Bitcoin and key crypto indices. As usual, in this analysis I’ll walk you through the triggers for the New York futures session.
⏳ 1-Hour Timeframe
As you can see in the 1-hour timeframe, yesterday we saw a bullish move that pushed the price up to and beyond the 109229 level.
🔍 In the previous analysis, I mentioned that if the price finds support before reaching 106192 and breaks above 109229, we could draw a support zone between the recent low and 106192. That’s exactly what happened — I’ve now marked the support range between 106192 and 107010.
💥 This is a critical support area, and if price revisits it later, it could act as a strong support. For now, the price is moving upward, and after breaking 109229, the next resistance is at 111747.
✔️ If you didn’t open a long position on yesterday’s trigger, you’ll need to wait for the break of 111747. If you already have an open position, you can hold it for now, as Bitcoin’s long-term trend is bullish and the move may continue.
📊 If buying volume increases and RSI breaks above 70 and enters the Overbought zone, bullish momentum will strengthen significantly, and the chances of breaking 111747 will increase.
📉 As for short positions or trend reversal — it's better not to consider them yet, as long as the price remains above the support zone. The uptrend is strong and offers better setups.
👑 BTC.D Analysis
Bitcoin dominance is still oscillating below the 64.32 level and hasn’t broken it yet. A local low has formed around 64.18.
🔔 A break above 64.32 would confirm the start of the next bullish leg in dominance. Conversely, breaking 64.18 could lead to a deeper correction toward 63.97 or even 63.50.
📅 Total2 Analysis
Yesterday, the descending trendline I highlighted was broken, and price moved up to 1.22.
✨ Breaking 1.22 would confirm the start of a larger bullish leg toward 1.26. If Total2 declines instead, we could enter on a break below 1.118.
📅 USDT.D Analysis
Yesterday, Tether dominance was rejected from the 4.62 resistance and also broke through 4.51.
🎲 If price moves toward 4.38 again, the probability of breaking this level will rise significantly — especially since a lower high has formed at 4.72, indicating that bearish momentum could be entering the market.
❌ Disclaimer ❌
Trading futures is highly risky and dangerous. If you're not an expert, these triggers may not be suitable for you. You should first learn risk and capital management. You can also use the educational content from this channel.
Finally, these triggers reflect my personal opinions on price action, and the market may move completely against this analysis. So, do your own research before opening any position.

Altseason Will NOT Start While You Are Holding Altcoins!Hello, Skyrexians!
Time for the negative article about CRYPTOCAP:BTC.D which is our favorite topic recently because I see now the euphoria again that altseason has been started. The answer is no, it has not and the main reason is the crowd which still holding altcoins. I told many times - sell altcoins and altseason will be started.
Let's go to Elliott waves. As I told you wave 4 has been finished at 0.38 Fibonacci level and with the Awesome Oscillator cross of the zero line. Now it's time for wave 5. Target is the same equals 67%. Only when we see this price and the double divergence we have a chance that liquidity will transfer from Bitcoin to altcoin. Next 2 weeks will be disaster for all altcoins holders.
Best regards,
Ivan Skyrexio
___________________________________________________________
Please, boost this article and subscribe our page if you like analysis!

TradeCityPro | Bitcoin Daily Analysis #100👋 Welcome to the 100th Bitcoin Analysis!
I'm really happy we've shared this 100-day journey together, and I hope you've been able to benefit from these analyses along the way.
💥 Every single analysis I've posted so far has been the basis for real trades that I've taken myself. I'm glad to say the overall result of those trades has been profitable, and I hope your results have been positive too.
⚡️ Today, I want to do a full multi-timeframe breakdown of Bitcoin and other major crypto indices. Let’s dive in and see where the market stands.
💰 Bitcoin Analysis
📅 Weekly Timeframe
As you can see, in the weekly chart, Bitcoin reacted to an ascending curved trendline during its recent correction phase and retraced up to around 72,147.
💫 On the RSI, we also have a key support level at 44.75, which has held again. The combination of this support with the curved trendline has created a potential PRZ (Potential Reversal Zone), and price has since resumed its upward move.
✔️ Last week’s candle managed to close above the resistance at 104,919 for the first time ever. Many in the market expected that a weekly close above this level would trigger a sharp rally toward 130,000 or even 160,000.
📊 However, that hasn’t happened—this week’s candle is still small and lacks strong bullish momentum.
✨ We can now view the range between 104,919 and 108,454 as a resistance zone. Although the price has entered this zone, we haven’t yet confirmed a breakout. That confirmation would come with a weekly close above 108,454.
📈 Despite the strong momentum before breaking ATH, price seems to be losing steam now. That’s not necessarily bad—it’s actually expected, since this area is one of the most important supply zones for Bitcoin and won’t break easily.
🔽 If price gets rejected and this move turns out to be a fakeout, there’s a real possibility of a trend reversal. We’ve got a potential double top forming, which is usually the first signal of a reversal. If price then breaks the 72,147 support, it would confirm the end of the current uptrend. A lower high and lower low afterward would confirm a new downtrend.
⭐ At this point, I can’t give you a new spot-buy trigger in this timeframe. The trigger was around the curved trendline. Since price has moved away, we need to wait for a new setup to form.
Let’s check lower timeframes for more detailed price action.
📅 Daily Timeframe
In the daily chart, after getting support at 76,087, price started moving up and with the breakouts of 87,700 and 91,953, the bullish phase began.
🔍 Currently, price is holding above 106,250 with increasing volume since the 91,953 breakout. Everything looks ready for Bitcoin to begin its main move and enter an extension leg up.
🚀 If this happens, price could target 129,000 and even 150,000. RSI will be key for confirmation—if it re-enters Overbought territory and holds above 77.81, higher targets become more likely.
🛒 The previous spot-buy triggers I gave were at 87,700 and 91,900. If you entered with those, I recommend holding for now and waiting for signs of a trend change before taking profits.
🔔 If you didn’t buy earlier, I can’t provide a new entry just yet—we need to wait for a new structure and trigger to form.
🔽 For now, I still see the trend as bullish. A bearish scenario would require a fakeout below 106,250—if price drops and forms a lower high and lower low, the uptrend would be over and a downtrend would begin.
⏳ 4-Hour Timeframe
After breaking 106,250, price rallied to 111,826 and is now pulling back to 106,250.
✔️ RSI is holding above its local support at 44.48, and as long as it stays above that level, market momentum remains bullish.
📈 You can consider entering a long on a pullback to 106,250. A breakout above 111,826 would be the main trigger for a new long.
🔑 Right now, there’s no valid reason to short, so it’s best to wait for a clear bearish structure before considering that.
👑 Bitcoin Dominance (BTC.D)
📅 Weekly Timeframe
After several green weekly candles, BTC.D printed a large red candle, pulling back toward the midline of its ascending channel and rejecting from 64.77. However, it’s now moving back up again.
💥 With this strong momentum, there’s a good chance BTC.D could break out of the channel. If 64.77 breaks, we could see a push toward 71.04.
⚡️ To confirm a bearish reversal in BTC.D, we’d need to see a breakdown below the lower trendline of the channel. That would likely signal the start of an altseason.
📅 Daily Timeframe
BTC.D has been in an uptrend and even broke above its channel briefly. But after hitting 65.31, it started a correction and dropped to the midline at 62.22.
🎲 It quickly bounced from 62.22 and is now moving upward again. Given the bullish structure, it could retest the 65.31 high.
📈 If it forms a lower high and breaks below 62.22, that would confirm a trend reversal. A breakout above 65.31 would confirm continuation of the uptrend.
⏳ 4-Hour Timeframe
BTC.D rallied to 64.31 and is now trying to retest that level. If it breaks above 64.31, the next target is 65.41.
🧲 If it forms a lower high and breaks 63.51, we’d get a confirmation that the bullish leg has ended, increasing the chances of a move to 62.17.
✔️ Total2 (Altcoin Market Cap Excluding BTC)
📅 Weekly Timeframe
After breaking the curved trendline, Total2 fell to around 816B before bouncing alongside Bitcoin.
⚡️ Currently, it’s ranging between 1.15T and 1.26T for the past three weeks.
🧩 If price breaks this range, it could rally toward 1.61T, which is the most important supply zone for Total2. A breakout here would likely trigger a strong altcoin rally.
🛒 If that breakout coincides with a drop in BTC.D, it would be an excellent spot-buy opportunity for altcoins.
📊 If the current rally fails to reach 1.61T and forms a lower high, another drop toward 816B is likely. This time, the chance of breaking that support would be high—confirming a trend reversal.
📅 Daily Timeframe
Price is stuck in a range between 1.15T and 1.26T.
🔼 A breakout from either side would likely lead to a strong move. A break below 1.15T could extend the decline toward 861B, while a break above 1.26T would target 1.62T.
⏳ 4-Hour Timeframe
Same structure as the daily chart. Long trigger = 1.26T breakout. Short trigger = 1.15T breakdown.
🔑 If price forms a higher low and starts moving back up, the likelihood of breaking 1.26T increases. The next target would be 1.33T.
✔️ USDT Dominance (USDT.D)
📅 Weekly Timeframe
USDT.D is ranging between 3.78 and 6.22.
📉 It recently formed a lower high below 6.22 and broke below 5.06, now heading toward 3.78.
🤔 If USDT.D drops to 3.78, we could see a major market rally—Bitcoin might move toward 130,000 or 160,000.
🚀 If 3.78 breaks, the next support is at 2.53, which would mark the start of a major bull run.
📅 Daily Timeframe
USDT.D has hit support at 4.40 and is now approaching a descending trendline that’s been holding since the 6.22 top.
📈 If that trendline breaks, the trigger is at 4.70. A breakout here could lead to a move to 5.02.
🔽 If price gets rejected again, the short trigger is at 4.40, and the next support is at 3.81.
⏳ 4-Hour Timeframe
Support at 4.38 has held, and price is now above 4.50 and approaching the trendline.
🎲 If 4.50 fails and price drops to 4.40, a break below 4.40 confirms a bearish continuation.
📊 If the trendline breaks, use 4.74 as your confirmation trigger.
❌ Disclaimer ❌
Trading futures is highly risky and dangerous. If you're not an expert, these triggers may not be suitable for you. You should first learn risk and capital management. You can also use the educational content from this channel.
Finally, these triggers reflect my personal opinions on price action, and the market may move completely against this analysis. So, do your own research before opening any position.

BTC.D: Key Level64.29% acted as key resistance in February. Another strong rejection at this level could mean BTC dominance has topped out for this cycle.

No one is talking about this! Big breakout Incoming! Here'S Why!CRYPTOCAP:USDT dominance is nearing a potential death cross on the daily chart. The last time this happened, we saw nearly 40 days of uninterrupted green across altcoins.
During that period, CRYPTOCAP:BTC rallied from $67,476 to $101,898. Many altcoins surged between 90% and 300%.
We’re now witnessing similar conditions unfold.
If this crossover gets delayed or invalidated (Less likely but entirely possible), altcoins may experience short-term corrections.
But the broader altcoin season remains inevitable.
If this helped you gain perspective, give it a like and repost.
You might want to bookmark it, I’ll update the chart as this plays out.
Don’t let short-term volatility shake you out of generational opportunities.
Be strong there, WAGMI!
#PEACE

TradeCityPro | Bitcoin Daily Analysis #99👋 Welcome to TradeCity Pro!
Let’s go over the Bitcoin and major crypto index analysis. As usual, I’ll cover the key futures session triggers for New York.
⏳ 1-Hour Timeframe
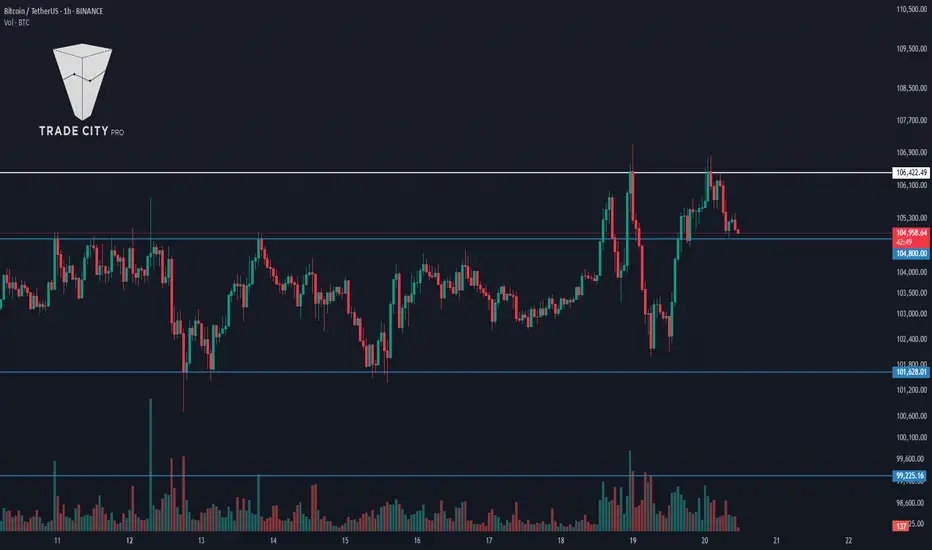
As you can see on the 1-hour chart, Bitcoin is still trading below the 111817 level and has formed a support at 110455 after multiple rejections from that resistance.
✔️ If this 110455 level breaks, we could see a deeper pullback toward 109195, and potentially even down to 106422.
✨ The RSI oscillator is currently sitting at the 50 support level again. If RSI breaks below 50, it would indicate a weakening bullish momentum and increase the likelihood of a bearish scenario.
💥 However, if RSI holds above 50, it would confirm that buyers are still in control, and the probability of the uptrend continuing increases.
⚡️ The 111817 level remains a very clean and strong trigger for a long position. If price breaks this level, the market could make another leg up.
📊 Make sure to watch the volume closely. If buy volume starts to increase, a breakout above 111817 could offer a strong entry for those not already in a position.
👑 BTC.D Analysis
Bitcoin dominance broke below 63.76 yesterday, which helped altcoins rally, but it has since recovered and moved back above that level.
📈 For now, dominance is ranging between 63.76 and 64.30. A breakout from either side would confirm the direction of the next move.
📅 Total2 Analysis
Total2 was rejected from the 1.26 resistance and has now fallen below 1.23. If this downward move continues, the next support levels are at 1.18 and 1.15.
🔑 If price finds support here and moves back up to retest 1.26, a breakout from that level would be a fresh long trigger.
📅 USDT.D Analysis
Tether dominance found support at 4.38 and is now moving upward.
🧩 As long as it remains below 4.51, the overall market momentum is still considered bullish. But if it manages to stabilize above 4.51, the likelihood of a broader market correction increases.
❌ Disclaimer ❌
Trading futures is highly risky and dangerous. If you're not an expert, these triggers may not be suitable for you. You should first learn risk and capital management. You can also use the educational content from this channel.
Finally, these triggers reflect my personal opinions on price action, and the market may move completely against this analysis. So, do your own research before opening any position.

$BTC.D + $USDT.D + $USDC.D = Flight to Safety Breaking DownFLIGHT TO SAFETY chart is breaking down.
Once the 20WMA breaks under the 50WMA the flood-gates are open.

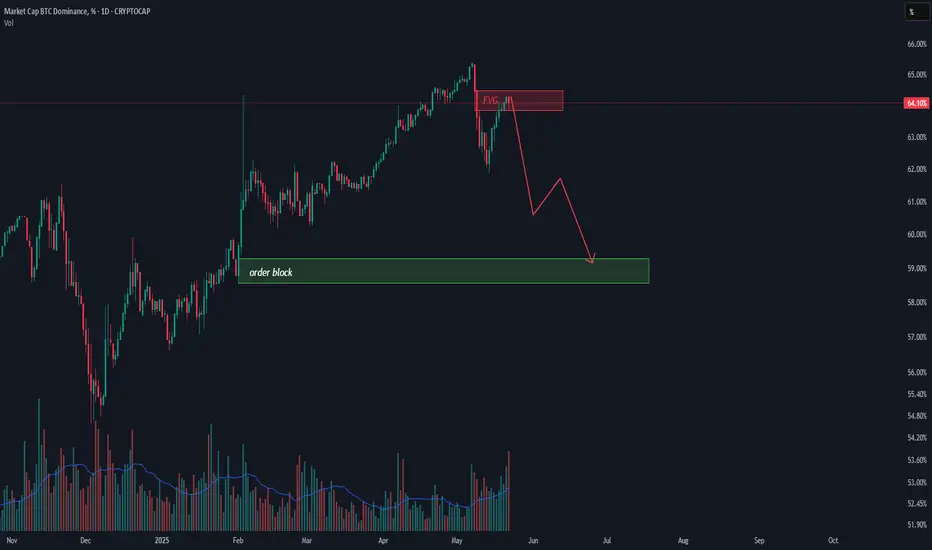
BTC dominance next move (maybe) looking at this BTC Dominance chart, we’re currently sitting around 64.13%, and price just tapped into that red zone marked as “FVG” — that’s a fair value gap, basically an area where price moved too fast before and didn’t fill orders properly as you see this is my take on BTC Dominance and i think its going to the order block that its around 58%
this is just my take, not financial advice. No one can predict the crypto market with certainty. It's wild and full of surprises, so always do your own research and stay sharp.
TradeCityPro | Bitcoin Daily Analysis #98👋 Welcome to TradeCity Pro!
Let’s dive into the Bitcoin and major crypto indices analysis. As usual, I’ll walk you through the New York futures session triggers.
⏳ 1-Hour Timeframe
As you can see, the price has finally broken above the 106422 resistance, and after some pullbacks to that level, it continued its bullish move up to 111817. It is now consolidating just below this level.
💥 The RSI oscillator is clearly reflecting price movements. Each time it reaches the Overbought zone, it gets rejected, leading to a price correction. These RSI corrections typically reach the 50 level, which has been acting as a bottom signal.
📈 For today’s long position, if RSI can stabilize above Overbought and a higher low forms above the 50 line, you can enter on a breakout of 111817. This would be a momentum-based trigger.
✨ The reason I’m emphasizing RSI today is that all the primary price-based triggers we’ve talked about—like 106422, 104800, and even levels down near 85000—have already been activated. So, if you’re not already in a position, you’ll need to rely on momentum indicators.
🧩 Another momentum trigger is a pullback to the SMA25 followed by a confirmation candle. However, I still believe breaking above 111817 is the stronger signal.
📊 As for short positions, I think by now it’s clear why I’m not recommending any. My strategy focuses on trading with the trend, and that keeps me from opening unnecessary trades. Like in recent weeks, we’ll wait for a trend reversal before considering shorts.
👑 BTC.D Analysis
Bitcoin dominance has been rising alongside price, hitting the 64.30 resistance. If Bitcoin consolidates or corrects slightly, BTC.D could break below 63.76, signaling a potential altcoin rally.
✔️ The 63.76 level is a key trigger—breaking it confirms continuation of BTC.D’s downtrend. On the flip side, a break above 64.30 would resume BTC.D’s long-term uptrend.
📅 Total2 Analysis
Total2 has resumed its upward move, and after breaking 1.23, it’s heading toward 1.26.
🔼 If BTC.D starts dropping, breaking 1.26 will be a strong long trigger for altcoins.
📅 USDT.D Analysis
Tether dominance has dropped sharply in sync with market gains. After losing the critical 4.51 support, it’s now heading toward 4.37.
⚡️ There’s still some space left before reaching that level. But if 4.37 breaks, it would be another strong long trigger for altcoins.
❌ Disclaimer ❌
Trading futures is highly risky and dangerous. If you're not an expert, these triggers may not be suitable for you. You should first learn risk and capital management. You can also use the educational content from this channel.
Finally, these triggers reflect my personal opinions on price action, and the market may move completely against this analysis. So, do your own research before opening any position.

TradeCityPro | Bitcoin Daily Analysis #97👋 Welcome to TradeCity Pro!
Let’s go over the Bitcoin analysis and key crypto indices. As usual, I’ll be reviewing the triggers for the New York futures session.
⏳ 1-Hour Timeframe
As you can see, a Double Bottom pattern activated yesterday, and the price has returned to the 106422 zone.
✔️ We previously had a support at 102882, but since the price wasn’t respecting it consistently, I’ve removed it. If price shows solid support there again, I’ll reintroduce the level.
🔍 Currently, the first trigger for a long position is 106422. This is a highly critical level and represents the main resistance for Bitcoin. If it breaks, there’s a strong chance for a sharp upward move.
✨ The first support in the way is 104800, which isn’t very strong. If a correction occurs, this level is likely to break. The main support remains at 101628.
📈 A break below 101628 would confirm a bearish reversal, and we could even consider opening a short position. The next support below that would be at 99225.
📊 Market volume has significantly increased over the past few days. This spike in volume suggests that a sharp move is likely. Using our trigger levels, we’ll be able to determine whether it’s an upward or downward breakout.
👑 BTC.D Analysis
Bitcoin dominance is still below the 64.04 zone and appears to be consolidating.
💥 The 64.04 level is highly sensitive. A breakout would signal a bullish shift in dominance, while a rejection would suggest the downtrend will resume.
⚡️ We’ll get confirmation of further downside if 63.71 breaks. Below that, the next support levels are at 63.30 and 62.65.
📅 Total2 Analysis
Yesterday, Total2 reacted to the 1.16 support and moved upward to 1.20.
💫 A break above 1.20 today would confirm bullish continuation. A drop below 1.16, however, would confirm the continuation of a broader correction.
📅 USDT.D Analysis
Yesterday, the 4.70 level was faked out, and the chart fell back into the range box.
🎲 I believe the chances of breaking below the range bottom have increased. Key bearish triggers are at 4.57 and 4.51. On the flip side, another break above 4.70 would confirm renewed bullish momentum for USDT dominance.
❌ Disclaimer ❌
Trading futures is highly risky and dangerous. If you're not an expert, these triggers may not be suitable for you. You should first learn risk and capital management. You can also use the educational content from this channel.
Finally, these triggers reflect my personal opinions on price action, and the market may move completely against this analysis. So, do your own research before opening any position.
$BTC.D : Have we seen the top or a local top in the $BTC.D ? CRYPTOCAP:BTC has been a recent bull run and trying to reclaim the ATH of 107K USD. Currently firmly above 100K the Crypto currency looks very bullish in the near to medium term. But what we have seen is an the CRYPTOCAP:BTC.D chart is having an initial hiccup in this later part of the cycle. For the first time in the last few quarters there has been a back to back 2 weeks where CRYPTOCAP:BTC.D has 2 red candles. CRYPTOCAP:BTC.D reached it local peak of 65.3% which we have closely predicated in this blog space many weeks ago. We said the target for CRYPTOCAP:BTC.D for this cycle is 66%. We came close to 66% and since then we are seeing weakness in the CRYPTOCAP:BTC.D chart.
Now the question comes was that the top in CRYPTOCAP:BTC.D chart ? My take is that this is a local top. We might see some weakness in CRYPTOCAP:BTC.D in the upcoming weeks. Then we will again bounce back to break above the 66% decisively before this cycle comes to an end.
Verdict : CRYPTOCAP:BTC.D achieved a local top. Cycle top taget remains above 66%. Long term bullish on $BTCUSD.

TradeCityPro | Bitcoin Daily Analysis #96👋 Welcome to TradeCity Pro!
Let’s move on to the Bitcoin and major crypto index analysis. As usual, I’m going to review the triggers for the New York futures session.
⏳ 1-Hour Timeframe
As you can see on the 1-hour chart, yesterday we had a bullish move that extended up to the 106247 level.
🔍 However, as I previously mentioned, this is a very sensitive zone for price action, and we might see sharp reactions from it. That’s exactly what happened—price faced a strong rejection after reaching this level and dropped down to 102882.
📊 Market volatility is currently very high, and the risk of getting stopped out in either direction is significant. So we need to be cautious and avoid getting caught in fake moves.
💥 Personally, I recommend avoiding trades right after such volatility and waiting for a new structure to form. But if you’re planning to take a position, keep the risk very low.
⚡️ For a short position, our first trigger is a break below 101628. Alternatively, we could also enter based on how the price reacts to 102882.
📈 For a long position, we currently have no clear setup until price structure forms. The only long triggers I can give for now are the breakouts of 104800 and 106247.
👑 BTC.D Analysis
Bitcoin dominance has started a new uptrend and has even closed above 63.71. Given the healthy structure of this trend, if 64.04 breaks, we can confirm a full bullish breakout for BTC.D.
💫 If BTC dominance continues rising while the market moves up, Bitcoin will likely outperform most altcoins.
📅 Total2 Analysis
Looking at Total2, the 1.17 support broke yesterday, and now this index is set up for further downside correction. For now, it seems the market is in a decision-making phase.
🧲 If we get a lower low and lower high below 1.17, the chance of a move toward 1.1 increases significantly.
📅 USDT.D Analysis
Now for USDT dominance—yesterday it faked out the 4.60 level twice and is currently holding above 4.70, heading toward 4.82.
🧩 If this move turns out to be a fake and price stabilizes below 4.70 again, it would give us a strong signal for a bullish market and a bearish turn for USDT dominance.
❌ Disclaimer ❌
Trading futures is highly risky and dangerous. If you're not an expert, these triggers may not be suitable for you. You should first learn risk and capital management. You can also use the educational content from this channel.
Finally, these triggers reflect my personal opinions on price action, and the market may move completely against this analysis. So, do your own research before opening any position.

Bitcoin Dominance Is Growing, But Don't Panic!Hello, Skyrexians!
When I shared last update on CRYPTOCAP:BTC.D I mentioned that not sure that altseason has been started, now I decided to go back to my first scenario where dominance shall reach 67%.
You can tell me that wave 4 shall be ABC shaped and now we will see dump to 61%, but dominance usually has the very sharp corrections, moreover 0.38 Fibonacci has been reached and Awesome Oscillator crossed zero line on 2 days time frame. Wave 4 is likely to be finished. Now wave 5 is going to the most likely target at 67%. This pump will be fast, may be in 1-2 weeks. Also wanna tell about disaster max target at 72%. This target is very very unlikely because it will break all picture on 1 week time frame, but also let's just keep in mind. This analysis perfectly correlates with ATOM analysis, which is also actual for all altcoins.
Best regards,
Ivan Skyrexio
___________________________________________________________
Please, boost this article and subscribe our page if you like analysis!
