Simple Path Possibilities for BTC DomSuper simple / quick post. Bitcoin dominance had a confirmed double top, and now may or may not confirm a double bottom.
If it does, it will likely move up to resistance and then back down before deciding to break through resistance or support.
Otherwise, it may just lose support
Btcdominance

Alts Black Swan Event Possible?BTC.D #BTC Dominance is still moving around strong resistance area, If it will breakout from here then expect a black swan event for Alts but if we get a proper rejection then Be Ready for Alt Season! Wait patiently for clear confirmation

Looking at the Market Cap chart, the coin market trendHello?
Traders, welcome.
If you "Follow", you can always get new information quickly.
Please also click "Boost".
Have a good day.
-------------------------------------
(USDT chart)
The new high (ATH) continues to rise, creating a gap.
(USDC chart)
Contrary to USDT, USDC remains in a downtrend, still gapping.
Therefore, it is necessary to countermeasures against this as it can limit the rise of the coin market or cause a sharp decline.
The countermeasure against this trend is not to find a time to split and sell, but to find a time to buy and sell.
Misunderstanding this and proceeding with split selling or selling 100% and then buying when it fell will increase your psychological anxiety, and you should be careful as you may proceed with a wrong transaction and continue to regret it in the future.
BTC 29K or less is a buy zone from a mid- to long-term perspective.
However, since BTC rose above 29K and then fell below 29K, it is recommended to confirm the trend reversal before proceeding with the purchase.
Otherwise, if you proceed to buy when it is down, this will also increase your psychological anxiety.
In the process of trading, if you focus only on profits without considering your own psychological changes, you will eventually increase the possibility of trading in an erroneous way due to psychological factors.
Therefore, trading to obtain more profits is important, but more importantly, it is important to establish a trading strategy that can minimize the psychological anxiety and burden caused by trading.
(BTC.D chart)
We should think with a focus on the fact that BTC dominance will maintain its upward trend.
The reason is that there is a BTC halving next year.
Therefore, as more people want to trade BTC, it is expected that BTC dominance will rise regardless of BTC price fluctuations.
This uptrend is expected to meet volatility as it rises around 56.78-61.73.
If this volatility turns BTC dominance into a downward trend, it is expected that the coin market will face a period of altcoin pumping cycle.
If that is not the case, and continues to rise, I expect to see volatility again around 70.03.
(USDT.D chart)
It sits near 7.52 as it moves through the May 15-17 volatility period.
Therefore, it is necessary to check whether there is a movement out of the 7.27-7.86 section.
Since the USDT dominus once rose in the 6.85-7.27 zone, the key is whether it can be resisted around 7.86-5.25.
If it does not and rises, it is expected to renew the new high (ATH).
A rise in USDT dominance means a fall in the coin market.
At this time, the important thing is to be careful when trading altcoins as the price destruction of altcoins can be serious according to changes in the BTC price.
-------------------------------------------------- -------------------------------------------
** All descriptions are for reference only and do not guarantee profit or loss in investment.
** Even if you know other people's know-how, it takes a considerable period of time to make it your own.
** This is a chart created with my know-how.
---------------------------------

The meaning of the sequence is...Hello?
Traders, welcome.
If you "Follow", you can always get new information quickly.
Please also click "Boost".
Have a good day.
** Analysis of the BTC chart publishes new ideas once a week.
** However, we publish new ideas when volatility occurs or when we show signs of diverging from our expectations.
** Excluding the above situation, BTC analysis is listed as a daily update.
-------------------------------------
(BTCUSDT.P chart)
(1D chart)
In order for the head and shoulders pattern drawn on the chart to be completed, resistance must be found below 26907.0-27486.4.
If not, it's just an incomplete pattern.
Therefore, it is necessary to check whether it rises along the uptrend line around May 10 (May 9-11) and finds support around 27486.4-27976.1.
It is necessary to check whether the M-Signal of the 1W chart and the M-Signal of the 1W chart can be crossed to make a regular arrangement.
This is because the regular alignment signals of these medium- and long-term indicators present important inflection points where new trends can be formed.
Therefore, if it falls below 26907.0 and completes the head and shoulders pattern, there is a possibility of a sharp drop, but from a mid- to long-term perspective, it is expected that the possibility will increase due to the large buying force.
Therefore, the mid- to long-term transition point is
1st: 24294.1-25882.9
2nd: 20853.8-23129.6
It is expected that a direction change will be made by touching the 1st and 2nd vicinity above.
When such a change in direction takes place, it is expected that the 3rd wave of the Elliott wave will proceed.
This move is expected to provide one last good buy point for the medium and long term.
I kept saying that altcoins are not the time to trade now.
In order to invest in altcoins from a mid- to long-term perspective, you should proceed with the first purchase and wait when the value is less than 29K.
Then, when the BTC price soars and rises to around 43K, the altcoins will show a cyclical upward trend, and the second purchase must be made according to the cyclical upward trend.
If not, investing in altcoins will be applied as an insecure factor that amplifies one's own psychological insecurities.
Then, the full-fledged buying period for altcoins is when they show support around 43K.
When the BTC price rises above 43K, the reason why you should proceed with buying altcoins in earnest is because now is the time to intensively buy BTC or ETH.
------------------------------------------
(BTCKRW chart)
The HA-High indicator on the 1W chart is about to be created at the 37821000 point.
Therefore, it is necessary to make sure that it can rise with support around 37821000.
If it falls below 37243000 and finds resistance, you should check for support around 35539000.
It is important whether the M-Signal of the 1W chart and the M-Signal of the 1M chart can create an orderly arrangement as they intersect, and whether the price can be maintained beyond the range created by the regular arrangement.
This is because these moves come at a critical time for medium and long-term trend reversal.
The next volatility period is around May 15th.
------------------------------
- big picture
A full-fledged uptrend is expected to start when it rises above 29K.
81K-95K is the range we expect to touch in the next bull market.
-------------------------------------------------- -------------------------------------------
** All descriptions are for reference only and do not guarantee profit or loss in investment.
** Even if you know other people's know-how, it takes a considerable period of time to make it your own.
** This is a chart created with my know-how.
---------------------------------

Money flooding the market, but...Hello?
Traders, welcome.
If you "Follow", you can always get new information quickly.
Please also click "Boost".
Have a good day.
-------------------------------------
(USDT chart)
The declared price (ATH) has been updated.
Therefore, more funds are being concentrated in the coin market.
This concentration of funds will eventually increase the coin market.
---------------------------------------------
(USDC chart)
However, the problem is that USDC has no power to start an uptrend due to the outflow of funds.
USDT believes that individual investors' funds and Chinese funds account for a large proportion.
I think USDC is likely to be funds from American institutional investors.
Therefore, I think that the current coin market is being influenced by American capital.
Therefore, it is expected that the coin market will start to rise only when USDC turns upward.
-------------------------------------------------- ---------
(BTC.D chart)
BTC dominance remains bullish.
This decline is starting to show that the Bollinger bands on the 1D chart are contracting.
Therefore, the trend is expected to be determined by whether it finds support or resistance around 47.64.
Since a lot of money is flowing into the coin market through USDT, the coin market is expected to rise.
That uptrend is expected to lead to an uptrend in BTC going forward.
Therefore, BTC dominance is expected to remain bullish.
Rising BTC dominance means funds are concentrated towards BTC, making altcoins more likely to move sideways or trend down.
Therefore, if you currently place a lot of weight on altcoins, you should think about countermeasures.
This phenomenon is expected to continue until BTC nears 43K.
-------------------------------------------------- ---------
(USDT.D chart)
Whether funds flow in or out of the coin market, whether the inflow is concentrated towards BTC or altcoins, what matters now is whether USDT dominance is rising or falling.
USDT is supported by all exchanges in the world and is a stablecoin.
Therefore, USDT trading pairs have a great influence because most coins (tokens) are traded in the market.
In this sense, we believe that the rise and fall of USDT dominance reflects the influence of the overall flow of the coin market.
An increase in USDT dominance means that it is likely to proceed with a decline in the coin market.
Conversely, a drop in USDT dominance means that it is likely to lead to an uptrend in the coin market.
This movement can be useful when trading in the coin market.
The question is whether the volatility between May 15th and 17th can lead to a move out of the 7.27-7.86 zone.
-------------------------------------------------- -------------------
Summarizing the above,
The coin market appears to be on an uptrend.
However, you are not waiting for the starting signal at the starting line.
Therefore, you need to warm up well so that you can make a proper start when you are waiting for the starting signal at the starting line.
A bullish start is the rise of BTC, which will lead the coin market to an uptrend, which will cause most altcoins to move sideways or downtrend.
However, when BTC rises and moves sideways, it is expected that there will be an increase in altcoins, but be careful when trading altcoins because this upward trend is to buy more BTC.
If BTC continues its uptrend, you will naturally look towards altcoins because you think the BTC price is too high.
This mentality leads to buying altcoins, which is likely to result in losses.
This is because it is thought that only the altcoin I bought will not rise.
Therefore, in order to proceed with buying altcoins, you must be able to continue buying over a long period of time.
If not, buying an altcoin now means incurring a potential loss.
Well, if you can buy it and hold it until next year, it will be different.
-------------------------------------------------- -------------------------------------------
** All descriptions are for reference only and do not guarantee profit or loss in investment.
** Even if you know other people's know-how, it takes a considerable period of time to make it your own.
** This is a chart created with my know-how.
---------------------------------

BTC.D H4 :SUCH A WOWWWW Hi Guys Hope you well
Aha first TP reached ..... please check mu last btc.d analysis
SecondChanceCrypto
⏰13/May/23
⛔️(DYOR)
always do your research.
If you have any questions, you can write them in the comments below, and I will answer them.
And please don't forget to support this idea with your likes and comment.

Altcoin Strength Indicates Dominance Will Drop!Traders,
As outlined in this mornings video, altcoins remain relatively strong as compared to Bitcoin. This is a bullish indicator that alts may be gearing up for a bit of a run in the next few weeks/months.
Another chart to keep a close eye on, of course, is our BTC.D (Bitcoin Dominance) chart which is currently showing a bearish Head and Shoulders pattern.
Have this chart on your list for future observation. It is fair to become more aggressive alts once that neckline breaks.
Best,
Stew

BTC.Dominance Elliott Waves AnalysisHello friends.
Please support my work by clicking the LIKE button👍(If you liked). Also i will appreciate for ur activity. Thank you!
Everything on the chart.
Nothing has changed, everything according plan.
Main Target zone: 45.5 - 44.5%
cancellation of scenario - consolidation above 48.9%
Good luck everyone!
Follow me on TRADINGView, if you don't want to miss my next analysis or signals.
It's not financial advice.
Dont Forget, always make your own research before to trade my ideas!
Open to any questions and suggestions.

Everything is going sidewaysHello?
Traders, welcome.
If you "Follow", you can always get new information quickly.
Please also click "Boost".
Have a good day.
-------------------------------------
(BTCUSDT chart)
(1M chart)
It is necessary to check whether it will be supported in the vicinity of the volume profile section 28465.36-28923.63.
Also, you need to hold the price above the MS-Signal indicator to see if the MS-Signal indicator turns into an uptrend sign, because if these conditions are met, an uptrend is expected.
With such an uptrend, we expect the Stoch indicator to be out of the oversold zone.
Since the StochRSI indicator is located in the overbought zone, we can see that the upside is high.
Therefore, we expect the StochRSI indicator to maintain its uptrend until it breaks out of the overbought zone.
-------------------------------------------------- ---
(1W chart)
The question is whether it can rise above the 1st uptrend channel and maintain its uptrend along the 2nd uptrend channel.
So, if the price holds above 26574.53-27590.60, we expect it to rise above 32259.90.
Since the HA-High indicator formed around 27590.60, finding support around 26574.53-27590.60 is significant.
This important implication is that the possibility of breaking the recent high is increasing.
The StochRSI indicator always makes waves.
It is not easy to predict the direction as the current StochRSI indicator has entered the 30-70 section, that is, the sideways section.
However, since the StochRSI indicator is showing a downtrend, we know that the downtrend is likely to continue.
Therefore, if it shows support around 26574.53-27590.60 mentioned above, it is expected that the direction of the StochRSI indicator will change.
Interpretation of the indicator can be useful when checking whether it is supported or resisted at an important point or section on the price chart.
Therefore, as in the interpretation of the StochRSI indicator, it was expected to lead to a large decline as it moved out of the overbought zone, but as it touches around 26574.53-27590.60 and shows an upward trend, it can be seen that the downtrend is weakening.
Therefore, rather than interpreting the indicators mainly, important support and resistance points on the price chart should be used to confirm movement in the interval.
--------------------------------------------------
(1D chart)
The key is whether you can climb with support in the 28465.36-28923.63 section.
This is because it is important that the 28465.36-28923.63 section is supported as a volume profile section.
if it goes down,
1st: 27496.02-27985.15
2nd: 26574.53
You need to make sure that it is supported in the vicinity of the 1st and 2nd order.
The reason is because it is an important support and resistance section in the mid- to long-term.
If supported in this section, there is a possibility that buying will increase as buying is possible in the mid- to long-term.
All indicators (StochRSI, Stoch, RSI, CCI) are positioned in the sideways section.
Therefore, rather than buying in the current range, it is better to wait for a decline around 27496.02-27985.15 or 26574.53 or for a rise above 30184.24 to show support.
This is because there is no need to worry about buying in advance.
Buying in advance because of the price that is not much different and continuing trading while feeling psychological anxiety should be oriented because it can make you unable to hold on when a big movement comes out.
------------------------------
- big picture
A full-fledged uptrend is expected to start when it rises above 29K.
81K-95K is the range we expect to touch in the next bull market.
-------------------------------------------------- -------------------------------------------
** All descriptions are for reference only and do not guarantee profit or loss in investment.
** Even if you know other people's know-how, it takes a considerable period of time to make it your own.
** This is a chart created with my know-how.
---------------------------------

USDT: Funds focused on individuals (groups), USDC: Funds focusedhello?
Traders, welcome.
If you "Follow", you can always get new information quickly.
Please also click "Boost".
Have a good day.
-------------------------------------
(USDT chart)
(USDC chart)
I think that USDT and USDC are used as a channel for the inflow and outflow of funds into the coin market.
Among them, USDT has a high market cap, so I think it has as much influence on the coin market.
Looking at the USDT chart, we can see that it has risen to near the previous high.
Therefore, it can be seen that the coin market is overflowing with funds.
However, if you look at the USDC chart, it has fallen a lot, making it look like the funds flowing into USDT are stagnant.
In other words, it can be interpreted that the money inflow through USDT is trying to lead the coin market to rise, but the outflow of money through USDC limits the rise or makes it fall.
Therefore, I think it is better to buy coins (tokens) that you intend to continue investing in until the BTC halving next year.
Otherwise, if you are going to trade in terms of day trading or short-term trading, I think you need to be very careful.
The inflow of new money is expressed as an increase creating a gap.
Therefore, the size of the candle does not matter.
-------------------------------------------------- ----
(BTC.D chart)
Looking at the BTC dominance chart, it is forming a rising channel.
However, the 1M chart has not yet created an upward channel and is showing an expansion.
Therefore, the possibility of a downtrend at any time still exists.
However, if it does not fall below 46.76-46.84, it is expected that it will lead to a move above 50.49 in the near future.
We believe this move is due to the BTC halving next year.
This is because the possibility that funds that are unable to find a place to go in the coin market will be concentrated toward BTC due to an event called BTC Halving next year is increasing.
However, what BTC dominance tells us is whether funds are concentrated in BTC or altcoins.
Any other interpretation can lead to confusion, so it's best not to think about it.
Concentration of funds towards BTC means that BTC is leading the coin market.
Since there is no guarantee that this lead will necessarily lead to a rise in the coin market, you should check the USDT.D chart to see if the coin market is rising.
-------------------------------------------------- -
(USDT.D chart)
The USDT Dominance Chart is a chart that allows you to see the flow of funds flowing into USDT.
Therefore, when USDT dominance declines, the coin market is likely to show an uptrend.
If USDT dominance is trending down and coins (tokens) with large market caps, such as BTC or ETH, show sideways movements, it is likely that coins (tokens) with lower market caps will pump in the short term. .
If you are not comfortable with day trading or short trading in these markets, we recommend that you do not trade.
Because you may miss a better buying opportunity than this.
USDT dominance is moving sideways in the 6.85-7.27 range.
This means that the direction has not yet been determined.
If you look at the 1M chart, it is in a state where a proper trend line or channel has not been formed.
Looking at the 1W chart, it shows a breakout from the downtrend line, downtrend channel.
Therefore, it can be seen that we have not yet found a direction in the mid- to long-term perspective.
When you can't find a direction like this, I think it's better not to trade or to proceed with a split purchase according to a trading strategy for coins (tokens) that will continue to invest in the mid- to long-term.
The basis for proceeding with the purchase is the movement of the USDT chart mentioned above.
In other words, since a lot of money is flowing into the coin market, it is not strange to see an upward trend at any time.
If you do not take any action when the unit price has risen by 30% or more from the unit price you purchased for mid- to long-term trading, you may end up selling at a lower price level because you keep feeling regretful when the stock fluctuates up and down.
Therefore, you need a strategy to sell a certain portion according to the rate of return or some standard according to your investment style.
This selling strategy is an important strategy because it can lead to a better buying strategy.
-------------------------------------------------- -------------------------------------------
** All descriptions are for reference only and do not guarantee profit or loss in investment.
** Even if you know other people's know-how, it takes a considerable period of time to make it your own.
** This is a chart created with my know-how.
---------------------------------

BTC.D H4 : ALT-SEASON is loading ...Hi guys Hope you well.
The things you can see in the four-hour time frame, you can see the change of structure market . Also, in the daily time, we are at the ceiling of the long-term trading range. Let's see the altcoin market.I expect that altseason is so near. Please see the previous analysis for a better understanding in the previous channel
SecondChanceCrypto
11/May/23
(DYOR)
Always do your research .
If you have any questions, you can write them in the comments below, and I will answer them.
And please dont forget to support this idea with your likes and comments

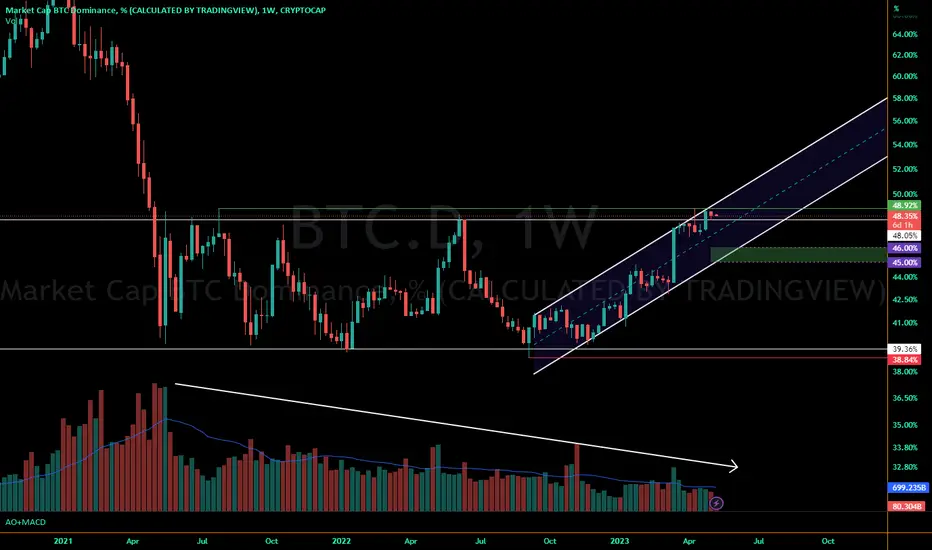
No Breakout Yet, No Massive Drop EitherBitcoin Dominance looks like it wants to head down to 45-46%. Why?
- We're moving up within a parallel channel on the weekly chart here, good chance we'll see the bottom of it again.
- Our highest weekly high did close above the previous one, but with no wick and not as high as our highest wick. Hard to call that a strong breakout
- Volume isn't here yet to bring it higher & MACD looks like it wants to turn down, while AO may cross soon as well
Conclusion:
- No altseason yet (a mini-recovery could occur though, but they could just as well drain more if BTC drops significantly with another dominance drop)
- No dominating bitcoin move yet
BTC.D Possibility of Symmetric TriangleI am on the side where reversal of the dominance will happen at the yellow dashed line or already happening.
BUT,
If we could break out from the yellow dashed line there is possibility of triangle of cyclic degree.
Then we could reach the resistance with the red dashed line without break out.
I've built supposed triangle line with supposed calculation of the dat, but it's just a possibility.
Let's see and keep intouch.

A pattern is what you know when it's completeHello?
Traders, welcome.
If you "Follow", you can always get new information quickly.
Please also click "Boost".
Have a good day.
** Analysis of the BTC chart publishes new ideas once a week.
** However, we publish new ideas when volatility occurs or when we show signs of diverging from our expectations.
** Excluding the above situation, BTC analysis is listed as a daily update.
-------------------------------------
The reason why I explain the USDT, USDC, BTC.D, USDT.D chart first is that it is judged that the price change of coins (tokens) can be predicted to some extent if the overall money flow of the coin market is known.
(USDT chart)
(USDC chart)
(BTC.D 1W chart)
(USDT.D 1D chart)
Still, USDT is maintaining an upward trend, and USDC is maintaining a downward trend.
BTC dominance remains on the uptrend and is expected to eventually rise above 50.
The rise in BTC dominance tells us that money is being concentrated in BTC.
In addition, it is not desirable to expand interpretation of the flow of BTC dominance because it is not helpful at all to proceed with actual transactions.
If you have checked the BTC dominance chart to see whether your current funds are concentrated in BTC or altcoins, you should check how your funds are flowing.
The flow of money can be seen by the movement of the USDT.D chart, i.e. USDT Dominance.
It can be interpreted that the decline in USDT dominance is highly likely to lead to a rise in the coin market.
Conversely, an increase in USDT dominance means that it is highly likely to lead to a decline in the coin market.
If you look at the 1M, 1W, and 1D charts of the USDT.D chart, you can see that they are receiving resistance at certain points and sections.
Therefore, USDT dominance is expected to decline unless it rises above this resistance point or section.
However, if it rises above 7.14-7.27, which corresponds to the resistance zone, and shows support, USDT dominance is expected to surge.
Therefore, it is necessary to check which side of the 6.85-7.27 section shown on the 1D chart is moving away from around May 16th.
-------------------------------------------------- ----
(BTCUSDT.P chart)
The pattern drawn on the 1D chart is a Head and Shoulders pattern.
So, if it falls below 26907.0-27486.4, I would expect a sharp decline.
If this is not the case and the price holds above 27486.4, it is expected to form a new trend.
Therefore, it is expected to rise above 32275.6.
A pattern can only be known when it is complete.
However, if you know in advance what the pattern will look like, you will be able to buy some time to respond.
No matter what pattern you make, the real pattern is after it has been completed, so you should be careful if you react in advance before the pattern is completed, as there is a possibility of double loss.
Therefore, the important thing in trading is split trading.
When the pattern is being completed, it is necessary to partially respond with a split transaction and leave room for the next response whether the pattern is completed or incomplete.
Otherwise, if you sell 100% in advance just because you see a head-and-shoulders pattern, you will feel great psychological anxiety every time the price rises, increasing the possibility of making a wrong decision.
If you sell 100%, it is better to stay away from the market for a while until the next wave begins.
Currently, a dip below 26907.0-27486.4 is required to complete the Head and Shoulders pattern drawn on the 1D chart.
If not, the Head and Shoulders pattern is incomplete.
If we look at the support and resistance sections without considering the pattern,
Section 27486.4-27976.1 is an important support section.
Therefore, if support is confirmed near the 27486.4-27976.1 section, it is possible to buy.
The primary target for this buy is near the 30181.8 point.
The reason is that the HA-High indicator on the 1D chart is formed at 30181.8.
In this way, when creating a trading strategy from a trading perspective or trend perspective, what you need to identify are support and resistance points or zones.
Create a trading strategy for support or resistance at these support and resistance points or zones.
If you proceed with trading according to the trading strategy created in this way, you will be able to escape the influence of your psychological state to some extent.
The biggest stumbling block in trading is your own state of mind.
This is because they believe that the success of trading is determined by the movement of charts and their psychological state caused by various articles and press announcements.
No matter how much the current trend is on the uptrend, if all you see, hear and say is negative, you will be able to trade.
As I said above, it is the flow of money that makes trading possible.
If you can tell whether money is flowing in or out of the investment market, you will have the power to trade according to the flow of that money.
The channel for the inflow and outflow of large funds in the coin market is USDT.
Therefore, if USDT is maintaining an upward trend, the coin market will maintain an upward trend.
Therefore, if the chart of the coin (token) you want to actually trade shows a decline while funds are continuously flowing in, then it is the time to buy.
These buying points can be made according to the support and resistance points.
What I have just said is about the big picture, the overall trading strategy.
How detailed a trading strategy you develop with this will be determined by your own state of mind.
(1h chart)
The description of the 1h chart refers to trading in a short period of time that corresponds to scalping and same-day trading among the above.
In this story, whether BTC goes up or down is not the focus.
Therefore, you should not view and interpret this content with a mid- to long-term perspective.
The interval 24294.1-30181.8 corresponds to the high magnification box interval.
Therefore, when you get out of this section, you can enter a full-fledged position.
------------------------------------------
(BTCKRW chart)
The next volatility period is around May 15th.
------------------------------
- big picture
A full-fledged uptrend is expected to start when it rises above 29K.
This is the 81K-95K range that we expect to touch in the next bull market.
-------------------------------------------------- -------------------------------------------
** All descriptions are for reference only and do not guarantee profit or loss in investment.
** Even if you know other people's know-how, it takes a considerable period of time to make it your own.
** This is a chart created with my know-how.
---------------------------------

Full-fledged uptrend start section: 32259.90-37253.81hello?
Traders, welcome.
If you "Follow", you can always get new information quickly.
Please also click "Boost".
Have a good day.
** Analysis of the BTC chart publishes new ideas once a week.
** However, we publish new ideas when volatility occurs or when we show signs of diverging from our expectations.
** Excluding the above situation, BTC analysis is listed as a daily update.
-------------------------------------
(BTCUSDT chart)
(1M chart)
The key is whether the price can be maintained above the volume profile that is being formed in the 28465.36-28923.63 section.
Therefore, it is necessary to check whether it is sideways in the section 28465.36-37253.81.
The reason to check for sideways movement is that the HA-High indicator is currently located at 43823.59.
As the candlestick for the month of May is created, you need to check if the RSI indicator enters the overbought zone.
Since the RSI indicator is related to creating the HA-High indicator, it is highly likely that the HA-High indicator will move and be created when it enters the overbought zone and then moves out of the overbought zone.
Therefore, you should proceed with the trade thinking that there is wiggle room in the long term.
(1W chart)
The StochRSI indicator is showing signs of breaking out of the overbought zone.
Therefore, when the StochRSI indicator falls below 50, the key is whether it can be supported and rise around 26574.53-27496.02.
At 27496.02, the HA-High indicator on the 1W chart is about to be created.
Therefore, if it is confirmed that it is supported when the 1W chart's HA-High indicator is created at the 27496.02 point, it is expected to rise above 32259.90.
The HA-High indicator means that there is a high probability of making a new high, so you need to think about how to respond to taking profits.
However, if supported by the HA-High indicator, it is highly likely to renew the recent high, so buying is possible, but a short-term response is required.
If it is resisted by the HA-Low indicator and falls, it is highly likely to renew the recent low, so we need to think about countermeasures against stop losses.
However, if it is confirmed that it is supported by the HA-Low indicator, it is possible to buy it, and it is highly likely to rise to the vicinity of the HA-High indicator.
Therefore, you can trade with a longer breath than buying at the HA-High indicator.
In trading, profits vary depending on how you make your psychological state stable.
Therefore, it is better to buy when there is support near the HA-Low indicator, which is likely to renew the recent low, than to buy it near the HA-High indicator, which is likely to renew the recent high.
However, in most cases, you can't buy near the low point and buy near the high point.
I think this is because it has a huge psychological impact.
The 32259.90-37253.81 section is a starting point that is likely to start a full-fledged uptrend from a long-term perspective.
So, if it rises above 37253.81, I expect more uptrend.
However, if it fails to break through upward, it could lead to further declines, so you need to think about countermeasures.
Therefore, around 26574.53 is an important support and resistance zone.
(1D chart)
It is difficult to predict the movement right now, but we can think of what is important about the trend from the mid- to long-term perspective.
However, if you look at the mid- to long-term (1W) and long-term (1M) charts, the movement is concise, so you can get a lot of help in setting the direction.
Therefore, I think that by looking at the 1M and 1W charts and creating a trading strategy in the overall movement and big picture, you can see the low time frame chart and reduce the confusion caused by volatility when trading.
The 1D chart's HA-Low indicator is formed at 27985.15, and the 1D chart's HA-High indicator is formed at 30184.24.
Thus, the section 27985.15-30184.24 can be considered as a sideways section.
Directions outside of these sideways zones are expected to form trends.
However, since several indicators that play an important role are formed over the 26013.28-27496.02 section, it is expected to rise rapidly even if it falls below 27985.15.
If it declines in the month of May, you should check for support near 20050.02-23141.57.
However, as I said above, you should think about how to buy because it is not expected to drop significantly.
If it does rise, it is expected to rise around 35045.0-37253.81.
However, there is still a possibility of shaking up and down, so if you touch the area around 35045.0-37253.81, I think there is a high possibility of a sharp drop.
------------------------------
- big picture
A full-fledged uptrend is expected to start when it rises above 29K.
This is the 81K-95K range that we expect to touch in the next bull market.
-------------------------------------------------- -------------------------------------------
** All descriptions are for reference only and do not guarantee profit or loss in investment.
** Even if you know other people's know-how, it takes a considerable period of time to make it your own.
** This is a chart created with my know-how.
---------------------------------

BTC.D corrective move and subsequent growthHello analysts 🙋
btc.d chart has been inside a prz zone for a long time and seems to have a correction to the middle of the channel and then continue to grow.
What do you think, comment me your opinion 💡🤘

BTC DOMINANCE IS READY TO FLAY ALT COINS HOLDERS BE CAREFUL.BTC Dominance is now ready for upward ride
start shorting your alt-coins for long term
BTC dominance showing some support 41.50 and creating double bottom at these levels at weekly chart so be careful for long term trade
regards
saqibmirza

BTC Dominance ! 1D Review Hello everyone, I invite you to review the current dominance of BTC over the rest of the market. First, we will use the blue lines to mark the sideways trend channel in which we are moving and here you can immediately see that we are in its upper limit, what is more, we are staying above the uptrend line.
Now we will go to check where we have support when BTC starts to lose against the entire market. And here we have the first support at 46.59 %, then the second support at 45.1 %, the third support at 43.9 %, and then the fourth support at 42.7 %. It is worth checking the percentage of BTC dominance, because the lower the value, the more other coins gain.
Looking the other way, in a similar way, using the trend based fib extension tool, we can determine the places of resistance. First we have resistance at 49.2 % which is a very strong resistance and the upper limit of the ongoing sideways channel, when we manage to break it we have second resistance at 50.7 % then third at 52 % and then fourth resistance at 53 %.
Please pay attention to the CHOP index, which indicates that most of the energy has been used, the MACD indicator indicates entering a local downtrend, while the RSI shows a small rebound, but we are still high, which may indicate a deeper correction.

Bitcoin Dominance Elephant/Mammoth in the room The Bitcoin dominance has been doing something seemingly unnatural with the limited information available to us. I find that a lot of people are sleeping on this or just unaware.
First off, this chart is very busy. I don't normally make charts with this many indicators but there is a lot of confliction in the information and I only want to make a single chart of this to follow on. There is are even a few indicators I have deleted for sanities sake.
Secondly, the elephant is that we have basically gone through a bear market in a range with the dominance. What we have known or at least what we think we knew is that in bear markets the dominance of bitcoin goes up. That so far has proven to be false or is it that the bear market isn't over yet? I will explain all of this with my opinion at the bottom with a third option.
THE INDICATORS
On the Monthly chart
50 month MA
CM_Ultimate_MA_MTF
Volume
Down below, from top to bottom
RSI
Vortex (VI)
Traders Dynamic Indicator (TDIGM)
Historical Volatility (HV)
Bitcoin Dominance Oscillator (BTCD_O)
Sentiment Oscillator (ASO)
So, lets start from the top
The CM Ultimate has turned green, the only other time that's happened on this chart has shown an upward dominance move for Bitcoin. The RSI is climbing, the blue vortex has crossed above the pink line that all show a support for this upward dominance move. The sentiment oscillator has closed the gap (Blue vs pink) and looks to make across that would add to the upward move, but, has not crossed as of yet (possibly this month it may).
The conflict or size of the move
The last time dominance went up it was met with very heavy resistance the 50 month MA (yellow line), it finally did break through but did not hold for even one month and broke back down again. This shows us the 50 month is very very strong resistance for now. The question is, will it go above this time around? This is what remains to be seen and what will follow here.
The volatility and traders dynamic could be pointing at small move. We can clearly see the volatility going down as the move is going up. The TDI has been saying a move is coming and has been made but it might already be over, or there is isn't much left in the move. So, it could go to the 50 month and get rejected from there. Why? We can also see the TDI's range is narrowing which coincides with the volatility. Also, along with all this the RSI is showing hidden bearish divergence for 4 years now, that started in 2015, but has it played out fully yet? Again that remains to be seen.
I have zoomed in on the volatility so it can be clearly seen but what is being missed is the giant wedge that it is in. This wedge does eventually end in about 2 years, so it's still aways away.
What I think and what my analysis is.
First off, it's not to be taken as advice.
I think BTC dominance is going up for now. I also think it gets rejected by the 50 month and goes back down for an alt-season and could make a double bottom and hit the lows of 2018 @ 35% or possible even slightly lower for a very short time. It then would go back up substantially.
Keep in mind this could take 2 to 3 years to play out in full or even longer.
The keys in all of this are the 50 month, the Volatility and the volume. We can also see the volume is in a downward trend. A big volume spike could bean early sign of a trend reversal too. Once all this plays out and if the dominance was to go back up the volatility would have to break out of the wedge in a fairly violent way, just as it did when it broke down in 2017/18.
The other option is it just gets more and more stable and less volatile as time goes on and keeps following this trend. I don't think this is likely as a permanent fixture though.
Another hidden key here could be Ethereum. ETH has also closed the gap on BTC during this bear market, so it's another thing I'm looking at and could also be used as an indicator to all this data. I have linked a chart to this analysis in this one called "Is Ethereum going to dethrone the king". Also, I have included is an altcoin lengthening cycles analysis based on XRP.
I do suggest you replicate this chart in multiple ways by breaking down the indicators for cleanliness sake and even adding in the ones I removed listed down bellow.
Removed but still relevant Indicators
Stochastic RSI
Bollinger Bands
MACD
Thank you for looking and please feel free to let me know what you think in the comment section down below.
Stay Blessed
WeAreSat0shi

BTC Dominance is DominatingThe 49% Resistance area for BTC D. has been at play since the summer of 2021 when we first hit that resistance level.
You can see in previous areas BTC D finding resistance was bullish, money flowed into Alts and Total Crypto MC pumped hard. The 3d retrace was marked by a further dip in overall Crypto MC but coincided with a drop in BTC price. Currently since the last time resistance was hit we have seen several alts pop off and BTC find resistance at 30800.
While BTC D was rejected at resistance once more on 12 April, a retrace occured that found support around 47%.
Currently we are bouncing back to the resistance at 49%. BTC Dominance
Over the last 3 days BTC Dominance has been pumping back to resistance.
If it breaks out to the upside, expect ALTS to bleed, would be a good moment to load up on Altcoins.
Hitting Resistance and breaking down to previous levels would likely be bullish for altcoins as long as BTC price either stabilizes (ideal scenario) or pumps along with the alts.
Patiently waiting...

USDT.DOMINANCE UPDATE Hello, welcome to this usdt.dominance update by CRYPTO SANDERS.
CHART ANALYSIS;-USDT.DOMINANCE It got rejected by the horizontal resistance of the rectangular channel. Currently, it is forming above the mid-range, where the MA 100 is also acting as a support.
Now it will break the mid-range from here or after retesting the Ichimoku cloud, and this will be a bullish signal for the market as it moves in the opposite direction.
Hit the like button if you like it and share your charts in the comments section.
Thank you

Volatility above 10% means...hello?
Traders, welcome.
If you "Follow", you can always get new information quickly.
Please also click "Boost".
Have a good day.
** Analysis of the BTC chart publishes new ideas once a week.
** However, we publish new ideas when volatility occurs or when we show signs of diverging from our expectations.
** Excluding the above situation, BTC analysis is listed as a daily update.
-------------------------------------
The reason why I explain the USDT, USDC, BTC.D, USDT.D chart first is that it is judged that the price change of coins (tokens) can be predicted to some extent if the overall money flow of the coin market is known.
(USDT chart)
(USDC chart)
(BTC.D 1W chart)
(USDT.D 1D chart)
Still, USDT is maintaining an upward trend, and USDC is maintaining a downward trend.
BTC dominance will eventually rise above 50.
So, you need to think about countermeasures against it.
The rise in BTC dominance can be interpreted as meaning that funds are concentrated towards BTC, so it is highly likely that the altcoin will enter the second round of buying.
When BTC dominance rises, the overall flow of the coin market will be very different depending on whether USDT dominance rises or falls.
A decrease in USDT dominance increases the likelihood that the coin market will rise.
Therefore, when BTC dominance rises, it is necessary to see how USDT dominance moves.
Again,
- USDT, USDC charts show the size of funds.
- The BTC.D chart shows where funds are concentrated.
- USDT.D chart shows the flow of funds.
I don't think I know anything other than the case above.
Therefore, it is better not to try to interpret it the other way around.
---------------------------------------
(BTCUSDT chart)
(1M chart)
I think the 1M chart is a chart that can be used to check the big picture and long-term perspective.
Currently, BTC is located near the MS-Signal indicator.
At the same time, a volume profile section is formed at the 28465.36 point.
Therefore, the 28465.36-28923.63 section, along with the previous volume profile, is expected to be an important turning point for the long term.
If the price stays above the MS-Signal indicator, it is likely to continue its uptrend.
Therefore, it is necessary to check whether the price is maintained above the MS-Signal indicator until the MS-Signal indicator turns into an uptrend.
However, it is recommended to check the movements of the HA-Low and HA-High indicators in order to proceed with the transaction.
Since the HA-Low indicator is currently located in the 20050.02-23141.57 section, the time to buy has already passed.
However, in order to continue the upward trend from a trading perspective, the price must rise above the HA-High indicator to maintain the price.
Therefore, I think there should be a movement that causes the HA-High indicator to fall and be created.
(I think that is unlikely, but there may be a move upwards above 43823.59 as it continues to rise.)
If the price maintains above the HA-Low indicator, it is time to buy until you see support near the HA-High indicator anyway.
Therefore, it is necessary to consider whether to proceed with a partial purchase when confirming support near the MS-Signal indicator from a trend perspective, or whether to proceed with a purchase when confirming support near the HA-High indicator.
Or, you need to think about whether to proceed with the purchase when you confirm that the MS-Signal, HA-Low, and HA-High indicators are supported by split trading.
(1W chart)
Unlike the 1M chart, the 1W chart is moving around the HA-High indicator.
Also, the HA-Low indicator is creating a fairly long horizontal line.
Making such a long horizontal line means that it is maintaining an uptrend.
So, from a mid- to long-term perspective, it can be seen that it is maintaining an upward trend.
When maintaining an uptrend, if it finds support near the HA-High indicator, it is likely to break the recent highs.
Therefore, if the HA-High indicator is created at 27496.02 this time and it is confirmed to be supported around 27496.02, it is expected to rise above 32259.90.
If the HA-High indicator is created at 27496.02, but it does not receive support and declines, you need to check if it is supported at 26574.53.
A drop below 26574.53 is likely to lead to further declines, so a countermeasure is needed.
A drop below 26574.53 is expected to create a rising HA-Low indicator.
At that time, whether it is supported near the HA-Low indicator will be an important factor.
(1D chart)
There was more than 10% volatility in one day.
When such volatility occurs, what we need to pay close attention to is the flow of funds.
You need to look at whether funds are flowing in or out of the coin market, and in which direction the funds are being utilized.
The movement of funds will be discussed in detail separately, but briefly, the funds flowing into the coin market remain the same, and rather, the funds are continuously flowing.
This inflow of funds will maintain the FOMO status of the coin market, and it is expected that it will show a great uptrend.
The key is whether the price can sustain the move above the MS-Signal indicator on the 1D chart and above 28465.36.
As mentioned before, the MS-Signal indicator is an indicator that informs trends.
Therefore, maintaining the price above the MS-Singal indicator means that there is a high possibility of continuing the uptrend from a trend perspective.
Therefore, it is important whether it is supported in the 28465.36-28923.63 section.
However, since the HA-High indicator on the 1W chart and the HA-Low indicator on the 1D chart form the 24796.02-27985.15 section, if support is confirmed around this section, you can proceed with aggressive buying.
The stop loss for this aggressive long is 26574.53.
Therefore, the purchase period can be largely defined as 3 periods.
1st : 27496.02-27985.15
2nd : 28465.36-28923.63
3rd: Around 30184.24
If it is confirmed that it is supported in the 1st to 3rd sections above, I think it is possible to buy it.
Around 26574.53, the M-Signal indicator on the 1M, 1W chart is passing by.
Therefore, if it does not fall below this range, it is highly likely to maintain an upward trend from a mid- to long-term perspective.
------------------------------------------
(BTCKRW chart)
There was volatility that rocked up and down.
What we need to pay attention to is to check whether it is supported or resisted near the MS-Signal, HA-Low, and HA-High indicators.
Therefore, it is necessary to check whether it is supported or resisted around 36425000, 37243000, 37585000-38093000 and respond accordingly.
The next volatility period is around May 15th.
------------------------------
- big picture
A full-fledged uptrend is expected to start when it rises above 29K.
This is the 81K-95K range that we expect to touch in the next bull market.
-------------------------------------------------- -------------------------------------------
** All descriptions are for reference only and do not guarantee profit or loss in investment.
** Even if you know other people's know-how, it takes a considerable period of time to make it your own.
** This is a chart created with my know-how.
---------------------------------

Pull back patterns are not easy to know before they are completeHello?
Traders, welcome.
If you "Follow", you can always get new information quickly.
Please also click "Boost".
Have a good day.
** Analysis of the BTC chart publishes new ideas once a week.
** However, we publish new ideas when volatility occurs or when we show signs of diverging from our expectations.
** Excluding the above situation, BTC analysis is listed as a daily update.
-------------------------------------
The reason why I explain the USDT, USDC, BTC.D, USDT.D chart first is that it is judged that the price change of coins (tokens) can be predicted to some extent if the overall money flow of the coin market is known.
(USDT chart)
(USDC chart)
(BTC.D chart)
(USDT.D chart)
USDT and USDC are still moving in opposite directions.
As long as funds are showing an inflow through USDT, the coin market is expected to remain on the uptrend.
Even if the global economic situation is not very good, we are traders who can earn profits by trading according to the size and flow of funds in the coin market.
We must not forget that we are not economists or economic analysts after all.
---------------------------------------
(BTCUSDT.P chart)
If the price is maintained above the MS-Signal indicator on the 1M chart, it can be interpreted as a long-term turn to the uptrend.
If the price is maintained above the HA-High indicator on the 1W chart, it can be interpreted that there is a high possibility of renewing the recent high from a mid- to long-term perspective.
So, from a mid- to long-term perspective, we can see that it is likely to remain on the uptrend.
However, since it did not rise above the HA-High indicator on the 1M chart, I think it is time to maintain the price above the HA-High indicator from a long-term perspective.
Therefore, whether the price rises or falls, the current volatility must be dealt with in the short term, as it is expected that the HA-High indicator will fall and create a shape.
In the big picture, BTC below 29K is a buy zone.
This doesn't change.
However, since it rose above 29K and then fell below 29K, it is good to see how it turns.
(1D chart)
If you can see support in the 28454.9-28951.7 section, it's time to buy the week.
If not and it declines, you should check for support near 27486.4-27976.1.
Point 27486.4 is the point where the HA-High indicator of the 1W chart is about to be created, and point 27976.1 is the point where the HA-Low indicator of the 1D chart is about to be created.
Therefore, if we see support around 27486.4-27976.1, we know that it is time to buy aggressively.
If the price stays above the MS-Signal indicator on the 1D chart, it means that it has turned to an uptrend from a short-term perspective, so finding support in the 28454.9-28951.7 section is a very meaningful move.
The MS-Signal indicator provides criteria for identifying movements from a trending perspective.
The HA-Low and HA-High indicators provide criteria for buying and selling from a trading perspective.
How you can interpret these criteria and use them in your own trading strategy will be determined by how much time you invest in checking the movements.
A pull back pattern is one of the manifestations of an uptrend.
It is almost impossible to identify the bottom section of such a pull back pattern.
The reason is that when the price rises above the level where the decline started, it can be confirmed that the pull back pattern has been completed.
Therefore, we need to check whether we can proceed with aggressive buying by identifying support and resistance points.
To say that the current movement is a pull back pattern, we need to see price holding up by at least 28951.7.
(1h chart)
The explanation of the 1h chart is about trading in a short period of time that corresponds to scalping and same-day trading among the above.
In this story, whether BTC goes up or down is not the focus.
Therefore, you should not view and interpret this content with a mid- to long-term perspective.
The 'SHORT' position entered near 'S1', 'S2', 28951.7-29242.2 did not touch the trading end point and is rising.
In the meantime, since I touched the 5EMA and M-Signal indicators on the 1D chart, it is recommended to sell some or close the trade and check the situation.
As I said before, the box section is very wide.
From the 24294.1-25882.9 section to the 28951.7-30181.8 section, a box section is formed.
Therefore, it is considered possible to enter the full-fledged position when it is out of the 24294.1-25882.9 section or 28951.7-30181.8 section.
-------------------------------------------
(BTCKRW chart)
The HA-High indicator on the 1W chart is about to be created at the 36425000 point.
Therefore, if the HA-High indicator of the 1W chart is created at the 36425000 point, it is necessary to check whether it can be supported and rise around 36425000.
Currently, it touches around 36425000 and rises, touching the MS-Signal indicator on the 1D chart.
Therefore, it is important to be able to keep the price above the MS-Signal indicator on the 1D chart by maintaining the price around 37585000.
The HA-Low indicator on the 1D chart is about to be created at point 37243000.
Therefore, the 36425000-37243000 section is a support section, forming a buyable section.
However, the 1D chart's MS-Signal indicator needs to be supported near the 37585000 point passing by, so the uptrend is highly likely to continue, so the main buying section should be made around 37585000.
The next volatility period is around May 15th.
------------------------------
- big picture
A full-fledged uptrend is expected to start when it rises above 29K.
This is the 81K-95K range that we expect to touch in the next bull market.
-------------------------------------------------- -------------------------------------------
** All descriptions are for reference only and do not guarantee profit or loss in investment.
** Even if you know other people's know-how, it takes a considerable period of time to make it your own.
** This is a chart created with my know-how.
---------------------------------
