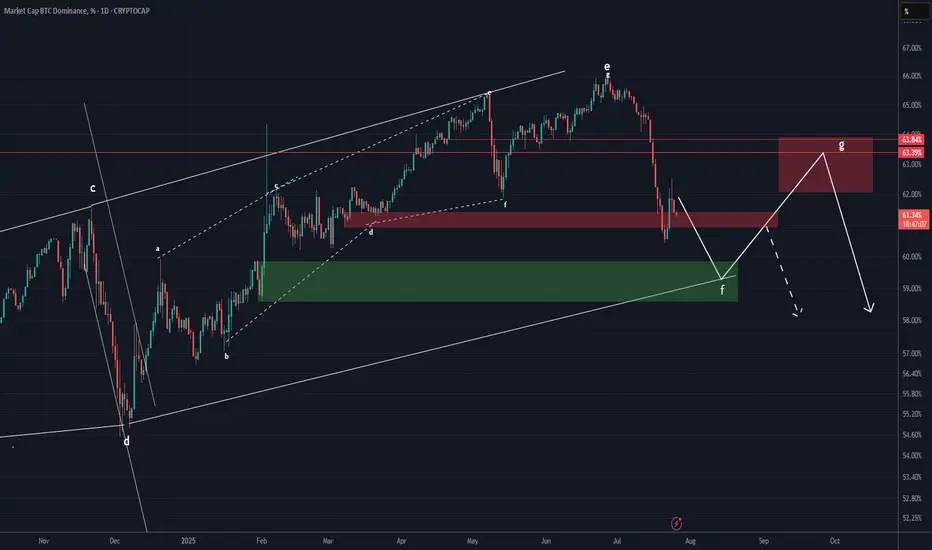
BTC DOMINANCE Update (1D)It seems that Bitcoin dominance may soon experience upward corrections, as it has broken through several support zones to the downside without any reaction and is now close to another support area. Usually, when the market maker pushes the price through multiple supports without a reaction, the price can retrace from a nearby support.
The price may soon move to complete wave G.
We have considered two different scenarios for the fluctuations of this index. However, note that this chart is a derivative chart, and the fluctuations may not follow the schematic exactly, but this analysis gives us a good view of the support and resistance zones and the probable path.
For risk management, please don't forget stop loss and capital management
Comment if you have any questions
Thank You
Btcdominanceanalysis
Dominance & Altcoins- This graph is purely based on fibonacci law.
- 61.8% is the core of the system ( check rectangles in graph to get it )
- Most of long term traders not even look at the price.
- they just wait the good time to buy using Fibo.
- in 2016 BTC was almost 100%. Altcoins were inexistant. (less than 2% of the market with ETH)
- in 2021 BTC Dominance pushed to 75% (altseason followed the push)
- in 2024 we could see BTC dominance knocks 60% ish ( Altseason will follow )
- BTC is maturing.
- Cryptos are growing.
- Don't look too much at your altcoin wallets.
- Most of the time the story repeats itself.
- Respect the cycle, be patient and eat noodles!
Happy Tr4Ding !

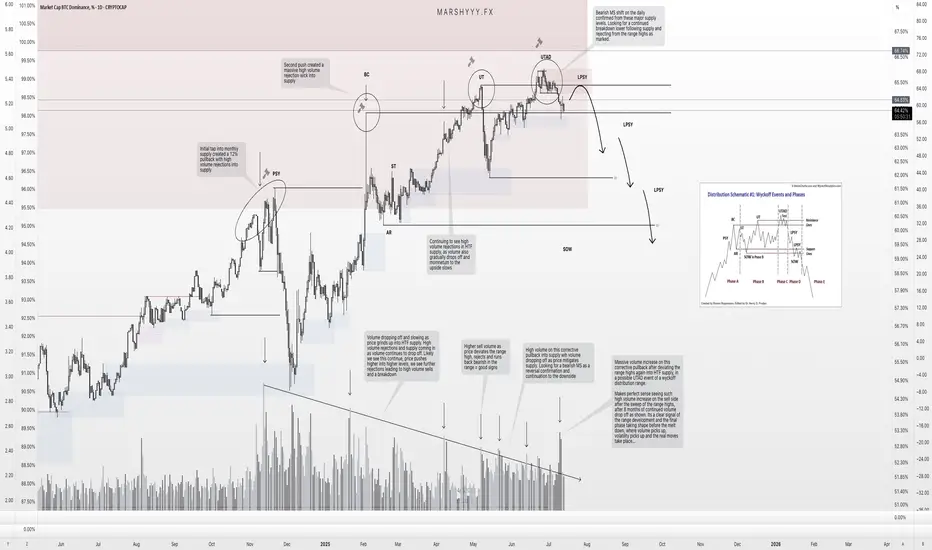
BTC.D – Distribution Confirmed. Is the Final Altseason Next?Over the past couple of months, I’ve been tracking the development of a potential high time frame (HTF) Wyckoff distribution range forming on BTC Dominance (BTC.D), and it’s now looking like that structure is starting to break down.
Back on June 14th, I noted that while we hadn’t confirmed a trend shift yet, BTC.D was showing strength and likely to push into the 65% region, with altcoin weakness to follow. The very next day, I shared my idea of a potential Wyckoff distribution forming — and since then, it’s followed that path almost perfectly.
🧠 What’s Happened Since?
✅ Sweep of the HTF range high at ~65%
✅ Second deviation of the highs
✅ Volume divergence into supply — declining volume + strong rejection candles
✅ Formation of a UTAD (Upthrust After Distribution)
✅ 1D bearish market structure break after the sweep
✅ Price now back inside the range
This is textbook distribution behaviour — even if it doesn’t follow the Wyckoff schematic to the letter, the key elements are present: deviation, volume drop-off, and structural breakdown.
🔮 What Comes Next?
BTC.D is currently holding inside a prior unmitigated daily demand, but given the structural shift, I’m expecting:
A pullback to 65–65.5% (daily supply + range high retest)
Then a continuation bearish, targeting:
🔸 49% (prior accumulation range high)
🔻 46% (FVG fill + range breakout retest)
These lower targets align with where I expect altcoins to top out — so as BTC.D breaks down, I expect capital to rotate hard into ETH and alts, triggering the final phase of altseason before the macro cycle top.
⚠️ Why This Matters
This distribution range has been developing since late 2024, and with BTC.D now showing bearish market structure, combined with:
- ETH.D flipping bullish
- OTHERS.D pushing higher
- Stablecoin dominance pairs breaking down
…we’re seeing confluence across the board for a risk-on altcoin environment.
I believe this is the setup that leads to the final euphoric altcoin rotation before the 4-year cycle top prints later this year.
📌 Watch for the retest. Watch for the rejection. The breakdown will be fast.
This is the window — time to stay sharp.
Let me know in the comments if you’ve been tracking this too, or drop your altcoin rotation picks.
— Marshy 🔥
1D:
3D:
1W:
1M:
BTC Dominance Nearing Major Reversal Zone?Dominance has been grinding higher for months, but it's now walking into heavy resistance, and the structure looks like a rising wedge (not a great sign for bulls).
This setup often ends with a breakdown, which could be the spark altcoins are waiting for.
It’s not confirmed yet, but the chart’s starting to hint at a shift.
Watch closely, big moves usually follow tight squeezes.

BTC.D - Could it be Wyckoff Distribution DevelopingJust toying with ideas of what may be developing here so dont take the chart as what i think will happen perfectly as shown.
With the strength seen from BTC.D atm, it looks more and more likely it may go for the highs again and into the higher levels above 65%.
I still see this as a very large range from the february high and lows that got put in and the prior high was a deviation of the larger range resulting in the reaction we seen.
We could expect to see a further deviation of the range highs and this wouldn't be uncommon in the development of a wyckoff distribution range.
Im still looking for a HTF reversal bearish from these supply levels and my bias doesnt change right now as we continue to develop this range until proven otherwise.
That being said, we could see some further weakness in altcoins until this tops out and gives us the right confirmations of a trend shift bearish.
1D:

BTC.D(based one NEowave)the Z wave of this branch shown as a triangle and I think its finished but for confirmation breaking the 61.9 is important.
its a green light of Altseason.

BTC Dominance New Update (12H)We are truly at a critical point for Bitcoin dominance.
It’s possible that the main drop in Bitcoin dominance has already begun. If the green zone is lost, dominance could experience a deep decline, especially since the final wave of this diametric pattern | wave G | has touched the 0.618 Fibonacci level.
That said, there’s still a chance that the green zone might once again push the price near the previous high before we witness the drop in dominance. However, there are also signs suggesting that the main drop may have already started. Follow the chart closely and monitor it with precision.
For risk management, please don't forget stop loss and capital management
Comment if you have any questions
Thank You

What is Bitcoin Dominance, and When Can We Expect Altseason?What is Bitcoin Dominance, and When Can We Expect Altseason?
✅ In the fast-paced and ever-changing world of digital currencies, traders and investors are continually seeking signs and tools to aid them in making informed decisions. One key sign is Bitcoin Dominance (BTC.D).
Understanding this and examining its chart can provide us with important clues about what the market might do next, especially regarding when Altseason (the period of growth for altcoins) might begin.
CRYPTOCAP:BTC.D
What is Bitcoin Dominance (BTC.D)?
Simply put, Bitcoin Dominance indicates the percentage of the total value of all digital currencies that is held by Bitcoin. For example, if the total value of all digital currencies is $1 trillion and Bitcoin's value is $600 billion, then Bitcoin's Dominance is 60%.
This number is very important because:
It shows market feeling: When Bitcoin Dominance goes up, it usually means money is moving to Bitcoin as a safer option, and people are less willing to take risks. When Bitcoin Dominance goes down, it can mean people are more confident in altcoins and are ready to take more risks for bigger profits.
It shows money flow: Changes in BTC.D show how money is moving between Bitcoin and altcoins.
❓ What is Altseason?
Altseason is a time in the digital currency market when altcoins (digital currencies other than Bitcoin) do much better than Bitcoin, and their prices go up a lot.
During Altseason, money often flows from Bitcoin to altcoins, and many altcoins can see their prices increase many times over.
Looking at the Current Bitcoin Dominance Chart and forecasting Altseason
If we look at the provided chart for Bitcoin Dominance (BTC.D), we can see a few key things:
Long-term upward channel: The chart shows that Bitcoin Dominance has been in a long-term upward path. The bottom of this path is marked by a blue support line , and the top is marked by a red resistance line . This means that, in the bigger picture, Bitcoin's control over the market has been growing.
Broken short-term upward trend: There was a shorter-term upward trend line (shown in black on the image) that the price broke below on May 9th . This break could be an early warning sign that Bitcoin's dominance might be weakening in the short term, and its dominance might start to fall.
⚠️ But here is a very important point:
We cannot be sure that Altseason has definitely started until the price clearly breaks below the main support line of the channel (the blue line) and stays below it.
The break of the short-term upward trend line (black line) is an early signal. However, to confirm a change in the trend and the possible start of a significant Altseason, we need to see stronger support levels, like the blue support line on the chart, get broken.
⏳ So, When Should We Expect Altseason?
Based on the chart analysis and the points mentioned:
Early Sign: The break of the short-term upward trend line (black) on May 9th might make people pay more attention to altcoins, but it's not enough on its own.
Key Condition for Altseason: The most important signal for the start of a real Altseason would be if the Bitcoin Dominance price breaks below the blue support line of the long-term upward channel. As long as Bitcoin Dominance stays above this support line, Bitcoin will likely keep its relative strength in the market, and altcoins might only see limited growth or could even face selling pressure.
Conclusion:
Analyzing Bitcoin Dominance is a useful tool for understanding how the digital currency market works and for predicting possible trends. Right now, because the short-term trend line has been broken, the market is at a sensitive point. However, traders and investors should watch the BTC.D price movements very carefully and wait for stronger confirmations, especially a possible break of the blue support line, before announcing the start of Altseason.

BITCOIN DOMINANCE Update (12H)This analysis is an update of the analysis you see in the "Related publications" section
After hitting the two resistance lines marked on the chart (yellow circle), we saw a reaction, but it doesn’t seem like the trend has changed.
There’s a possibility that a double top could be forming on the dominance chart.
This suggests that selling pressure on altcoins may continue until this index approaches its peak zone.
For risk management, please don't forget stop loss and capital management
Comment if you have any questions
Thank You

BTC DOMINANCE NEW UPDATE (1D)This analysis is an update of the analysis you see in the "Related publications" section
This upward move is in line with our previous plan and is meant to complete wave G.
Wave F didn’t touch the green zone exactly and reversed slightly higher due to market maker manipulations, which has made trading in these areas more difficult.
It is expected that from near the top, the price will drop to complete the larger wave F | which might come with a green and attractive market. Completing wave G, which we are currently in, will likely take several more days.
For risk management, please don't forget stop loss and capital management
Comment if you have any questions
Thank You

BTC Dominance New Update (12H)This analysis is an update of the analysis you see in the "Related publications" section
We had a bullish diametric for Bitcoin, and it seems that the price has reached the highest point of this diametric. Wave E of this diametric, which is a bullish wave, is nearing its end.
We refer to this as the highest point because Wave G might not reach the peak of Wave E.
We expect a rejection from the red box, and this rejection could be very strong. Smaller altcoins could experience a significant pump.
A daily candle closing above the invalidation level would invalidate this analysis.
For risk management, please don't forget stop loss and capital management
Comment if you have any questions
Thank You

BTC Dominance: Approaching Major Resistance!!BTC.D is nearing a major 66%-68% resistance zone within a long-term ascending channel (since 2018). Historically, this area has triggered BTC.D pullbacks, often leading to altcoin rallies. The chart itself anticipates a rejection from this level.
If BTC.D rejects, a move towards the 53-54% lower channel support is likely, potentially bullish for alts. Watch for bearish weekly candle closes and increased selling volume as confirmation. Altcoin price action should also be monitored for signs of strength. This key resistance zone presents a significant point for the broader crypto market. Exercise caution and await.
If you find this analysis helpful, please hit the like button to support my content! Share your thoughts in the comments, and feel free to request any specific chart analysis you’d like to see.
Happy Trading!!

No Altseason Until BTC.D Hits 70%?Bitcoin Dominance (BTC.D) is currently climbing and approaching a major resistance zone between 71.38% and 73.06%. This area has proven to be a strong turning point in the past, acting as a top back in December 2017, September 2019, and again in 2021. These repeated rejections suggest that this zone is likely to remain a key resistance.
Right now, BTC.D is sitting around 64.66% and still has room to push higher. However, if it enters the resistance zone again, there’s a strong chance it may face selling pressure and start reversing. The white arrow on the chart shows the possible move into resistance, while the red projection outlines the expected rejection and potential decline back toward the 54.63% level—another important support zone from the past.
In simple terms, BTC dominance might be nearing its peak, and once it reaches the upper zone, we could start seeing altcoins gain more strength as dominance falls. This chart helps anticipate when the market might shift from BTC-led rallies to altcoin outperformance.

Bad News From Bitcoin Dominance: Pain AheadHello, Skyrexians!
I got sick for these 5 days that's why has not shared updates, but market was very boring so we didn't miss any significant move. CRYPTOCAP:BTC.D concerns me now because to end this trend we need to see any significant correction, but we didn't. On the 12h Awesome oscillator was not able to cross zero line and reversed to the upside, so our main change is that daily time frame measures the wave 3 inside the major impulse.
If we count waves inside this impulse price is approaching 1.61 Fibonacci level at 65.3% and trust me it's much better to see it's reaching before the drop. When this wave will be finished, wave 4 will happen. It can bounce significantly to 61%. This is strong target area and I am sure we will be there soon. Wave 5 can be extended, can be not. The max target is 71%! Sounds awful. The likely target at 66-67%, to make it more precise let's wait for wave 4 finish.
I plan to close in profit those part of trades which has been opened after Feb 3 dump on this potential bounce to have money to add on the last huge shakeout. People believe in altcoins too much, very unlikely to have altseason now. Ready for hate!
Best regards,
Ivan Skyrexio
___________________________________________________________
Please, boost this article and subscribe our page if you like analysis!

BTCDOM at the threshold of a strong impulseA very interesting situation is now observed on such a ticker as BINANCE:BTCDOMUSDT.P - bitcoin dominance index released by Binance. It differs from CRYPTOCAP:BTC.D in that it shows bitcoin dominance to the top 20 altcoins.
On the weekly chart of BINANCE:BTCDOMUSDT.P there is a very old AMEXP model from June 5, 2023, which essentially describes the entire current uptrend on this index. So within this model there was a target value of 100% level (2625.1), which has been a resistance for 112 days and during this time there were 4 attempts to test it.
In case we see a breakout, there may well be a very strong impulse, which will be accompanied by great volatility in the market.
What two scenarios could work at this point?
1️⃣ Index growth will be due to the fact that the top 20 altcoins will stand still/fall on the background of INDEX:BTCUSD growth.
2️⃣ Index growth will be due to the fact that the top-20 altcoins will fall faster than INDEX:BTCUSD will fall.

BTC dominance hinting at one last push?Hello everyone
We all are looking for a way how the BTC dominance can go down to 40% area. If we somehow can predict it correctly then we can make some money in the process.
Here is a (maybe not so) wild idea for medium term.
We are on a weekly chart.
Let's check some facts first:
- Stoch RSI is currently high (near 100).
- RSI is at 68
- Chart is making a new higher high - keep in mind previous dominance high (Feb 3rd) was a result of a flash crash of the market so I am referring to previous high as Nov 18th
So we are witnessing a bearish divergence (RSI making lower highs while chart is making higher highs). Hence drop in BTC dominance should just be a matter of time.
What if the universe aligns and following happens:
We are in economically unstable times. Markets are volatile, politicians are unpredictable so further drop in Crypto space is not impossible. BTC drops less then ALTs, BTC dominance reaches top somewhere between now and 67-68% area. In the meantime traditional markets also crash some more. After that the economic situation stabilises, we get Quantitative Easing and this drives price of ETH up, followed by other ALTs.
For reference: ETHBTC has reached strong support between 0.002300 and 0.001700 Satoshi, RSI is at 24 (same level as Sept 2019 when ETHBTC was at a longterm low).
This scenario would ignite Altseason, bringing BTC dominance down for a reset and start of a new cycle.
There are other bearish scenarios as well, keep that in mind. So trade safe and smart.
I am not predicting any of this, I am not even mentioning any possibilities for this to happen. I am just giving you some food for thought.
Good luck!

#BTC Dominance: This is when ALTS will start Rallying!!BTC Dominance Update by Cryptorphic
🚨 Crossover Alert 🚨
Looking at the current BTC Dominance chart, we can see that the 21 WMA (Blue) and the 50 WMA (Red) are moving almost parallel to each other. A key moment to watch for is when the 21 WMA crosses below the 50 WMA. This will be a strong confirmation of a potential trend reversal.
🔴 Historical Context:
- The previous crossover led to a significant drop in BTC dominance, triggering altcoins to rally.
- The current market structure shows BTC dominance at a crucial resistance level. We are looking for a possible rejection at this level, which could signal an entry point for altcoins.
📈 Price Action:
- BTC Dominance is currently testing the upper boundary of the rising channel.
- A rejection around 64.25% to 65.66% is expected, and the best entry for altcoins would likely come on that rejection.
🚀 Next Move:
Keep an eye on the crossover between the 21 WMA and 50 WMA for confirmation. A downward crossover will likely signify the start of a broader altcoin rally.
If you like this update, please support it with your likes and share your feedback/requests in the comments section.
Thank you
#PEACE

Bitcoin Dominance Says That Bear Market Is Almost Over For Alts!Hello, Skyrexians!
We hope you enjoy our yesterday Bitcoin analysis which is now playing out. Daily candle closed great, but this reversal is still unconfirmed. So, we are still in danger. Today we will take a look at the CRYPTOCAP:BTC.D again, this chart is annoying, but is finally approaching its reversal point.
Let's take a look at the weekly time frame. Here we can see the 3 red dots on the Bullish/Bearish Reversal Bar Indicator . Now we will try to learn now to ignore the false signals. The first dot formed on the very weak bar with no angulation with Alligator. We can's use this. The next bar was great, but it was just the wave 3. The best signal is the last one. We have angulation, bearish divergence with AO and the potential wave 5. This reversal has been confirmed.
Expect the reversal from the current percent because price is inside the Fibonacci 0.61, or in the worst case earlier mentioned 66%. This is going to be wave 5 in 5.
Best regards,
Skyrexio Team
___________________________________________________________
Please, boost this article and subscribe our page if you like analysis!

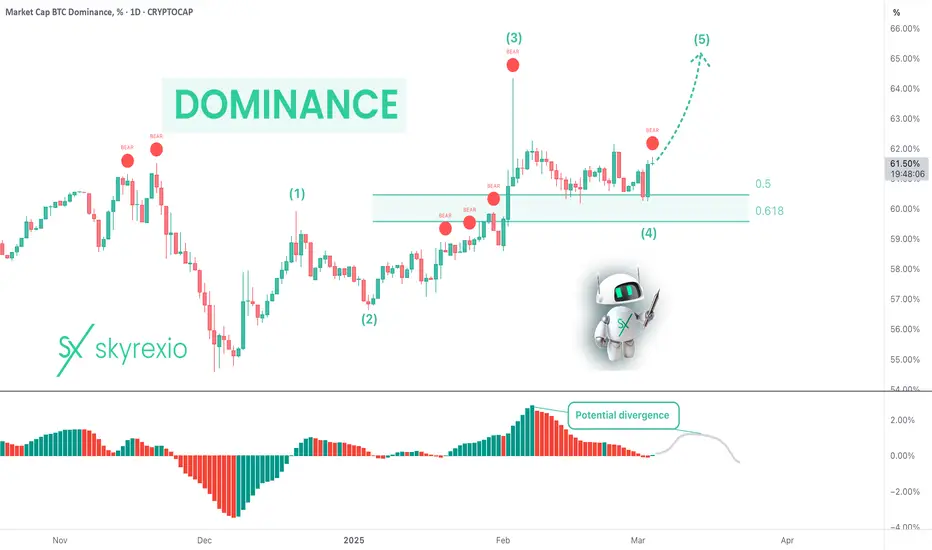
66% Is Actual Again For Bitcoin Dominance Hello, Skyrexians!
Sad news, pump on Sunday was a huge fake. If you remember our last CRYPTOCAP:BTC.D analysis we pointed out that if we will see 60% breakdown there is. great chance to see altseason right now. But Dominance started to grow again and finally we have no doubts that shakeout will happen.
Let's take a look at the daily time frame. Here we can see the clearest Elliott waves structure. Wave 3 has the max AO as usual, and wave 4 was a flat correction which found support at 0.5 Fibonacci. Now we can see that final wave 5 to the 66% target. Don't pay attention to the red dots on Bullish/Bearish Reversal Bar Indicator , they are not important inside the range and can be counted a signal only at the potential end of wave 5 in conjunction with the divergence.
Best regards,
Skyrexio Team
___________________________________________________________
Please, boost this article and subscribe our page if you like analysis!
Weekly BTC.D expectation ahead! Hi fellow traders, BTC.D will be completing a weekly corrective pattern in the upcoming weeks resulting in a move higher on various Altcoins. After the the structure is complete it will continue higher towards the blue box area. Good luck and trade safe!

BTC.D Testing Confluence Zone: Will It Break Below?BTC dominance (BTC.D) is currently trading at a critical confluence zone, where the support of a rising channel intersects with a horizontal support level.
Many investors are closely watching this area for clarity on the next directional move. If the marked red zone (area of confluence) is broken, we could witness another leg of altseason as BTC.D trends lower.
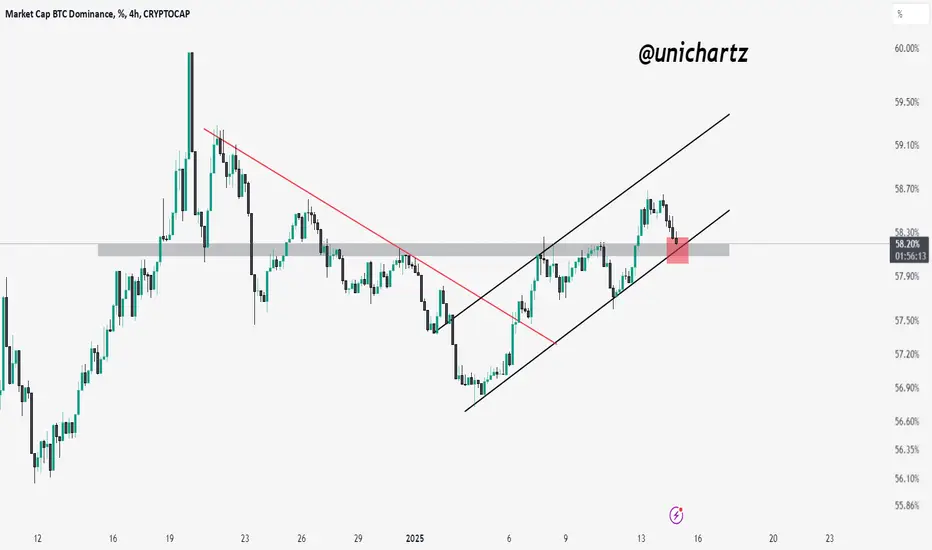
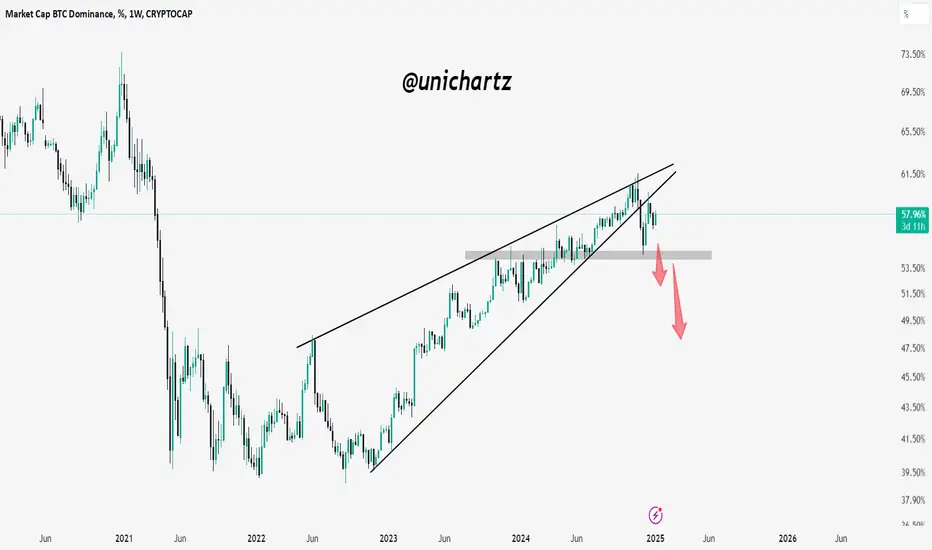
BTC Dominance Breakdown: Altcoins Poised for a Rally?BTC dominance has broken below a rising wedge and is retesting the 57.80% resistance.
If rejected, dominance could drop to 53.50% or 50.00%, signaling potential capital flow into altcoins.
BTC.D Chart: A Bullish Signal for Altcoin HoldersRight now, I can't find a better example of a rising wedge breakdown and retest on the weekly timeframe than on the BTC dominance chart. This is incredibly promising for anyone holding altcoins
Six months to glory for our alts !!
ETHBTC to the moon in Q1
