BTC DOMINANCE UPDATE!!Hi guys, This is CryptoMojo, One of the most active trading view authors and fastest-growing communities.
Do consider following me for the latest updates and Long /Short calls on almost every exchange.
I post short mid and long-term trade setups too.
Let’s get to the chart!
I have tried my best to bring the best possible outcome in this chart, Do not consider it as FINANCIAL ADVICE.
#BTC DOMINANCE short and simple UPDATE
USDTDOMINANCE is forming this bearish flag pattern currently it is at the upper resistance of this accusation channel we expect a rejection from there up to lower support or then if it breaks the lower support with confirmation then we can expect a drop up to 3.62.
Here we may Bounce from here up to the upper resistance of this rising which pattern then we can accept rejection from there.
Let's see how the daily candle closes
This chart is likely to help you in making better trade decisions if it did consider upvoting this chart.
Would also love to know your charts and views in the comment section.
Thank you
Btcdominancechart

#BTC Dominance Understand this level if you are holding ALTS!Reasons to Follow me?
*9 Years in Trading!
*7 years in Crypto
*Certified Technical Analyst
*Record Holder of Most liked Bitcoin Chart on Tradingview.
*Consistent updates on Markets and Trade Setups
*No Bias
*All-time Top Author on various assets and index charts globally.
*Very Active Community during both bull and Bear Market
ALT/BTC Pairs are likely to have some pullbacks.
Breakout and retest in LTF. But if you zoom out, the index is hitting the 200D MA.
Break above this level could result in more downside in Altcoins.
Less likely but possible.
For those who are trading with margin in BTC Pairs.
Be careful, even a -15% move could kill your position.
It's important to preserve what you have.
So 42.40% is the key level you must watch out for now.
We are witnessing an extended period in these ALT cycles.
A lot of new developments in the charts.
Conclusion:- Break above the 200MA will be bad for BTC Pairs, 2-3 Rejection candles and the index could go down from here.
Let me know your thoughts in the comment section.
Your likes are highly appreciated.
Thank you

#BTC.DOMINANCE 6HOUR UPDATE BY CRYPTOSANDERS Hello, welcome to this BTC.D chart update by CRYPTOSANDERS.
I have tried my best to bring the best possible outcome to this chart.
Show some support do hit the like button, follow and comment in the comment section. this motivates me to bring this kind of chart analysis on regular basis.
CHART ANALYSIS :
As we can see in the above-mentioned chart that BTC.D is trading inside the triangle pattern on a support level after a rejection from the red resistance zone, whenever BTC.D rejects from the red resistance zone it moves down towards the lower support zone which is 39.40%.
Here I am expecting that BTC.D will brake the green support and move down to the White ray support area which is 39.40%.
Sorry for my English it is not my native language.
Do hit the like button if you like it and share your charts in the comments section.
THANK YOU...

BTC Dominance is a big support, lets fall further!watch for BTC dominance move up
a bit and come back to the downside.
Do not freak out, this does not mean the
price will crash...it just means that some
of the money will come out of BTC and
be moved into the Alt-coin market...which
will make the Alt coins scream bullishWhen Bitcoin Dominance
gets to 39%-31% thats when
ALT coins will absolutely RIP!

BTC DOMINANCE SHORTER TF UPDATE!!Hi guys, This is CryptoMojo, One of the most active trading view authors and fastest-growing communities.
Do consider following me for the latest updates and Long /Short calls on almost every exchange.
I post short mid and long-term trade setups too.
Let’s get to the chart!
I have tried my best to bring the best possible outcome in this chart, Do not consider it as FINANCIAL ADVICE.
BTC DOMINANCE UPDATE
CURRENTLY, BTC DOMINANCE IS MAKING THIS BEARISH FLAG PATTERN BUT IT IS NOT CONFIRMED YET IF IT BREAK THIS LOWER SUPPORT WITH CONFIRMATION THEN WE CAN EXPECT A DROP UP TO4035% LEVEL.
Let's see how the daily candle closes.
This chart is likely to help you in making better trade decisions if it did consider upvoting this chart.
Would also love to know your charts and views in the comment section.
Thank you

#BTC.DOMINAMNCE DAILY UPDATE BY CRYPTOSANDRES Welcome to this BTC .DOMINANCE analysis in the chart
I have tried my best to bring the best possible outcome in this chart.
Hello members welcome to BTC.D 1DAY update by CRYPTOSANDERS
In the above mentioned chart we can see that BTC.D dominance is trading inside the Chanel pattern and rejected from the yellow MA In daily chart.
So just line the previous two moves inside the channel so here we are expecting that BTC DOMINANCE can fall all the way to the lower trend line. Which will be the bull trend for btc.
This is not a piece of financial advice.
Sorry for my English it is not my native language.
Do hit the like button if you like it and share your charts in the comments section.
thank you.

#BTC Dominance is Bearish! Massive ALT SEASON will trigger soon.Although I have been calling for an Alt season for the last 4 weeks.
A massive rally looks imminent in Altcoins.
Below are the reasons we can see an Altseason trigger:-
1. Close below 21 MA confirmed
2. close below 50 MA confirmed
3. Possible bearish Crossover below 21 MA below the 50 MA.
4. BTC Dominance got rejected from the red resistance zone.
5. Multiple indicators show signs of bearishness in this chart.
Invalidation:- Dominance staying above the 200 MA is a problem. Dominance must break below it to confirm the trend.
The lower target for Dominance is around
Let me know your thoughts.
Thank you
#PEACE

#BTC.DOMINANCE 4HOUR UPDATE BY CRYPTOSANDERS Welcome to this BTC.DOMINANCE analysis in the chart
I have tried my best to bring the best possible outcome in this chart.
Hello members, welcome to BTC.D 4 hour update by CRYPTOSANDERS.
If you have gone through with our yesterday's BTC.D 3 day chart then you will remember, in that chart we mentioned that BTC.D is looking bearish in long term.
In the current scenario, in 4hr chart, BTC.D is currently trading inside the falling channel pattern.
As we told in our last update that we can take a position in ALTCOINS in btc pair this chart is confirming in the shorter time frame that we will be able to earn some good profit in long run.
If BTC.D broke the upper trend line then this chart will be invalidated.
This is not a piece of financial advice.
Sorry for my English it is not my native language.
Do hit the like button if you like it and share your charts in the comments section.
thank you.

BTC.D chart from a different perspective / Plan HI think the technical chart is like a galaxy, and the easier it is to look at it from a distance.

#BTCDOMINANCE 3DAY UPDATE BY CRYPTOSANDERS Welcome to this quick BTCDOMINANCE analysis.
I have tried my best to bring the best possible outcome in this chart.
Hello members, welcome to our BTC.D 3-day update
As we can see here that BTC.D is on a support of yellow MA, inside a falling wedge pattern.
If BTC.D rejects from yellow MA then that will be the confirmation that BTC.D can come down to 39% mark.
If it moves as we expect then we will see an uptrend in ALTCOINS until BTC.D changes its movement direction.
Sorry for my English it is not my native language.
Do hit the like button if you like it and share your charts in the comments section.
THANK YOU...

BTC DOMINANCE 4 HOURS UPDATE Hi guys, This is CryptoMojo, One of the most active trading view authors and fastest-growing communities.
Do consider following me for the latest updates and Long /Short calls on almost every exchange.
I post short mid and long-term trade setups too.
Let’s get to the chart!
I have tried my best to bring the best possible outcome in this chart, Do not consider it as an
Bitcoin dominance is breaking down from the ascending triangle in the 4 hours frame and looks bearish . Also, it breaks below the 21D ma which is also a good sign for Altcoins.
The Green dotted line shown in the charts indicates the support level . I'm expecting the Bitcoin dominance to reach the 40 levels again and we might see a good Altcoin season in the 2nd quarter of 2022.
IMO it's best to accumulate some good Altcoins, especially in BTC pair on spot. Soon I'll share some good Altcoins in BTC pair.
This chart is likely to help you in making better trade decisions, if it did do consider upvoting this chart.
Would also love to know your charts and views in the comment section.
Thank you

#BTC.DOMINANCE 4HOUR UPDATE BY CRYPTOSANDERS Hello members, welcome to the BTCDOMINANC Quick update by CRYPTOSANDERS.
I have tried my best to bring the best possible outcome in this chart.
In the current scenario, BTC.D broke the Chanel downside and retested the lower trend line.
We are expecting here that we will see some downfall which means that BTC will form some green candle because as we know that BTC and BTC.D both work inversely proportional.
Sorry for my English it is not my native language.
Do hit the like button if you like it and share your charts in the comments section.
THANK YOU...

#BTC Dominance Decisive time coming by 31st March, Here's why!Welcome to this brief Analysis of Bitcoin Dominance.
Reasons to Follow me?
*9 Years in Trading!
*7 years in Crypto
*Certified Technical Analyst
*Record Holder of Most liked Bitcoin Chart on Tradingview.
*Consistent updates on Markets and Trade Setups
*No Bias
*All-time Top Author on various assets and index charts globally.
*Very Active Community during both bull and Bear Market
Let's get to the chart!
Bitcoin Dominance is getting rejected at the local resistance but does not take it as a confirmation for a possible alt season.
ALTS are still bearish IMHO. We can buy way cheaper but later. It pumped almost 4.18% since my last post and I expect more growth in Dominance for the next few weeks. Possibly till the end of this month.
When it hits the resistance, that will be the actual time to know whether the index will break or get rejected.
Currently, it's almost reaching the resistance better wait for the right time.
If you follow me you already saved a lot of your funds which was possibly stuck in many altcoins.
INVALIDATION: A daily close followed by a confirmation candle below the 21DMA and 50DMA will invalidate this chart.
What do you think?
Do let me know and hit the like button.
Thank you
#PEACE

#BTC Dominance following the path! Part IIWelcome to this extensive analysis BTC Dominance.
If you are reading my updates for the first time, make sure you follow me if you want the most complex charts
Explained in the most simplified manner.
I also post margin and futures trade setups.
Now, let’s get to the chart.
BTC Dominance is following the previous chart so far.
Although there's some initial rejection at the red zone. A break above that red zone is likely which will take us to 45.5% range.
A rejection at that point could result in fireworks across the btc pair altcoins.
For now expect some more bloodbath in Altcoins till dominance reaches the legacy trendline resistance which will eventually give us some good buying opportunities.
We will asses our strategy to enter altcoins when we reach there.
It's better to wait for now.
Invalidation:- Daily close below the blue MA.
What do you think of this chart?
Do share your views in the comment section and do not forget to hit the like button.
Thank you
#PEACE

Will bitcoin dominate 2022!?Guys, before i start this analysis I believe BTC.D is a LONG in the short term till it hits about 45% as that is the resistance of the downtrend channel that is visible. I'm guessing it will happen in about a month. Anyways, this chart shows that a bearish divergance is getting created on the weekly timeframe. Right now it kinda got created but its very small and not visible yet. Once BTC.D reached 45%, the bearish divergance will be huge and visible and that will cause it to dip and A BIG ALTSEASON IS WILL BE TRIGGERED TO START!!! Look at my ADA/USDT and ADA/BTC analysis to see why I am accumilating ADA for the altseason and DYOR. I am not giving financial advise this is just my ideas of ADA being ready to prove all the haters wrong of it having become "trash". DYOR DYOR DYOR!

#BTC Dominance ALT SEASON in Q2 Possible? Here's Why!Welcome to this extensive analysis of Bitcoin Dominance
If you are reading my updates for the first time, make sure you follow me if you want the most complex charts
Explained in the most simplified manner.
I also post margin and futures trade setups.
Now, let’s get to the chart.
BTC Dominance bounced and pumped almost 4% since the last chart.
Expected this growth and asked you not to go long on BTC pairs.
Hope you listened.
The charts show potential for more growth in BTC Dominance.
Once we hit the legacy trendline resistance, a rejection will cause rallies across the market in BTC pair altcoins.
This is why I expect a nice second quarter, especially for Altcoins.
CONCLUSION:- Bitcoin Dominance should rise to almost 45.50% We will see later whether it breaks the long-term resistance or gets rejected from there. It's early to come to a solid conclusion. Close above that level means BTC will hit new ATH and Alts go cheaper.
Invalidation:- A close below 50D MA will invalidate this chart.
What do you think of this chart?
Do share your views in the comment section and do not forget to hit the like button.
Thank you
#PEACE

BTC.DOMINANCE 1HOUR UPDATE BY CRYPTOSANDERSWelcome to this quick BTC .D analysis.
I have tried my best to bring the best possible outcome in this chart.
BTC.DOMINANCE is the You all know the reason for the sudden loss of BTC, because of which people are selling every coin due to which BTC dominance is mounting and BTC dominance I think the bad rejection of 43.45% is a force
Sorry for my English it is not my native language.
Do hit the like button if you like it and share your charts in the comments section.

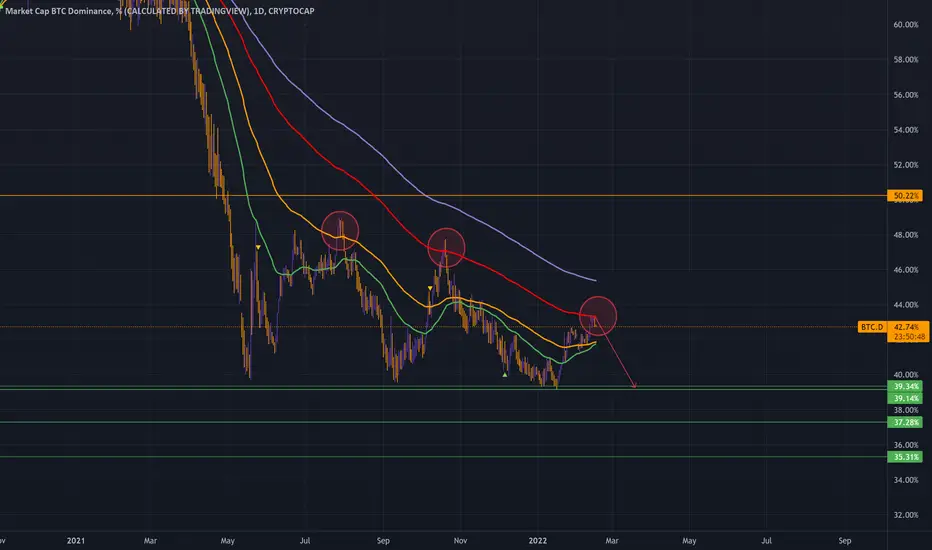
BTC.DOMINANCE 1HOUR UPDATE BY CRYPTOSANDERSWelcome to this quick BTC .D analysis.
I have tried my best to bring the best possible outcome in this chart.
BTC.DOMINANCE is the You all know the reason for the sudden loss of BTC, because of which people are selling every coin due to which BTC dominance is mounting and BTC dominance I think the bad rejection of 42.74% is a force
Sorry for my English it is not my native language.
Do hit the like button if you like it and share your charts in the comments section.

#BTC Dominance ALT SEASON POSSIBILITY EXPLAINED!!
Welcome to this extensive analysis of BTC Dominance.
If you are reading my updates for the first time, make sure you follow me to read the most complex charts
Explained in the most simplified manner.
I also post margin and futures trade setups.
Now, let’s get to the chart.
BTC Dominance bounced right from the bottom of the channel around 39.15.
Currently moving around 42.27 level and broke above the blue MA.
The chart is pointing towards a possible rally towards 45.49 in the next 2 to 4 weeks.
This will eventually give some momentum to BTC against altcoins.
ALTS in BTC pairs are likely to continue some decline for the next few weeks unless it hits the legacy trend line resistance which is almost
300 days old. So once the index reaches that resistance level a rejection would lead to a 3 months rally in Altcoins in BTC pairs. So we need to wait for a few weeks to see
whether it breaks the resistance or gets a strong rejection.
CONCLUSION:- Alts will continue to bleed till dominance reaches 45.49 level. Once that level is reached I will update the next chart.
We will have to see whether it gets rejected or breaks the trend line.
Invalidation:- Close below the Blue MA.
What do you think of this chart?
Do share your views in the comment section and do not forget to hit the like button.
Thank you
#PEACE

BTC.DOMINANCE 4HOUR UPDATE BY CRYPTOSANDERSWelcome to this quick BTC .D analysis.
I have tried my best to bring the best possible outcome in this chart.
BTC.DOMINANCE is the downtrend
and BTC pairs trade start.
Sorry for my English it is not my native language.
Do hit the like button if you like it and share your charts in the comments section.

DominanceFast update.
- Rejected on EMA200 D1.
- Follow BTCDOM is important to detect and understand next altcoins pump.
Happy Tr4Ding!
BTC DOMINANCE CHARTBtc domonance now consolidation within a bearish rising wedge and creating continuously bearish divergence. We will see breakdown soon.

Bitcoin Dominance: 1W Chart ReviewHello friends, today you can review the technical analysis idea on a 1W linear scale chart for the Bitcoin Dominance.
The chart is self-explanatory. The Bitcoin Dominance recently broke out of the S/R 1 line and headed for a re-test. If the re-test is successful and the price moves upwards, the Bitcoin Dominance will start moving up. I noted multiple Support and Resistance Lines to keep an eye on. The RSI also broke out of a resistance line headed up. Lastly, a Triple Bottom was recently formed which is bullish. This is a weekly chart so please be patient.
Included in the chart: Trend line, Support and Resistance Lines, RSI, Triple Bottom Formation.
If you enjoy my ideas, feel free to like it and drop in a comment. I love reading your comments below.
Disclosure: This is just my opinion and not any type of financial advice. I enjoy charting and discussing technical analysis. Don't trade based on my advice. Do your own research! #cryptopickk
