BITCOIN They have the trend of bitcoin since 2018. Big rises, big numbers. Also the blue dotted line marks the last ups and downs.
Being the recent rise of: 115,63% in 110 days
Being the recent drop of: 34,17% in 36 days
Big Numbers.
All the best. Sincerely L.E.D.
In Spain on 12/15/21
Btceth

CIX (CRYPTO INDEX CAPITAL LONG) BTC XRP ETH and morePeople love using BTCUSD and ETHUSD to chart but I personally use CIX which is a crypto index by capital.com it makes crypto markets very very easy to see trends and breakouts with, this is my current idea and why I think we could hit new all-time highs by Q1-Q2 2022.
Please leave a like and comment and let me know what you think.


BTCUSDT , We are impacted to the M support zone Good Evening guys
In here according to our last analysis, we shown 2 zone that the price can react to them , and exactly happend and now we are near minor support area, if the price can not support in here and break this support area below we can have stop hunter the order and liquadation and then we are ready to go up and first tp is 60K than 75k - 85k .
For each of this scenario we should have plan to know what to do ? (if you need any consulting or help send us messages)
Previous analysis :
Good Luck
Abtin

BTC @ critical support 2₿ITCOIN approaching important support @ 47250-46600 (market structure + 50% fib retracement). We could see a bounce followed by sideways price action. Then breaking up the red downtrendline would be bullish. On the other hand, breaking down the 46600 support could lead to further price drop to the bottom around 42k. Staying neutral, just observing... 🧐
Check my other stuff in related ideas.
Please like👍, comment🗣️, follow me✒️, enjoy📺!
⚠️Disclaimer: I'm not financial advisor. This is not a financial advice. Do your own due dilingence.

BTC Supply and Demand AreasJust tracking supply and demand and revealing my current opinions on what the extremes are. IMO $20-34k BTC might actually happen unfortunately, but I'd say that's 15% likely.. Another scenario 20% likely: a big short squeeze to bring us to 60-70k; and 65% likely: we range between 40k - 60k for a long time

BTCUSD way to go as predicted in earlier post btc successfully hit all 60% of the targets at 42k.
now btc is hovering around 48k but you should expect another drop coming days.

LONG ETHBTC: POS vs POW TAKEOVEReth showing lower volatility takeover
POS vs POW
btc is worthlesss dinosaur tech.

Technical analysis update: BTCUSD (26th November 2021)Today BTCUSD reached 55 000 USD in tandem with our expectations expressed in the previous 2 posts. Currently, it trades around 54 600 USD per coin. We continue to be bearish on Bitcoin as technical analysis continues to support this thesis. We think current weakness in the global markets will be persistent in the short-term. Additionally, we think that this weakness will be contagious to cryptocurrency markets and it will create headwinds for further rise in cryptocurrencies (in the short-term horizon). We think BTCUSD will continue lower and we expect it to test short-term support at 52 956 USD in the following days.
Our recent popular post from 16th November 2021:
Here we started to speculate about possible double top formation. We also expressed that volume was declining while price continued to climb higher. We noted that this pointed to evaporation of buyers at higher levels of prices. In our opinion, this foreshadowed subsequent drop in price (combined with other warning signs).
Technical analysis - daily time frame
RSI, MACD and Stochastic continue to evolve their bearish structure. DM+ and DM- show also bearish conditions. ADX exhibits growth which suggests that the bearish trend is strengthening. In general, a bearish time frame is extremely bearish.
Technical analysis - weekly time frame
Divergence in RSI is clearly observable. This is a very bearish development. MACD is in the bullish area, however, it is flattening (and reversing to the downside). Similarly, Stochastic also started to point into bearish direction. ADX is very low which suggests the bullish trend of higher degree has lost its steam already. Overall, the weekly time frame is bearish.
Divergence in RSI on weekly time frame:
Divergence in MACD on weekly time frame:
Technical note
Synchronization in the bearish conditions between daily and weekly time frames suggests mounting trouble ahead for BTCUSD. We think BTCUSD is headed way lower and it will drag the rest of cryptocurrencies with it. We think investors should be very cautious in the following weeks.
Fundamental note
Hawkish narrative by the FED, additionally, supports bearish views for the cryptocurrency market. We think that decrease in quantitative easing combined with increase in interest rates will be detrimental to cryptocurrencies as purchasing power of the dollar will be rising. Further, we think prevailing irrationallity in the cryptocurrency markets (especially among lay and retail traders) combined with calls for extremely high prices such as BTC at 200k USD, 500k USD, etc., only shows how inflated this market is (at the moment).
Support and resistance
Major resistance level sits at all time high of 69 000 USD. Below that is Resistance 2 which sits at 64 895 USD (previous top). Resistance 1 appears even lower at 59 603 USD. Short-term support is at 52 956 USD. Then below that is Support 1 at 48 834 USD and Support 2 at 39 573 USD. Major support level lies at 28 600 USD (2021 low).
DISCLAIMER: This analysis is not intended to encourage any buying or selling of any particular securities. Furthermore, it should not serve as basis for taking any trade action by individual investor. Your own due dilligence is highly advised before entering trade.

BTC Stochastic RSI Looking BetterIt looks like the Stochastic RSI is demonstrating that Bitcoin is leaving the "over bought" territory and moving back towards a healthy range for DCA back into a suitable position. I'm still waiting for the RSI to dip towards the lower "over sold" territory to make entry.

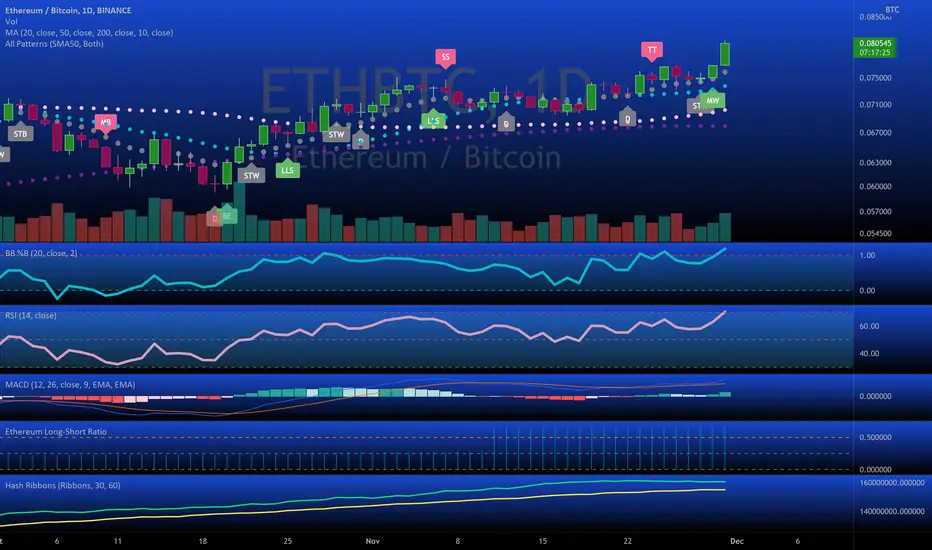
ETH to continue outperforming BTCBitcoin has been slumping pretty hard against ethereum which is a big positive for the altcoin market and the fall might just be starting, everything on BTC/ETH is looking very bearish. We have broken down below 2 pretty heavy downtrend support lines and looking at our current price action it is looking like we will see a daily close below both of these levels which would be a bearish sign for bitcoin but a great sign for ETH and the alts. we have support slightly below our current spot, the S1 & S2 support levels are holding up as of right now but a little more of push to the downside will definitely break these levels. Looking at the bollinger bands we are on our second daily candle where we are riding that bottom band and this plays into the reason i think this drop could just be starting, it is not uncommon when riding the bottom band for the dip to go on for multiple days. For our daily close its looking like we will close once again on that bottom band which is likely to continue dragging BTC down. The MACD recently had a flat period where our histogram bars weren't moving a whole lot, but the past couple days have been looking good, 2 increased red bars which is what we want to see and want too continue. The MA's are just starting to see some big separation increasing the bearish momentum and making it more and more difficult to get a bullish cross in the near term. Not financial advice just my opinion!

ETHBTC is Bearish trust meETHBTC is Bearish trust me. Shorting here with ratio 2:1, everything's on charts :)

ETHBTC Breaking outPotential breakout of ETHBTC price. A break above 0.8 could lead to a fundamental shift in BTC dominance.
The move to ETH 2.0 is another fundamental shirt toward ETH dominance.
I am personally overweight ETH for now.
Going to be an interesting close to the year!
Boom!
TheRaggy

ETH-BTC TRADEETH-BTC seems to be forming a nice high probability trade setup here. Very rarely does this pattern not break to the upside.

Technical analysis update: BTCUSD (16th November 2021)BTCUSD continues to move sideways within rectangle formation as bullish trend is losing momentum and becoming neutral. Bitcoin currently trades around 60 900 USD pricetag; and we are currently bearish on BTC as technical analysis on daily time frame supports this thesis. We expect eventual breakout below the neutral zone. Additionally, we expect such occurence to be accompanied by further selling pressure and possible beginning of bearish trend. If bearish breakout occurs then we expect price to test 55 000 USD.
Volume decreases as BTC continues to move sideways - which suggests that new buyers are increrasingly harder to find.
Technical analysis - daily time frame
MACD, Stochastic and RSI are all bearish. ADX contains low value which suggests neutral trend. However, we expect bearish breakout from neutral zone and resumption of selling pressure.
Technical analysis - weekly time frame
RSI is just slightly below overbought zone and it manifests sideways movement. Inability to pierce through 70 points might suggests that bullish trend peaked already. However, MACD and Stochastic still remain bullish. ADX suggests very weak trend which coincides with daily time frame.
We would like to note it is possible that double top is forming in BTCUSD. Because of that we think investors should be very cautious.
Support and resistance
Major resistance sits at 69 000 USD. Resistance 1 lies at 64 895 USD while Support 1 lies at 59 603 USD. Support 2 sits at 52 956 USD and Support 3 appears at 42 900 USD. Then Support 4 sits at 39 573 USD. Major support level can be found at 28 600 USD.
Disclaimer: This analysis is not intended to encourage any buying or selling of any particular securities. Furthermore, it should not serve as basis for taking any trade action by individual investor. Your own due dilligence is highly advised before entering trade.

$ETHWe have similar scenario for ETH too. Price to fill the sell orders at the imbalance zone and hut the buy side liquidity.
Let's see how this plays out.

SHIB DISTRIBUTING INTO BITCOIN FOR DECADES TO COMEhere is a lovely Pair that is going to demonstrate the financial tool SHIB represents for those top wallets...
it will be distributing into BTC for Eternity.
don't get shibbed u gais!!!!!

BTCUSDT NEXT MOVE (4h chart)Bitcoin (market) is in correction of last bullish weeks ( zoom in-out for more details) , next target of this correction is around 61400 at there we will see a slow market and when we reach there i will update this analysis.
im sorry if i dont explain too much about my charts im personally think that market is not complicated and simplicity is everything, i see so much charts that are so messy or so much if this or that happend... im only draw one scenario. if its go wrong i will accept it and i will try to be better next time .
Take care of your money finnacial markets are ruthless . See ya
GodBless

UPDATE ✅BTC 100K💥We are now testing the 'Bullish Support'/Bullish Trend Line.
Anything below this line it will be a bad for long positions. At 30k we have a strong support.

ReTest Finished. Target 72000-80.000Hedge Fund Manager Long Position ok.
We renewed our positions.
I wish you good luck. Believe in lofty goals, but be careful.
It is not investment advice.
Patience and attention are the most important processes in this business. Selling for free is against our nature.
Our post Retest target has been updated to 100,800.
0.5x
1x
2x
long position ok.
Stoploss -55700
Long Target = 69000$- 72000$ Bitcoin
bitcoin will continue to trend sideways
will continue to record records with altcoins.
Our Main Goal should be to collect bitcoin and ethereum.
this will start the rise of retest altcoins.
I wish everyone good luck. Don't forget to buy stop-loss and tp.
As a result of this rise will come a great fall.
Our retest levels are 42100$-48000$-52000$-56000$.
we have nothing to do with awns. If bad news doesn't come, we'll sail straight to $72000. Of course, we will proceed according to the 4-hour and 12-hour charts. Our joint decision with all fund managers is long.
The next drop will not be a retest. We will see a very steep decline. then we will move up towards $80,000. We're starting off with a $20,000 drop. Let's follow the news.

BTC pullbacklets ready to pump again . super pullback by king bitcoin . we are all waiting to see 80.000$

BTCUSDT - LongTerm Analysiss $84k Hi Traders & Investors
In financial markets price movements always repeat them selfs
its kinda foot prints of big financial companies and simply; huge money flow
if you take a closer look at major movements of btc price you probably notice those big major legs( black arrows )
for now i think after the correction that we have ahead of us another big price movement start and i think around 54k is the start of the next major move and around 84k will be the end of that movement .
also the fibo extension of the last major move (1.272) shows us $91k is target of the next leg .
what you guys think? are you agree with accuracy of major movements ? Im personally believe in them and i think they are so accurate.
GodBless
