btc bull with proofas you can see , if btc form a head and shoulder patter then we will have huge breakout above . but we are using the patter formation to get profit . thats why we taking the position from very dip .
Btceth

btc is going down ?if you look 4h chart . it is good but not good . in my opinion 60% it will go down, 40% is will go up .

BTCUSDT "Next Move "btc is in correcting phase to 0.618 fibo and 0.5 fibo ( visible in chart ) after that bullrun to 70-80k start
be careful stay away from leverage , bless

ETH 4000 solid base for take off to $7000, past $4200Some solid support being tested at 4000, ETH is a little lazy at 4200 but will some sat will help it get going a bit. Bullish trendlines. ETH is getting burned by any joe wanting to be a validator (low energy) for ETH2 needs to stalk 32 ETHs. As Ethereum V2 goes from testing to mainet, ETH will become scarce in supply as more shops will want have built in ETH validation and that requires 32 ETH to get setup.
Lay back, enjoy the sub $4200s Once this runs, better to be on board that on the sidelines. Don't stand to close to the launch pad as this Internet Money and distributed finance (DeFi) takes off.

Canada's Largest Crypto Exchange bottomed at 65 cents USD????Just the charts.... Strong bottom at 65 cents on this penny stock stinker. BIGG should get uplisted to the big boards in Canada and in the US.
I get a kick of finding small but very fast growing companies that sneak into the US via the OTC to then explode on the market via an uplilsting. Canada, it's also common to list on penny stock exchange CSE and uplist to the TSX.
The charts are typically penny stock junk. The sooner they can move into the safer zones. It should be a leveraged Bitcoin play but they need to start bragging more about user growth. And stop silly thinks have having minimum XRP wallets! DUMB Marketing, they give you $10 free to open an account, convert to XRP and it's a dead wallet!
XRP is nasty. So glad Layer 2 is coming to Bitcoin and Ether! Bye bye bad coinmasters!

ETH/BTC breaking downWith bitcoin ready to break all time highs, the eth/btc pair has lost the 200 ema and losing range support. Looking for a breakdown

btc forming cup and candle patternas we know btc breaked the small time high . so pushing for 60k . but this bull run will break the all time high . cup and candle is strong pattern .
so those who follow me will know , we are already bullish from 42k .

BTC/USDT 4HOUR UPDATE Welcom to this quick btc/usdt analysis.
I have tried my best to bring the best possible outcome in this chart .
btc is accumuulation zoon and btc support 47.2k, and resistsnce 48k, and 49.3k$
Let,s see how the 4 hour closes.
i thing the price cam pump fore here .
if the breaks below the price 47.2k$.
the chart will becouse inalid.
Thank you...

Technical analysis update: BTCUSD (1st October 2021)Overnight BTCUSD jumped 10% up leaving many investors perplexed. We noted in our previous idea that we changed our stance to neutral. We think if price fails to break above resistance near 49 000 USD then downtrend will resume. In our opinion this area is very attractive for short re-entry if one took profits on a way down. But we think such position should be accompanied with tight stops due to rising volatility in BTC. Our stance is neutral (to bearish if resistance manages to hold further rise of price).
Technical analysis
On daily time frame RSI and Stochastic reversed to the upside. MACD is striving to turn bullish as well. ADX is declining with suggests that prevailing trend is losing momentum.
However, hourly time frame is in extremely overbought condition. Because of that we are very sceptical of overnight rise.
Support and resistance
We are closely watching mentioned 49 000 USD price level as short-term resistance appears slightly below it. Next resistance sits around 53 000 USD and 60 000 USD respectively. Then major resistance sits at all time high near 65 000 USD. We also watch short-term support near 39 500 USD. Another support below that appears close to 37 500 USD.
BTC1! (Bitcoin continuous futures)
We also observe gap visible in the futures market as we think of it as important level. Breakout to the downside from this area would suggest that downtrend resumed.
Disclaimer: This analysis is not intended to encourage any buying or selling of any particular securities. Furthermore, it should not serve as basis for taking any trade action by individual investor. Your own due dilligence is highly advised before entering trade.

Long Bitcoin #BITCOINInverted Hammer on HTF, signals potential reversal - would prefer a longer wick but doesn't look bad - could be bait also but willing to take chances. If this plays out as a fakeout eventually leading to breakdown then I still hold my previous low to be true (34260 but double check on my previous chart). Reversal confirmed on reclaim of hammer high which is the pink line on chart. God speed and may the Hopium be with you.

btc next posible movethis chart is mainky to show my resistance and next possib le btc move and use can see 50ema is acting as resistance

BTCUSDT "Next Move "hi there
buttom is 42300(daily) , here is buttom , RSI shows buyers have the upper hands
price up movement to 48500 will be sharp !
target is roof of the channel around 50k when price reach there i will update it
this is not a signal use your own plan
dont forget to NOT using more than 3x leverage and also dont forget to USING STOPLOSS !

BTCUSDT "Next Move "if price reject from here and cant break and test 47777 we go for Fibo 618 ( 38500 ) and i think movement is about to be sharp so be carefull with your orders !
never forget to put a stopploss in your order
peace

BTCUSDT "Next Move "i think price is in a three drive pattern , after that price go up , also RSI show the buyers have the upper hand.
50k is the mid term of this movement target .
any way this is not a signal this is just a strategy use your own plan
and as always dont forget the mighty STOPLOSS !

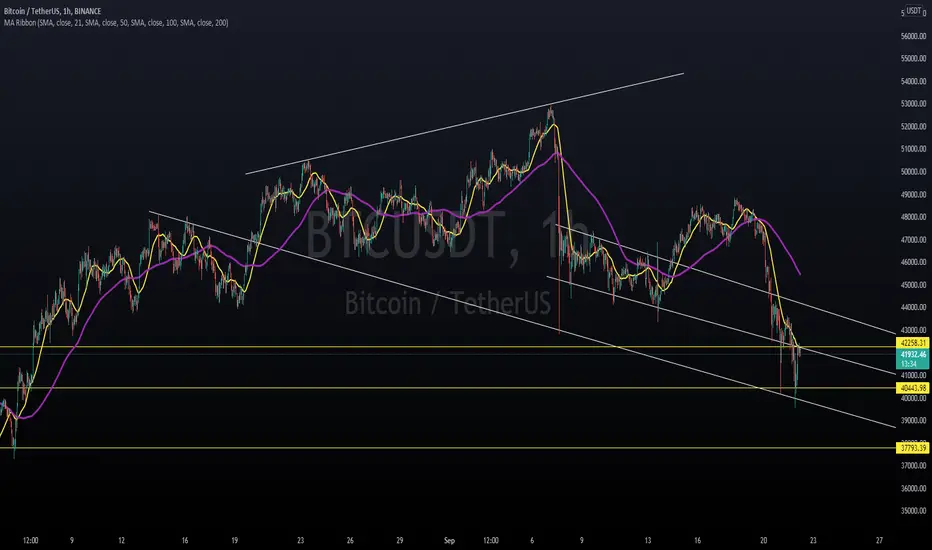
btc/usdt 1hor analiysisBtc/usdt 1hour update
BTC is still under pressure as every moves by the bulls are getting rejected. In our last post, BTC was struggling to keep up with the $42600 support but it dropped further down till $39600.
From that level, we saw a quick bounce and currently BTC is yet again struggling to break the $42250 resistance level.
Will BTC bounce back from here or is it just a temporary bounce to break further down?
Well, until and unless BTC breaks above the 21 MA and interrupt the falling pattern, we cannot call it to be bullish.
Thank you ...
Btc/usdt 4hour update Btc usdt 4hour analiysis.
BTC failed to hold and close above the $47k which lead the price back to the $44k to $47k channel. Currently, BTC is struggling to hold the price at $42600.If it cannot hold this level thenstrong support followed by $40100
Thank you...

Btc/usdt 4hour analiysis Btc/usdt 4hour update
Bitcoin Update:- The previous chart got invalidated since we broke below the channel.
In the current chart BTC is retesting the channel it formed way back since 65k.
Things are still uncertain.
Reason why I warned you all to stay away from leveraging.
Expect few more candles around this channel followed by a bounce into the green zone.
Thank you...

I think the bitcoin movement will be like thisIn this situation, it is better to have more cash capital than investment and reduce the risk....

Btc 4 hour analiysis BTC/USDT 4hour analiysis
Price retracing from $48K resistance. Now keep an eye on 46700$-46800$ level . Good support at this area, and we may see a possible bounce from there!
Happy trading...
Thank you...

BTCUSDT watch out for Buy Signalyou can use this as a buy signal
w8 for break out and then correction leg and after a green candle shows up is your turn to place a order above that green candle and stoploss ( most important thing in the market ) is little under that correction ( swing )
be carefull!

Btc/usdt 4 hour analiysisBTC 4 hour analysis BTC trend line support BTC bullish expanding triangle BTC this area is bounce and confirm BTC price hit 46000 dollar and target 49k$ to 50k$.
Happy trading...
Thank you...

Btc/usdtBTC 4 hour analysis bullish expanding triangle. We said BTC 1 day analyses golden crossover to be confirm .
Happy trading...
Thank you...

btc/usdBTC support 45000$ 1 day BTC analysis 50-day moving average crossing 200-day moving average will be BTC golden crossover
