btcusd bitcoin short or long bear market, that is the questionEvery time the moving average 50 (yellow) and 100 (blue) on weekly fallen, bitcoin went into bear market touching MA 200 (red).
Let's hope it is 2-3 short bear market otherwise it go delay up to one year before the recovery.
I think we will have #omicron #covid pandemic dip next two weeks to 24 000 with a short recovery like in 2020 March.
BTCEUR


BTC- Could not be much clearer to me - just need volume now!Hi folks!
So, I was right about my last post (see linked), so let us see if the buy signal is real!
Just posting what I see as a very clear technical buy signal if you consider BTCUSD in isolation of the general market:
- Testing massive trendline since last year.
- Retesting broken bearish trendline.
- Massive bullish div on the 1D
- Money Flow index will post buy signal any moment.
I believe the 41k-40k is worth a punt (given that the stock market doesn´t collapse today though), and it seems we will get a test of the 40k level (exactly in the cross) very shortly.
DYOR.
NFA.
I wish you all well! :)

BTC/EUR fiber retraction by 0.5if and when the BTC goes to 0.5 (28896 EUR) of retraction in fibo
it will be the beginning of a new cycle of crypto bull markets
and out of curiosity it is in the middle of two supports
34k/24K(EUR)
Pitchfork + Fibo Retraction + Supports
today these are the values but the story changes as new candles form

BTCUSD - Current Trends and Chart Patterns Hello,
We're still on the yellow trend for already 8 months, if we stay above then the chances for us to hit 85000 USD - 110 000 USD are very high.
Please take care because bitcoin can reach even 26 000 in a correct movement if breaks below the yellow/blue support line.
Note that some altcoins are still underwater.
Take care of your investments,
This is not a trading advice,
St.Gex

Technical analysis update: BTCUSD (18th December 2021)We continue to maintain a bearish view on Bitcoin as it continues to trade below the neutral zone. Since Bitcoin's rebound from its recent low at 41 967.50 USD on 4th December 2021 Bitcoin continues to make lower troughs and lower peaks which is indicative of the bearish trend. We expect an eventual retest of 41 967.50 USD price level and possible continuation of the bearish trend. We think that higher interest rates in the U.S. combined with constriction of money supply present a substantial threat to further rise of BTCUSD in the short-term and medium-term. Because of that we would like to set a short-term price target for BTCUSD to 42 500 USD.
Illustration 1.01
Picture above shows the hourly chart of BTCUSD. It also shows particular troughs and peaks.
Technical analysis - daily time frame
So far RSI failed to cross below 30 points; however, its structure remains bearish. Stochastic is also bearish. MACD is bearish too; DM+ and DM- show bearish conditions. ADX contains high value; and it continues to grow which suggests that the prevailing trend is either getting very strong or it nears its peak. Overall, the daily time frame is bearish.
Technical analysis - weekly time frame
RSI, Stochastic and MACD continue to develop bearish structures. DM+ and DM- are also bearish. ADX contains relatively low value which suggests that trend of higher degree is weak. In general, the weekly time frame is bearish which coincides with bearish daily time frame.
Illustration 1.02
We think that drop in price below recent low would result in extremely bearish conditions for BTCUSD.
Support and resistance
Major support level is at 28 600 USD while major resistance level is at 69 000 USD. Short-term resistance is at 48 834 USD while medium-term resistance lies at 52 956 USD. Between these two price levels lies the neutral zone. Other resistance levels appear at 59 564 USD and then at 64 895 USD. Other support levels can be found at 42 900 USD and at 37 573 USD. Additionally, support level can be also found at recent low of 41 967 USD.
Our bold predictions from the past:
16th November 2021
Here we predicted double top formation and subsequent meltdown in price.
26th November 2021
Here we layed out case for even more bearish scenario for BTCUSD.
DISCLAIMER: This analysis is not intended to encourage any buying or selling of any particular securities. Furthermore, it should not serve as basis for taking any trade action by individual investor. Your own due dilligence is highly advised before entering trade.

Technical analysis update: Bitcoin (30th December 2021)Recently a bullish breakout from the pattern resembling falling wedge occurred. However, price halted its rise at 52 098 USD; then price retracted back below the lower bound of the neutral zone. This lower bound continues to gain importance as bearish breakouts and retracements continue to occur along it. We will observe price action near this price level and we will watch out whether price manages to rise back above it or continue its decline. At the moment, we continue to maintain a bearish notion on BTCUSD. We still expect an eventual retest of 41 967 USD price level. Our short-term price target of 42 500 USD for BTCUSD remains in place.
Illustration 1.01
Illustration 1.01 shows the hourly chart of BTCUSD. It also shows a pattern resembling a falling wedge. Additionally, this chart exhibits bullish breakout followed by exhaustion and bearish retracement in price.
Technical analysis - daily time frame
RSI halted its rise slightly above 50 points. After that it reversed its direction to the downside which is bearish. Stochastic also reversed back to the downside and turned bearish. MACD started to flatten and its histogram started to decline. ADX still contains relatively high value but it continues to gradually decline. However, it is possible that ADX may go for a second lower peak (lower than one which was reached on 20th December 2021), especially if selling pressure returns. DM+ and DM- continue to show bearish conditions. Overall, the daily time frame exhibits bearish conditions for BTCUSD.
Illustration 1.02
Illustration 1.03 shows the hourly chart of BTCUSD. It also indicates a series of bearish breakouts below the neutral zone.
Technical analysis - weekly time frame
RSI, MACD and Stochastic continue to develop bearish medium-term structures. Additionally, DM+ and DM- show bearish conditions in the market. However, ADX contains a relatively low value which suggests that the prevailing trend remains neutral. Because of that BTCUSD allows for two possible trade setups with long position being taken above the Resistance 2 (with stop-loss below it) and short position being taken below the Resistance 1 (with stop-loss above it).
Illustration 1.03
Illustration 1.03 shows the daily chart of BTCUSD. It also indicates values at some of the recent peaks in BTCUSD.
Support and resistance
Major support level is at 28 600 USD; major resistance level is at 69 000 USD. Short-term resistance (Resistance 1) is at 48 834 USD, while medium-term resistance (Resistance 2) lies at 52 956 USD. Between these two price levels lies the neutral zone. BTCUSD enters bearish conditions below it and bullish conditions above it. Other resistance levels appear at 59 564 USD and at 64 895 USD. Other support levels can be found at 42 900 USD and at 37 573 USD. Additionally, support level can be also found at recent low of 41 967 USD.
Illustration 1.04
In our opinion if BTCUSD breaks below the recent low at 41 967 USD then conditions will dramatically worsen for Bitcoin. However, we are open to reasses our bearish view if price manages to hold within the neutral zone and then break out above it.
DISCLAIMER: This analysis is not intended to encourage any buying or selling of any particular securities. Furthermore, it should not serve as basis for taking any trade action by individual investor. Your own due dilligence is highly advised before entering trade.

BTCUSD (Long)BTC Is currently bouncing from the macro trendline and a long position will be a good entry from here. a stop loss just below the trendline will be fine. This is possibly a good R:R Zone. The stock markets reclaimed ATHs and i expect BTC To at least have a good relief pump. Trade safe and Happy trading.

BTCEUR bullish divergenceDear Friends, on 15-min chart we can see bullish divergence both on RSI and MACD. Therefore the market is telling us the price is more likely to bounce higher temporarily than it is to go further down. Therefore with 2:1 risk & reward ratio we can make a profitable trade.
buy at 42200€
stop at 41400€
profit target at 44000€
r & r 2:1

I AM STILL BULLISH !, CHECK MY OLD ANALYSISi am still bullish, check my old analysis if you like dear
if BTC goes below these lines, then the bear market will eventually start
but i don't see the end of bull market
my prediction for bitcoin before %100 were accurate
you have to know there is no gurantee in market
so please take care and be safe

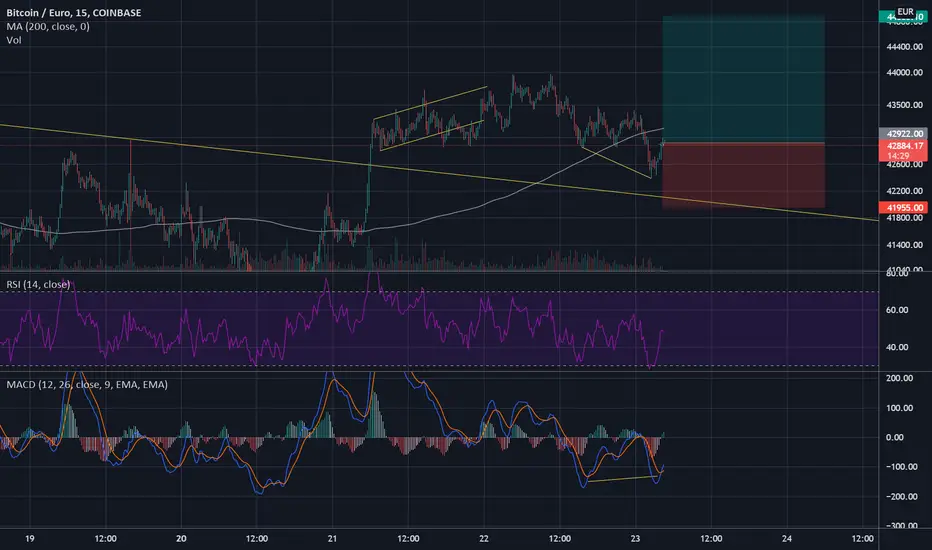
BTCEUR MACD bullish divergenceDear Friends, MACD shows bullish divergence on 15-min chart.
buy at 42900
stop loss at 41955
profit target at 44800
risk & reward ratio 2:1
Wyckoff accumulationPattern Wyckoff acumulation
PS—preliminary support, where substantial buying begins to provide pronounced support after a prolonged down-move. Volume increases and price spread widens, signaling that the down-move may be approaching its end.
SC—selling climax, the point at which widening spread and selling pressure usually climaxes, as heavy or panicky selling by the public is being absorbed by larger professional interests at or near a bottom. Often price will close well off the low in a SC, reflecting the buying by these large interests.
AR—automatic rally, which occurs because intense selling pressure has greatly diminished. A wave of buying easily pushes prices up; this is further fueled by short covering. The high of this rally will help define the upper boundary of an accumulation TR.
"…all the fluctuations in the market and in all the various stocks should be studied as if they were the result of one man’s operations. Let us call him the Composite Man, who, in theory, sits behind the scenes and manipulates the stocks to your disadvantage if you do not understand the game as he plays it; and to your great profit if you do understand it."
(The Richard D. Wyckoff Course in Stock Market Science and Technique, section 9, p. 1-2)

Technical analysis update: BTCUSD (13th December 2021)Our current setup on BTCUSD offers two alternative scenarios (with confirmation coming on a bearish/bullish breakout). Today, another bearish breakout below 48 834 USD support level took place. We continue to maintain bearish stance on BTCUSD as technical and fundamental factors point to more downside in the cryptocurrency market. We expect eventual retest of the support level at recent low of 41 967.50 USD. Additionally, we think investors should be very cautious as the FOMC is coming up this week. We expect a hawkish response by the FED (due to very high inflation) which will most likely come in form of a decrease in the QE program combined with hawkish talk about future rate hikes (in 2022 and 2023). Such monetary policies pose medium-term/long-term threat to further rise in price of BTCUSD (due to money supply being constricted).
For us to reconsider our bearish view - BTCUSD would have to retrace back above 48 834 USD (into neutral zone) and then break above the short-term resistance (at 52 956.47 USD).
Chart below depicts the hourly chart of BTC USD.
Series of false (bearish) breakouts from the neutral zone are illustrated along with the current breakout.
Technical analysis - daily time frame
False reversal occured in RSI (after which it turned back to the downside). This is bearish. Additionally, Stochastic and MACD are also bearish. DM+ and DM- show bearish conditions. ADX grew quickly recently; it currently cointains high value which suggests that either correction might be near its peak or bearish trend is getting extremely strong. We think latter is more probably since weekly time frame shows very bearish conditions as well.
Illustration below depicts the daily graph of BTCUSD and volume.
Volume decreased as selling pressure cooled off. We will observe volume closely in the following days as we think substantial drop in BTCUSD would be accompanied by presence of high volume.
Chart below depicts the daily graph of RSI:
Fake reversal is depicted on the chart. We will observe RSI and we will watch out for crossover below 30 points. We expect such phenomenon to be acompanied by heavy selling pressure.
Technical analysis - weekly time frame
MACD, Stochastic and RSI exhibit bearish conditions. They continue to develop bearish structures. Overall, weekly time frame is bearish.
Support and resistance
Major support level is at 28 600 USD while major resistance level is at 69 000 USD. Immediate support/resistance sits at 48 834 USD while short-term resistance lies at 52 956 USD. Between these two price levels lies the neutral zone. Other resistance levels appear at 59 564 USD and at 64 895 USD. Other support levels can be found at 42 900 USD and at 37 573 USD.
DISCLAIMER: This analysis is not intended to encourage any buying or selling of any particular securities. Furthermore, it should not serve as basis for taking any trade action by individual investor. Your own due dilligence is highly advised before entering trade.

Technical analysis update: BTCUSD (8th December 2021)Bitcoin broke above 50 000 USD in tandem with our expectations of a bounce in price (which we expect to be short lived). Currently, BTCUSD trades around 50 500 USD price tag; simultaneously, it trades within the neutral zone depicted in the yellow background. At the moment, we continue to maintain a bearish stance on Bitcoin. We expect an eventual breakout below the neutral zone and resumption of downtrend. Breakout above the neutral zone would force us to reassess our bearish view.
Technical analysis - daily time frame
RSI's bearish structure remains intact. We will observe RSI closely in the following days and we will look for possible crossover below 30 points. We expect such an occurrence to be accompanied by heavy selling pressure; MACD is bearish too as it remains in the bearish area below 0 points. Only Stochastic points in a bullish direction. Additionally, DM+ and DM- show bearish conditions in the market. ADX continues to grow which suggests that the prevailing trend is strengthening (current bearish trend). Overall, the daily time frame is bearish.
Our expectations of crossover in RSI:
We need to closely watch RSI and whether it will manage to pierce 30 points to the downside. We expect such phenomenon to be very bearish for BTCUSD.
Technical analysis - weekly time frame
RSI, MACD and Stochastic are all bearish. Additionally, DM+ and DM- show bearish conditions in the market. ADX contains low value which suggests that the prevailing trend of higher degree (recent bull trend) is very weak. Overall, the weekly time frame is bearish. Indeed, it coincides with conditions present in the daily time frame.
Support and resistance
Short-term support sits at 48 834 USD and short-term resistance lies at 52 956 USD. Between these two price levels lies the neutral zone. Major support level is at 28 600 USD while major resistance level is at 69 000 USD.
Other support and resistance levels
Other resistance levels appear at 59 564 USD and at 64 895 USD. Other support levels can be found at 42 900 USD and at 37 573 USD.
Other form of immediate support/resistance level derived from simple line:
Our bold predictions from the past:
Here we correctly predicted the double top formation. We also highlighted low volumes suggesting evaporation of new buyers at elevated prices. Subsequently, BTCUSD dropped over 39%.
DISCLAIMER: This analysis is not intended to encourage any buying or selling of any particular securities. Furthermore, it should not serve as basis for taking any trade action by individual investor. Your own due dilligence is highly advised before entering trade.

Bitcoin : A Clever Buy/Long ZoneWe Brokedown the trendline and the wedge and we are trading sideways for the last 4 days. I will be only longing Bitcoin if we start trading in the green Zone. And note this... More sideways action will make the bears Stronger. And also, I wont be afraid to open a High leveraged long at the green Zone.

Bitcoin bear with 3 Confluences :Bitcoin bearish Scenario :
Following the massive selloff a few days ago, Bitcoin is trading in sideways and we saw a small sell-off yesterday. However, The current chart looks bad since it confirmed my bearish scenario with 3 Major Confluence.
1- We confirmed the trendline breakdown with a retest and Rejection (The Black line)
2- We confirmed the Falling wedge Breakdown with a retest and rejection (The Red wedge)
3- We got exactly rejected at the Golden Fibonacci Pocket ( 0.35-0.382 Or The red Zone)
These are the 3 major bearish confluences i saw over the charts today after my vacation. I Recommend not to open any long positions until we invalidate our 3 Major Bearish Confluences.

Technical analysis update: BTCUSD (4th December 2021)Recently, we correctly predicted the double top formation in its early stage while noting that Bitcoin was near its cyclical peak. Additionally, yesterday we warned investors about the imminent retest of a key technical level around 53 000 USD. Then overnight BTCUSD fell over 20% to as low as 41 967 USD. Since then the price retraced back to 47 800 USD. We continue to maintain a bearish stance on Bitcoin as we expect selling pressure to be persistent. However, it would not surprise us to see price retracement continue a little higher (and possibly above 50 000 USD) before falling again. Technical and fundamental analysis supports our bearish view. Crucial technical levels to watch are 48 834 USD, 42 900 USD and 39 573 USD. In the following weeks we will observe whether BTCUSD will manage to break below 39 573 USD and indicate continuation of the bearish trend.
Our bold predictions from recent past:
We warned about double top formation already on 16th November 2021.
Technical analysis - daily time frame
RSI continues to develop bearish structure and it is due to perform crossover into the bearish zone. We expect such an occurrence to be accompanied by heavy selling pressure. MACD and Stochastic are also bearish. Additionally, DM+ and DM- are bearish too. ADX suggests that the bearish trend keeps strengthening. Overall, technical analysis on the daily time frame is very bearish and supports our bearish stance.
Technical analysis - weekly time frame
RSI, MACD and Stochastic are all bearish. DM+ and DM- show the same conditions as they performed bearish crossover recently. ADX remains low.
Support and resistance
Major resistance remains at 69 000 USD. Major support level is at 28 600 USD. Short-term resistance is at 48 834 USD, then Resistance 1 is at 52 956 USD. Resistance 2 is at 59 564 USD. Resistance 3 is then at 64 895 USD. Support 1 is at 42 900 USD and Support 2 is at 39 573 USD.
Our recent popular idea from 16th November 2021:
Disclaimer: This analysis is not intended to encourage any buying or selling of any particular securities. Furthermore, it should not serve as basis for taking any trade action by individual investor. Your own due dilligence is highly advised before entering trade.

Technical analysis update: BTCUSD (26th November 2021)Today BTCUSD reached 55 000 USD in tandem with our expectations expressed in the previous 2 posts. Currently, it trades around 54 600 USD per coin. We continue to be bearish on Bitcoin as technical analysis continues to support this thesis. We think current weakness in the global markets will be persistent in the short-term. Additionally, we think that this weakness will be contagious to cryptocurrency markets and it will create headwinds for further rise in cryptocurrencies (in the short-term horizon). We think BTCUSD will continue lower and we expect it to test short-term support at 52 956 USD in the following days.
Our recent popular post from 16th November 2021:
Here we started to speculate about possible double top formation. We also expressed that volume was declining while price continued to climb higher. We noted that this pointed to evaporation of buyers at higher levels of prices. In our opinion, this foreshadowed subsequent drop in price (combined with other warning signs).
Technical analysis - daily time frame
RSI, MACD and Stochastic continue to evolve their bearish structure. DM+ and DM- show also bearish conditions. ADX exhibits growth which suggests that the bearish trend is strengthening. In general, a bearish time frame is extremely bearish.
Technical analysis - weekly time frame
Divergence in RSI is clearly observable. This is a very bearish development. MACD is in the bullish area, however, it is flattening (and reversing to the downside). Similarly, Stochastic also started to point into bearish direction. ADX is very low which suggests the bullish trend of higher degree has lost its steam already. Overall, the weekly time frame is bearish.
Divergence in RSI on weekly time frame:
Divergence in MACD on weekly time frame:
Technical note
Synchronization in the bearish conditions between daily and weekly time frames suggests mounting trouble ahead for BTCUSD. We think BTCUSD is headed way lower and it will drag the rest of cryptocurrencies with it. We think investors should be very cautious in the following weeks.
Fundamental note
Hawkish narrative by the FED, additionally, supports bearish views for the cryptocurrency market. We think that decrease in quantitative easing combined with increase in interest rates will be detrimental to cryptocurrencies as purchasing power of the dollar will be rising. Further, we think prevailing irrationallity in the cryptocurrency markets (especially among lay and retail traders) combined with calls for extremely high prices such as BTC at 200k USD, 500k USD, etc., only shows how inflated this market is (at the moment).
Support and resistance
Major resistance level sits at all time high of 69 000 USD. Below that is Resistance 2 which sits at 64 895 USD (previous top). Resistance 1 appears even lower at 59 603 USD. Short-term support is at 52 956 USD. Then below that is Support 1 at 48 834 USD and Support 2 at 39 573 USD. Major support level lies at 28 600 USD (2021 low).
DISCLAIMER: This analysis is not intended to encourage any buying or selling of any particular securities. Furthermore, it should not serve as basis for taking any trade action by individual investor. Your own due dilligence is highly advised before entering trade.

Santa rally cooking...After the latest moves there is a strategically interesting structure setting up for the year end flows. Here I am tracking a pullback towards $52,000 support for an opportunity to load for the next exchange.
In desperation, late buyers succumbed to the fomo which was buying the highs while sharp hands are taking profits (very similar to our latest ETH charts). Now that the highs have been taken, profit taking becomes apparent.
This excellent setup is remarkable not only for the transfer of the momentum, breakout, retrace, breakout, nowadays we consider wave 5 to meet at least the length of wave 1 which will take us at least above $75,000 with extensions (unbelievable) all the way at $217,000.

BTCUSD (Long)BTC Low risk trade Setup (D1) :
trade with low risk only with low position size... We can build position if we go further up. BTC Looks lying aat a good support and a trendline. So i see no reason to open a Long position here...

Bitcoin LONG; entry $52.900Look out for a break down of the pattern. Placement of a stop-loss is a very good idea.

Technical analysis update: BTCUSD (16th November 2021)BTCUSD continues to move sideways within rectangle formation as bullish trend is losing momentum and becoming neutral. Bitcoin currently trades around 60 900 USD pricetag; and we are currently bearish on BTC as technical analysis on daily time frame supports this thesis. We expect eventual breakout below the neutral zone. Additionally, we expect such occurence to be accompanied by further selling pressure and possible beginning of bearish trend. If bearish breakout occurs then we expect price to test 55 000 USD.
Volume decreases as BTC continues to move sideways - which suggests that new buyers are increrasingly harder to find.
Technical analysis - daily time frame
MACD, Stochastic and RSI are all bearish. ADX contains low value which suggests neutral trend. However, we expect bearish breakout from neutral zone and resumption of selling pressure.
Technical analysis - weekly time frame
RSI is just slightly below overbought zone and it manifests sideways movement. Inability to pierce through 70 points might suggests that bullish trend peaked already. However, MACD and Stochastic still remain bullish. ADX suggests very weak trend which coincides with daily time frame.
We would like to note it is possible that double top is forming in BTCUSD. Because of that we think investors should be very cautious.
Support and resistance
Major resistance sits at 69 000 USD. Resistance 1 lies at 64 895 USD while Support 1 lies at 59 603 USD. Support 2 sits at 52 956 USD and Support 3 appears at 42 900 USD. Then Support 4 sits at 39 573 USD. Major support level can be found at 28 600 USD.
Disclaimer: This analysis is not intended to encourage any buying or selling of any particular securities. Furthermore, it should not serve as basis for taking any trade action by individual investor. Your own due dilligence is highly advised before entering trade.

Technical analysis update: BTCUSD (22nd November 2021)Last week we correctly predicted bearish breakout below the neutral zone. We also noted that we expected retest of 55 000 USD price level (BTCUSD stopped its decline at 55 640 USD). Since then price action continued to be choppy. We think it is possible for BTCUSD to retest 55 000 USD price level again in the following days. Technical analysis supports this view as technical indicators point to bearish conditions in the market.
We recently pointed out possible double top being formed:
Recent developments seem to confirm this development. However, we would be forced to change our stance if price retraced back into neutral zone depicted on the main chart.
We also pointed out (several times over past two months) decreasing volume in BTCUSD while price was climbing higher:
We noted that new buyers were increasingly harder to find. After that, drop in price followed.
Technical analysis - daily time frame
Daily time frame shows bearish developments. RSI is bearish and same applies to MACD and Stochastic. Indeed, MACD is performing bearish crossover which we expect to be accompanied by further selling pressure. However, ADX contains low value which suggests that current trend is either neutral or very weak (this coincides with ADX on weekly time frame). Because of that we expect price to move sideways for little longer before finally going lower.
Technical analysis - weekly time frame
RSI failed to perform bullish crossover and instead it reversed to downside. ADX continues to decline which suggests that bullish trend of higher degree has most likely peaked and trend is becoming neutral. MACD remains in bullish territory, however, it started to flatten little bit. Stochastic also remains in bullish area. Although, it already performed bearish crossover. In general, weekly time frame flashes warning signs for BTCUSD as it suggests previous bullish trend is becoming neutral.
RSI's failure to penetrate 70 points into bullish territory on weekly time frame:
Support and resistance
Major support level sits at 28 600 USD. Major resistance level lies at 69 000 USD. Support 1 appears at 52 956 USD. Support 2 lies at 48 834 USD. Support 3 is at 42 900 USD and then Support 4 is at 39 573 USD. Resistance 1 lies at 59 603 USD while Resistance 2 sits at 64 895 USD.
Psychologically important price levels
From psychological standpoint there are few other price levels that are important. These are respectively: 70 000 USD, 60 000 USD, 55 000 USD and 50 000 USD.
Our previous idea from 16th November 2021
Disclaimer: This analysis is not intended to encourage any buying or selling of any particular securities. Furthermore, it should not serve as basis for taking any trade action by individual investor. Your own due dilligence is highly advised before entering trade.
