BTCUSD - Left ConfusedI am left rather confused about this pair in regards to direction. I would like to think the massive sell-off stopped out the majority of support buying but there is always a possibility that price may come down again to tackle the previous low marked.
I am more bearish bias than long but I have marked out both targets for those who are interested.
BTCEUR

BULLISH FLAG to 41kEUR/50kUSDWe are still in a uptrend. Since March20.
Possible route to 41EUR/50kUSD.

Homerun for BTC!!📌 ridethepig | Homerun for BTC
Here the choice is between another sweep and marking a bottom. The first results in a discovered temporary pullback which allows early buyers to start getting excited... but the second moves involves a slingshot, automatically through the pivot.
A quick review of the initial charts we have been tracking
↳
This was the well known position. A yearly break unlocked $42,000 .
Double check the chart, it was a purely technical map. It is terribly accurate and compelling; even the most unaware buyers have had a long time to take profits. After buyers cleared this target we closed the chapter and started to look for the retracement.
1️⃣ In the initial chart played some weeks ago, things came down to the following interesting ABC position
↳
Buyers last move was of course to clear on the exhaustive nature and failure to mark a new high. The swing ended and control as I pointed out switch sides.
2️⃣ The following sessions played out as expected, the imaginative sellers started to enter making the position look a really natural move
↳
The somewhat theatrical looking chart by sellers - has worked! Buyers no longer wish to refute and are running to the hills... sellers got the upper hand. The correct play now is to manage our risk and stops accordingly.
3️⃣ The congestion entered into play and I gave a simultaneous display on how to neatly mange the trail
↳
Buyers did in fact try the zig-zag within a zig-zag within a zag... but was not enough and sellers with a strong attack took out support and forced the bid further into retreat.
4️⃣ So the bottom forming of the swing, or the sweep towards fresh lows and to complete the pending Jan 4th test we have been tracking since day one?
↳
The idea of scaling a position
Before you tackle what follows, you should quickly check that you are well versed in the concerning flows and swing. If not refresh your ideas on these, because these chapters will be important for the correct understanding of what follows.
The flow is as follows, after the sharp drop in ((v)) the possibility of a pullback towards $32/$33,000 is on the cards before a final hammer back to re-test the main target at $28/27,000. I do not believe the energy sellers have shown can suddenly disappear just because of that retrace. No, it must still be on the menu, even if in some modified formation. A breach above our new pivot level at $34,200 will block the movement for sellers and threaten the sweep of any remaining trail stops from above. In other words, the pivot is our last blockade as sellers.
Thanks as usual for keeping the feedback and charts coming 👍 or 👎

BTC BITCOIN NEW Trendline - 4H CHART BTCUSDC BTCUSDT BTCUSDBTC BITCOIN NEW Trendline - 4H CHART BTCUSDC BTCUSDT BTCUSD

Elliot Waves Complete Guide | Chapter 3.2 - "Flat-Expanded Flat"Hello Traders. Welcome to Chapter 3.2, where we talk about another form of corrective waves, the Flat and Expanded correction. In chapter 3.2, we will be discussing Zig-Zag waves. This is where most people will get "chopped" up in the market, as these corrections can often cause a lot of small panics within these corrective waves. These corrections more often than not, destroy traders. If you learn even the basics of corrective Elliot Waves, you can use them to your advantage to identify if we are in a fakeout and identify whether you are in a corrective pattern or not.
Chapter 3 Glossary:
3.1 Zig-Zag Waves
3.2 Flat Correction , Expanded Flat
3.3 Running Flat, Contracting Flat
3.4 Barrier Triangle, Expanded Triangle
3.5 Double-Three
3.6 Triple-Three
-----
Flat Correction
The Flat correction is probably the second most common corrective pattern and always has a 3-3-5 structure. This can be a very confusing pattern for many as it's also known to cause a lot of losses for intraday traders - it's AKA a "choppy" market period.
As wave A is not five-waved and powerful enough, the retracement of wave B is considered strong. There are rules to this!
📌Rules:
• It's a sideways movement - Wave A and Wave B are corrective.
• Wave C is impulsive, but does not go much below Wave A.
• Most of the time, Waves B/C go some degree above or below of Wave A (just to trick people into believing a breakout occurs, hence, choppy!).
• Although it is called the Regular Flat Correction, it is not the most common one and the second most common consolidated corrective pattern.
❗The ABSOLUTE most important thing is to just observe in corrective waves unless you are a true day trader. Otherwise, watch for overall market structure to avoid overtrading in corrections since these are the most trickiest. Once you achieve an overall picture of the structure (about 70% through), you can start considering on entering a position to increase your probabilities and risk of not over trading.
Expanded Flat
The Expanded Flat is the second most common one under the flat corrections. Confused already? Go back and re-read everything.
• Expanded flat is a corrective wave pattern with an extended wave B, which reaches higher than the start of wave A.
• Wave B makes a fake breakout above the last high.
• Wave C is also extended and goes deeper than wave A.
• Structure of the correction is 3-3-5.
📌Rules:
• Wave B ends higher than the beginning of wave A
• Wave C is considered an impulse or ending diagonal and ends lower than the low of wave A.
❗ Wave B/C over and over again catch traders on the wrong side, as fake breakouts take place just before the market turns. This in turn creates a lot of traders to get destroyed in the market!
Trade Safe!
Below are the chapters from 1-3.1!

Bitcoin crazy idea I think there is a good chance that we will get a lower low before the correction is finished.


ALT SEASON - When to expectCOINBASE:BTCEUR
If this happen to be the start of a deeper correction, we can expect that, after btc bounces off, alt season begins.
If all this happens btc will very likely reach to the top of a retracement level which takes us to between 55000€ ($66800) and 61000€ ($74000).
That is how it has happened in Oct. 2017, when, after btc finishes it's retest, alt season began. I am not a financial advisor so don't buy anythink i say. Wish you all successful investment.

ridethepig | Bitcoin Finally Breaking Down📌 ridethepig | Bitcoin Finally Breaking Down
The goal of this swing as you all know by now is to test $28.000/$27,000 and show a real seizure of control from sellers. After another -8% today, it's clear in the ST sellers are doing their duty as we approach the first targets. The defence here is very feeble, fresh weakness should be considered indirect fruits of our operations!
We have to review the diagrams to understand our opposition:
The ABC retrace was clearly running out of steam, pressure on buyers to take back $40,000 was too great and they started coughing. Sharp speculators began profit taking while the unaware kept loading at the said ceiling. Any remaining buyers would do better at giving up the soft floor here and reloading lower as we are now falling flat on the concrete.
The pullback from here should be shallow and strongly protected from sellers in my opinion. The decision to stay remain short is natural and we should be able to continue exploiting the late buyers. We should pay particular attention if we break down as we will see $28,000/$27,000 main targets very quickly.
Thanks as usual for keeping the feedback coming 👍 or 👎

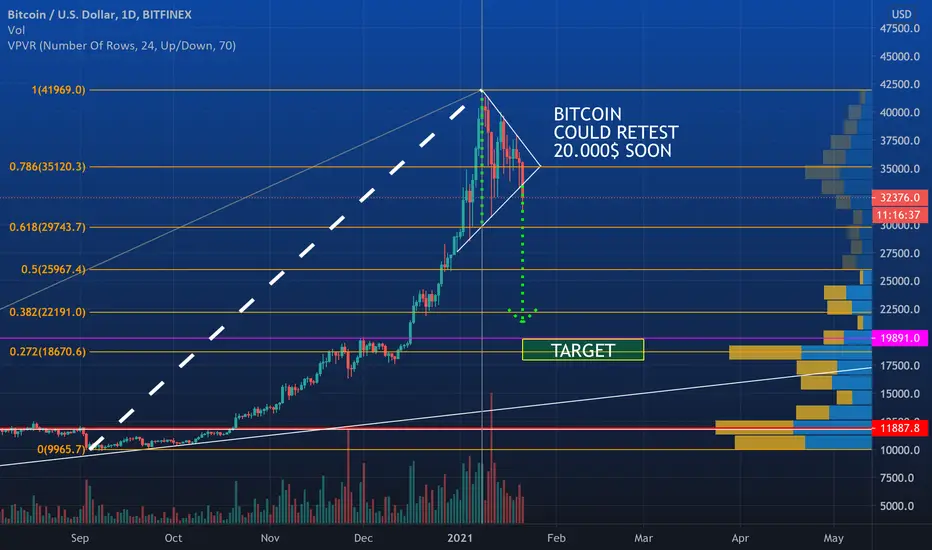
BITCOIN CAN REACH 20.000 SOON - THAT'S WHY! 3 Signals of TA (Symmetrical Triangle + Fibonacci level + Point of Control) suggests us that BTC's price could reach a price in a Range (20.000$ and 18.000$)
When the Candle close below the Symmetrical Triangle, it could be the right time to think to short BTC.
If you find this a good job, please hit the LIKE 👍 button. MANY THANKS 🙏🏻
Simple idea on BTC/USD - Bullish signsLooks like the ending of the triangle pattern. My guess is that it's a trend continuation sign and will probably keep it's way up again!
Also, the 50 SMMA it's working as a support for BTC/USDT, let's see what's gonna happen in a few days!
What do you guys think?


ridethepig | BTC Flirting to Break Lower📌 ridethepig | BTC Flirting to Break Lower
Here buyers are giving up the highs as expected and opening up a retracement back towards +/- $27,000 which will put pressure on the late lagging retailers. A more solid floor can be formed below the 4th Jan lows, if sellers can hold below $40,000 for the weekend then best is to cover.
Showing a lack of momentum! Why not ride some profit taking, possibly followed by a very typical BTFD below the lows. But if sellers hold the breakdown with a strong counter then they threaten to immediately complete the major swing down:
The outpost here is not a surprise to anyone who has been following the MT and LT chapters. The enormous breakout on the log chart carried such significance and explains why the sellers originally went fleeing!
Worth considering this move is coming to an end, continuation is unfavourable without a pullback, since the inventory is now hanging low we can witness a slippery slope if sentiment turns negative for the coming weeks.
As usual, thanks for keeping the feedback coming 👍 or 👎

BTC Short-term Volume AnalysisCRYPTOCAP:BTC In order to have a healthy breakout from the current band BTC is stuck, the accumulating upper range volume (green ellipse) needs to be able to compete with the big volume chunk below red ellipse).

moontarget clear elevate
average guy is shorting current price. liquidations for 5x-10x's sit around 50k. people are still short hungry seeing a bigger trade to the downside inevitably pushing us higher. 58k should break in january.
best of luck to you girls and boys <3

ridethepig | BTC Market Commentary 14.01.2021📌 Bitcoin Market Commentary 14.01.2021
It is sellers turn to move, we are hitting the main target for this third wave as widely expected since before the yearly close. The lows are clearly still mobile and the leg lower should now be safe to play.
After much thought, and completely recognising stepping against the train, this should be a decision for experienced speculators only .
When faced with the choice of protecting the retracement swing and continuation towards and impulsive leg (in this case it will be our invalidation at $42,800), is important in the sense that we are at a decision point. Sellers are looking to take advantage of the very contemplative buyers who will be late to react and before they know it we will be $10,000 lower. The pullback is completely healthy, a 5-3-5 typical corrective pattern will mean business as usual (BTFD) later in the year. For now, the main target belongs to $27,600 lows.
As usual thanks for keeping the feedback coming 👍 or 👎

All BTc lovers (like me) please be carefoul..!Hello traders!
It's been a while since i posted here and a lot of you have some complaints but i have to run my office work with my clients plus the Greek trader site is underway!
So let's get to the point!
I am long BTC since 6k figure but it's about time to lock some profits!
Technical Observations
1.We are heading to the previous all time high of the BTC at 20k mark from December 2017.
A lot of trapped traders for years might find the opportunity to sell.
2.We had a H&S pattern on the weekly chart as i have drawn on the chart.
If we project the distance from the neck to the head in order to find the TP of the pattern it coincides with the previous highs!
3.Fibonacci extensions from the last dip also coincide with the previous highs!
4.We have a big MACD and volume divergence which is crucial for the prominent massive double top pattern which is going to be created.
So please traders lock some profits with trail stop loss or partial close of the longs.
Possible short trade NOT yet confirmed.


BTC Ascending Triangle - Breakout imminentAfter cooling off for a bit, as I expected (see previous idea), BTC formed an ascending triangle and it is about to breakout. If it breaks to the upside, which I expect, we will likely see new ATH.

Bullish option for BTCThis could be a bullish option for BTC.
Wait for a good entry signal and ride 1 or 2 waves up.
Check other idea for bearish option.
This is not financial advice.

BITCOIN ( BTC ) FUTURE ! after Head& Shoulder pattern in H1-H4 BINANCE:BTCUSDT BITMEX:XBTUSD COINBASE:BTCUSD BITBAY:BTCUSD BYBIT:BTCUSD
Hello
As I mentioned in my last idea about double top or head and shoulder pattern for last movement of its top I can say :
It seems All whales had a common idea regarding short positions .
there is no fuel at all for new fishes .
I strongly believe that there will be a bump again before it continues to down .
indeed it should be a corrective wave or Wave B .
Above Support line I think about buy orders and vice versa about Resistance line .
we will see a Side way trend till it breaks the floor to 20,000 channel .
Are you with me ?
it should be a great time for Alt coins .
lets see what would happen .


ridethepig | BTC for the Yearly Close📌 @ridethepig XBT Market Commentary 19.12.2020
So we have the following picture; the prince slowly approaching his city after slaying the dragon, rescuing the princess and conquering the treasure. All the ministers and advisers are wanting to meet for a hearty breakfast and consider the correct way to balance the rewards. This picture is intended to convey how slowly this is happening despite how fast and decisive it seems at the time.
Only the most important characters are present during the impulsive waves:
The next moves in BTC are going to get very interesting for trading, a fresh break is not simply to create more space but also via a liquidity trap. So you must take the following to heart; try everything you can to not marry the position for its own sake but also not deny that BTC has rightfully earned its place in the sun!
The answer will come from the yearly close. Holding the break up will not be simply something to play with. Here looking for $31,800; $42,600 and $53,400 as magical line targets above for 2021 before a pullback at some point into 2022 as governments become more aggressive. The main blind spots to the BTC thesis come from the political side, for now like hero from the fairy tale; head off happily.
