BTCUSDT NEXT Impulse !Hi fellow traders, BTCUSD will be ready to make a move higher from the blue box after it completes the expanding flat pattern in a WXY formation. Target will be 113604.87 USD. Good luck and trade safe!
Btcidea

Daily BTC/USD Analysis - Smart Money PerspectivePrice recently swept liquidity above the previous weekly high, indicating a classic liquidity grab. After this move, we observed a market structure shift (MSS) to the downside, followed by a break and a mitigation of a bearish imbalance (BAG).
Currently, price is reacting from a small fair value gap (FVG), but this is likely just a retracement. I'm expecting the market to drop further and target the larger FVG zone that aligns on both the weekly and daily timeframes (highlighted in blue). This zone also aligns with a potential POI (point of interest) for smart money accumulation.
📌 Short-term bias: Bearish
🎯 Target: 99,000–97,000 zone
🔍 Watch for rejection at current FVG or possible internal liquidity grab before the drop.
Smart money is likely to seek deeper liquidity before any meaningful bullish continuation. Stay patient and let price come to the premium zone.

BTC Creating THIS Pattern Right Now – 108K Next?#BTC is forming a powerful pattern right now! 📊
Are we about to witness the breakout that takes us to **108K**? ⏰
Watch closely – the market's heating up! 🔥
#Bitcoin #Crypto #BullRun #BTC108K

BTCUSDT 1W UpdateYes, history is likely to repeat itself, making it possible for Bitcoin to reach a new all-time high in the range of $130K to $150K this year.
Are you ready?

Bitcoin Technicals Flash Warning – Smart Money Watching!Bitcoin has been forming a series of lower highs and lower lows since its all-time high (ATH) of $109,568, indicating a potential downtrend. The support level, which previously held strong, has now been broken and is acting as resistance. The recent price movement suggests a retest of this broken support, which could confirm further downside if rejected.
The 100 EMA is positioned above the price, reinforcing bearish pressure. If BTC fails to reclaim this level, the price may continue to decline. RSI is hovering around 41.51, indicating weak momentum, with no strong bullish signals yet.
Bullish Scenario: A reclaim of the broken support and a move above $90,000 could invalidate the bearish setup.
Bearish Scenario: A rejection from this level could lead to further downside, potentially targeting $75,000-$72,000.

Long Story short for BTCHistory hasn't failed yet, so the four-year cycle is still intact until it isn't. I have stretched this chart out for the next couple of years so that you can get a good idea of where the potential bottom will be during the next bear market. I plan to accumulate as much as possible the closer it gets to 66k. If we do reach a 150-250k top this cycle then I will expect a bear market bottom between 66-76k. Watch my levels and use them as a guideline. Historically Bitcoin has NEVER returned to the price its low during the US election week:
2012 Election Week Low - $10
2016 Election Week Low - $700
2020 Election Week Low - $13,200
2024 Election Week Low - $66,800
that brings us to now... if this doesn't indicate the current market sentiment then I don't know what will. There's a reason why many genius economists are speculating a 1 million dollar bitcoin in the next 8 years.

75k is INEVITABLE.I published my idea on BINANCE:BTCUSDT how it is forming Double Top pattern and indicators are making divergences in late January. Since BTC hit our first take profit point we might expect little bit of pullbacks and see if it is gonna react to 91k area, but Volume is not looking good that means we might see red candles all the way to 75k area. 75k area was major resistance zone which would work as support this time.

Bitcoin at a Critical Level: Will Support Hold or Break?CRYPTOCAP:BTC is currently accumulating within a marked zone, fluctuating within a broad range of approximately $17,800. The previous resistance line has now acted as support, indicating a key retest level.
If BTC fails to hold this support, a further decline toward the key support zone could be expected. The RSI is near 42.83, suggesting neutral momentum, with no strong bullish signs yet.
A breakdown below this range could trigger a bearish move, while a breakout above resistance would confirm bullish continuation.
DYOR, NFA
Thank you for your attention! If you found this valuable, please hit the like button and share your thoughts in the comments below.

BTC Breach Alert: Long Positions at Risk!CRYPTOCAP:BTC has broken below the broad accumulation zone.
Exercise caution with long positions.

Bitcoin Trapped in a Range – Which Way Will It Break?BTC is currently accumulating within a marked zone, trading within a broad range of approximately $17,800. The previous resistance line has now turned into support, indicating a possible consolidation phase before the next move.
The price is fluctuating near the 50 EMA ($97,811.26), which may act as dynamic resistance. A breakout above this level could signal renewed bullish momentum, while failure to hold support may lead to further downside.

BTC: Bearish Scenario - Potential Crash to $100,Simple Idea - Not Financial Advice!
This is a highly speculative scenario, but one worth considering: a potential major Bitcoin crash bringing the price down to the $100,000 range and below.
Observations:
The current macroeconomic climate, could be contributing to a significant shift in market sentiment.
A breakdown below key support levels at mention specific price levels, $103,000 could trigger a cascade of sell orders.
The psychological impact of breaking the important 100,000 mark could further accelerate the decline.
This is a highly speculative scenario and may not play out.
BINANCE:BTCUSDT
Disclaimer: This idea is for informational purposes only and should not be considered financial advice. I am not responsible for any losses incurred. Trading cryptocurrencies involves substantial risk.
Good luck!

BTC Retests Trendline Support – Breakout to $125K Incoming?BTC has once again successfully retested the rising trendline, which continues to act as strong support. Currently, the price is consolidating near the resistance zone.
If BTC breaks above this marked area, we could witness a significant rally, potentially driving the price toward $125K.
If you find our work valuable, please like, comment, and follow. Thank you for your support!

Accumulation to Breakout: BTC’s Next Target RevealedBitcoin Analysis
After a 47% surge from the first accumulation zone, the price entered a consolidation phase.
Breaking out of the next accumulation zone, Bitcoin rallied by 61%, showcasing strong bullish momentum.
Currently, the price is consolidating again, with a potential 40% upside if the bullish trend continues.
Previous breakout levels now act as key support for any pullbacks.

BTC Price Forecast: Will Accumulation Zones Lead to a 50% Surge?We are analyzing a BTC/USD weekly chart where the price is holding strong support above the rising trendline, marked in blue.
First Scenario:
After breaking out of the resistance trendline, the price rallied by 135%, as shown in the first green box. Notably, there was a small accumulation phase in the red-marked zone before the breakout.
Second Scenario:
Currently, the price is steadily moving upward, forming another small accumulation zone within the red-marked area. This pattern suggests a potential continuation of the bullish trend.
Outlook:
Based on these observations, the price could potentially rise an additional 50% from current levels. The Stochastic RSI supports this view, aligning well with the momentum seen in both scenarios.
Conclusion: The strong trendline support, recurring accumulation zones, and favorable momentum indicators point to further upside potential.

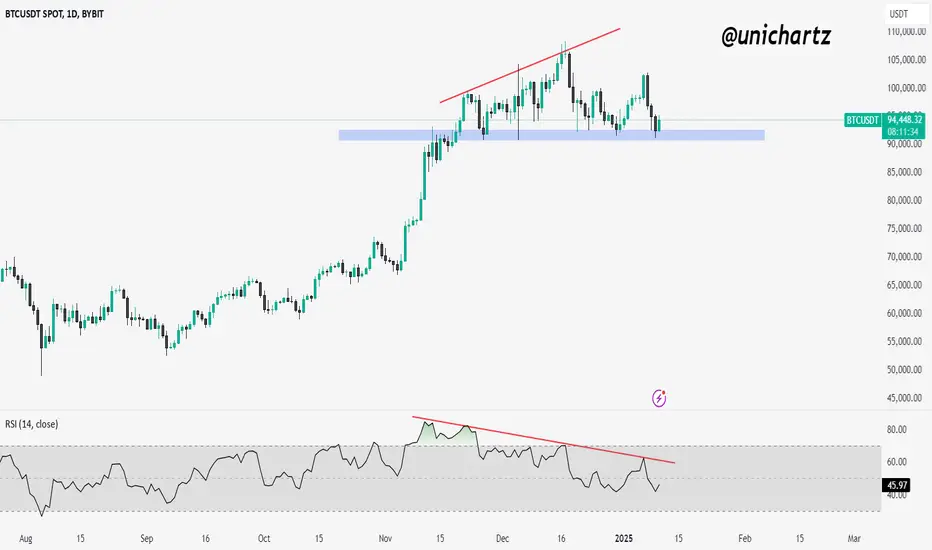
BTC Consolidates Near Support Amid Bearish SignalsBitcoin is currently trading near a crucial horizontal support zone, as marked on the chart. The price recently pulled back from its highs, forming a bearish divergence on the RSI, which suggests weakening momentum. However, the key support level around $90,700–$92,500 is holding firm for now, providing potential for a bounce.
If BTC manages to sustain above this support zone, we could see a recovery attempt. However, a breakdown below this critical level might trigger further downside, with the next possible target around $85,000. Traders should closely monitor the RSI and volume for confirmation of either a bounce or a break below the marked support.
Bitcoin Roadmap==>>Short-termWith the start of the new week and the good news that came during the weekend , Bitcoin ( BINANCE:BTCUSDT ) began to pump again and successfully created a new All-Time High(ATH) .
Bitcoin has already managed to break the Resistance zone($104,280-$103,340) .
According to Elliott's wave theory , Bitcoin seems to be completed wave 4 ; we should wait for Bitcoin to rise again . The structure of wave 4 is of the Double Three Correction type(WXY) . Bitcoin is currently completing wave 5 .
Also, USDT.D% ( CRYPTOCAP:USDT.D ) managed to break the Support lines and the Support zone(4.00%-3.90%) ( on the chart it is currently the Resistance zone ) and we have to wait for another attack on the Next Support zone(3.82%-3.77%) . A drop in USDT.D% can make Bitcoin rise .👇
I expect Bitcoin to start rising again after the completion of microwave 4 of wave 5 . Bitcoin's Targets can be :
🎯 $107,320 - $106,967 🎯
🙏Please respect each other's ideas and express them politely if you agree or disagree.🙏
Bitcoin Analyze (BTCUSDT), 15-minute time frame⏰.
🔔Be sure to follow the updated ideas.🔔
Do not forget to put Stop loss for your positions (For every position you want to open).
Please follow your strategy and updates; this is just my Idea, and I will gladly see your ideas in this post.
Please do not forget the ✅' like '✅ button 🙏😊 & Share it with your friends; thanks, and Trade safe.

BTC Long ideathe last BTC was a little bit ago sorry for the wait, there havent been many opportunities for good rr trades since last time i posted. however now there is. This 8H zone is perfect to continue the long trend of btc with very minimum risk and a lot of potential profit if you trail your stoploss well. i will be looking for confirmation in this 8H SnD with a rather tight SL hoping for at least 1:5 rr to the target, from there i will take a hefty portion off and trail the remaining position. i have developed my own entry criteria and you guys should aswell. if you havent yet developed your own, i highly recommend you do so through thorough back and front testing.
anyways hope you guys like the idea and take the trade with me, let me know if you do end up taking it ;)

Bitcoin to 100KAfter retest FVG in daily we will see an expansion to taken buyside liquidity and break this level 99.588 to reach 100k lets go


BTC ANALYSIS After taken liquidity buyside and displacement of the price and creat fvg and retest this fvg we will see an expansion to taken liquidity of sell side at 66.822

BTC ANALYSIS After taken liquidity of buyside and shift market structure and retest breaker we will see an expansion to taken liquidity sell side

BTC Long PushStrong buy trend as we can see, and a continuation pattern confirmed as price breaks out and retested before creating another break of structure to the upside. We are currently looking at another retest hopefully the buyers will take charge by the coming week and ride long to the monthly resistance at 71,269.16. Until then, Fingers crossed...

BTC DAILY ANALYSISAfter taken sellside of swing low and creation of fvg we will see a retracement of the price in fvg after that we will see an expansion to taken liquidity buy side of previous daily high at the price 66500
