BTCUSD 4H-TIMEFRAME ANALYSIS 💡BTCUSD 4H-TIMEFRAME ANALYSIS 💡
Hello ladies and gentlemen
This is my new idea for Bitcoin
My idea is that BTC will continue to downtrend
Targets
10150
9850
I hope my idea is clear
Support me by like and share
Good luck 💰💯
Btcidea

BTC Trader Alert, Big Move Coming ?☆☆☆ BTC Usdt ANYLYSIS ☆☆☆
⚠️ This Post Only For Your Saftey ⚠️
1️⃣ Resistance 👉 10800
2️⃣ Resistance 👉 11180
1️⃣ Support Zone 👉 10120
2️⃣ Support Zone 👉 9880
Bitcoin Now Moving Between Key Support 10500 To Resistance 10800 , Price Moving Here More Then 5 Days.
I'm Smelling Something Big Move Up Or Down. So Always Use Stop-loss For Your Saftey. If BTC Want To Fill The CME Gap We Can See BTC At Near 9640 + -
✌ Hit The Like Button & Appreciate My Hard work ✌
⚠️ CHECK YOUR OWN ANYLYSIS ⚠️
⚠️ This Post Only For Your Saftey ⚠️
Best Of Luck...

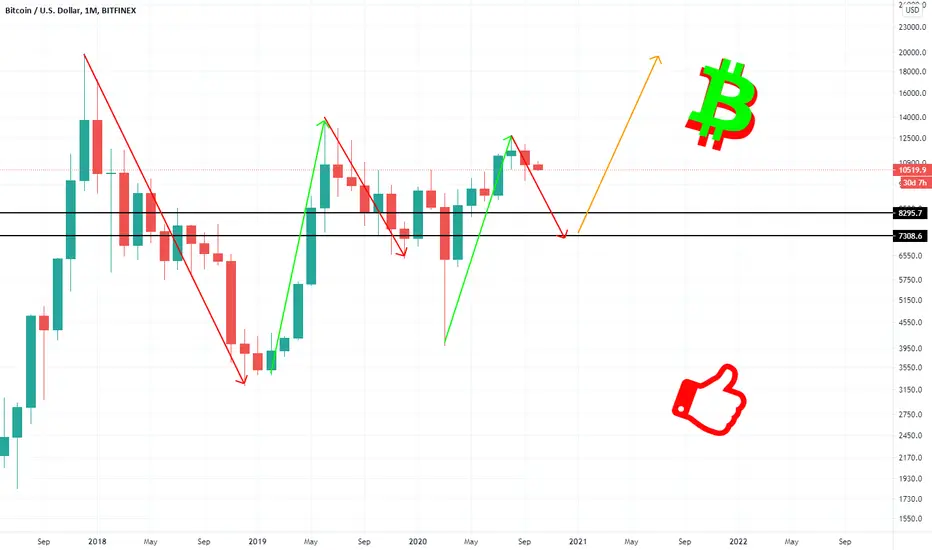
BTCUSD 1M-TIMEFRAME ANALYSIS 💡BTCUSD 1M-TIMEFRAME ANALYSIS 💡
Hello ladies and gentlemen
This is my new idea for Bitcoin
My idea is that BTC will continue to downtrend
Very bad monthly close
rejected from the resistance 10000
Targets
8600
7500
I hope my idea is clear
Support me by like and share
Good luck 💰💯
BTCUSD 1W-TIMEFRAME ANALYSIS 💡BTCUSD 1W-TIMEFRAME ANALYSIS 💡
Hello ladies and gentlemen
This is my new idea for Bitcoin
My idea is that Bitcoin will continue to downtrend
Support is between 9000 and 9200 It would be good to test it, and test of the historical downtrend
The bulls defend these areas strongly
From there we will start the bull market 💪💪💪
I hope my idea is clear
Support me by like and share
Good luck 💰💯


BTCUSD D Tweezer top formingThe KING-crypto is currently forming a tweezer top on the break of trangle pattern the possible movemnt of sell could be imminent of trade closes as full tweezer top to about $10k resistance. Alternatively we could be seeing new yearly highs reached on the crypto run update season. kindly note that whenever Bitcoin experience bull runs most cryptos pegged with it fall and vice versa. kindly like and comment


BITCOIN DONT MISS THIS OPPORTUNITY 2000$ MOVENO HARD SCIENCE . THIS WAS PRE PLANNED move and easy to catch i dont trade crypto but got some requests so here is my analysis for it. CUP and handlen pattern. please like and follow and share your feedbacks also if you want to know entry points kindly comment

BTCUSD Update: Whats next? I think by now, it has and always has become apparent that cryptocurrencies like BTC are susceptible to whale market manipulation - meaning those with large % of BTC holdings are able to manipulate the price of BTCUSD to a certain degree to stop out many small time traders, enabling themselves to massively profit from the large surges in price change in their favour. In these cases, the ones who suffer the most are the highly leveraged traders in a market of strong momentum, when everyone is sure of the market direction, these traders put in LONGS or SHORTS with high leverage in their false confidence, and BAM, spikes of reversed volume by the whales in unison, the price swings in the opposite direction, as they hit the stop losses, the trend accelerates with newfound strengths from the STOPS getting cleared out.
Example in our BTC dump occured just a few hours ago, from the highs of 10400 to lows of 9135:
- Initial surge in BUY to 10400 came in sudden with JUST ONE spike in massive buy volume, immediately followed by pullbacks and profit taking (which is normal)
- BTC then appears to be bouncing off 10100 slightly, with much smaller volumes of consolidation, mainly buy volumes
- Trader sentiment is mostly BULLISH by now, with MACD strong in the BULL ZONE and BTC above 10100, its highest since Feb 2020 pre-crash
- BAM! Huge massive SELL volumes out of nowhere (although we can see a rejection wick in the previous BULLISH candle after touching 10200, it is still a bullish candle + the wick is relatively short = not enough to signal a reversal to sell)
- The massive SELLOFF dropped to 9100s in the HOUR ITSELF, stopping out thousands of BUY trades with stop losses estimated to be at :
--> 10000S for short time traders
--> 9800s for mid term traders
--> 9300s for longer term traders
TRADING IS REACTIVE, NOT PREDICTIVE
Therefore, we watch for the following opportunities:
- Now we see long support wicks validating 9400 (0.236 fIB LEVEL) as a VERY IMPORTANT SUPPORT ZONE, breaking this would bring us DOWNWARDS towards next support level @ 9300, as such I see more possibility of upward movement with these overlap of support zones.
- an HOURLY H1 close above 0.382 FIB LEVEL @ 9650 with a strong bullish candle stick gives us a LONG opportunity towards the 2 targets shown in the chart @ TP1 9750 and TP2 @ 10100
As always feel free to like and follow if you enjoyed my ideas, trade carefully with stop losses and happy trading!
Best Regards,
GOLD D ROGER


#BTC/USD BULL and BEAR Scenario+ SAFE EXIT PLAN.It’s Subscribers like you that make my IDEAS awesome. Thank you very much for your unwavering attention and support so far. Cheers! and welcome to this new update.
6 hours back I updated my last idea that we will touch 9900 soon AND WE DID EXACTLY HIT 9900.
WHAT NEXT?
FIRSTLY UNDERSTAND THE CURRENT MARKET SENTIMENT:
A week back people were bearish and no one wanted to long when BTC hit the 8100 area and BTC pumped and started trading under the rising channel. That move ended up being a wick in HTF.
Now people are bullish and I must say very bullish. This is the concern.
SO WE MAY SEE AN IMPULSIVE MOVE TO THE UPSIDE AND THEN A BIG CORRECTION.
Currently BTC is trading under an ascending triangle which is due for a breakout. As per chart the breakout should happen within the next two days and 8 hours.
If it breaks to the downside $9185 is the SL for longs or getting our of the market. And If it breaks to the upside we will follow the following strategy:
MY STRATEGY FOR BITCOIN:
I will try to lower my exposure from BTC within the area $9900 to $11680.
THE SAFEST EXIT IN MY OPINION WOULD BE within $10400.
(Not a financial advise)
IMPORTANT LEVELS HAVE BEEN PLOTTED IN THE CHART ITSELF PLEASE OBSERVE AND LEAVE YOUR FEEDBACK.
ALTCOIN STRATEGY :
Because of this MOVE in BTC many altcoins will have negative rallies which will eventually result in producing new buying opportunities.
That's is the time when we must consider entering alts by following proper TA FA and Keeping an eye on Dominance charts/alt mcap
I will be posting all the charts here on tradingview.
So please LIKE THIS POST AND FOLLOW ME FOR MORE DAILY UPDATES and FREE EDUCATIONAL CONTENTS.
I will end this update with. this note - Never be too greedy, take profits when they show up. BTC is due for a correction its just about finding the top which now one knows so we try to exit safely and buy back lower by being patient.
THANKS for your unmatchable support.
Stay Safe
#PEACE

BTCUSD BITCOIN Technical Analysis: Top of Ascending Wedge!!BTC seems to have formed an ascending wedge formation since the sell off on 10 May 2020, which is traditionally a bearish omen.
Now, BITCOIN BTCUSD is currently testing the top resistance of the wedge @ 9930, for a breakout above it, look for an hourly closing candle above 9930 - 9950 region for a BUY opportunity. From there, we look for BTC to retest the major resistance @ 10000.
A rejection by the wedge top would bring u to the nearest support @ 9550 - 9600 region, which coincidentally overlaps with the 50 moving average (MA) line, further strengthening this base as a strong support, offering us a quick SHORT opportunity.
Therefore, I would not suggest buying in at this time, but wait for the pullback to the bottom of the wedge then rebound confirmation OR a breakout above the wedge with bullish candle pattern confirmations.
As always, trade carefully and with stop loss orders. Feel free to like my post if you like what I shared, thank you!
Best Regards,
GOLD D ROGER
A humble, beginner trader

BTCUSD Bitcoin: Retest of 9.8K & the big 10K !!!So far, the 9200-9300 region has been validated as a strong support, which includes:
- 200 MA line (Yellow)
- Bottom support of descending wedge formation (Green line)
- 0.236 Fib retracement line
Three times BTC has touched this region and rebounded to the top of the descending wedge, now having broken out of it to hit the highs of @ near 9600.
Now we look for BTCUSD to retest the top of the wedge, also the 0.382 Fib level. If it rebounds from there, we could aim for a LONG Opportunity to the 0.786 Fib Level at least @ near 9800.
OVERALL FUNDAMENTALS: Really Bullish with greater media attention now especially with
- Paul Tudor Jones endorsement : might see a laggard spike in moves taken by larger funds into BTC holdings
- Recent JK Rowling Uproar: her innocent question about bitcoin and its uses
Miners seem to be driving the prices higher to maintain mining operations with the halved rewards, I don't see a mass capitulation very soon with bullish momentum feeling so strongly
Bitcoin holdings in wallets outside of exchanges/BTC flows out of exchanges have massively increased, I see a gradual yet imminent demand surge for BTC as soon as fund companies start snatching up the supply.
At the moment, I would be focusing on BUYING IN on any major pullbacks along the way. Most shorts taken now likely to be on 10-20% pullbacks in a increasingly apparent parabolic uptrend and that IS NOT ADVISABLE.
As always, FEEL FREE TO LIKE AND FOLLOW and always trade carefully with stop loss orders!
Regards,
GOL D ROGER

BTCUSD Bitcoin Forecast : SQUEEZING AGAINST 100 MA WELCOME TO MY PAGE! FEEL FREE TO LIKE AND SUPPORT BY FOLLOWING IF YOU LIKE WHAT YOU SEE =)
BTC has been following an ascending wedge line since 11 May 1800pm.
It was rejected sharply by the 200 MA on 11 May 1200pm, where a sharp spike was quickly overturned by massive selling pressure
Now since 13 May 0000pm, it has been following the underside of 100 MA closely, proving to be a strong resistance.
We look to see if BTCUSD BITCOIN BREAKS TO THE UPSIDE of the 100 MA (white line), then our LONG targets would be @ 9000 next, 9200 then 9500 if possible.
Most likely, I would see a sharp rejection @9000 for a SHORT to the support level @ 8500, for a continuation of the sideways movement in the 8500-9000 range.
As always trade carefully with stop losses and FEEL FREE TO LIKE AND COMMENT YOUR THOUGHTS DOWN BELOW!
Regards,
GOL D ROGER


BTC Forecast with Fib Retracement Levels AnalysisAfter checking my previous post and cross-referencing with Fib Analysis and historical data, I can safely say 2 paths BTCUSD will take from now:
1) REBOUND FROM BOTTOM OF ASCENDING CHANNEL and 0.236 Fibonacci Line --> Taking us to resistances @ 9200, 9500 and finally 10000
However, this requires massive buy volumes to overcome 3 major resistances levels close together.
2) BREAKDOWN OUT OF CHANNEL BOTTOM --> Retouch 0.382 Fib Line @ strong support level 7700 or even 0.5 Fib Line @ 7000
This will definitely bring in major BULL POWER with the massive buys upon seeing this BTC price, giving us more gas to start the next major BULL RUN for post halving
Option 2 seems more likely, given the exhausted weeks of bull pressure, and also, having BTC retest the lower levels would garner stronger supports for the next run up.
At the moment, BTC seems undecided about where to go, ranging about forming a PENNANT STRUCTURE.
Watch for:
- Breakdown below 8500 --> DOWN WE DROP
- A close above 8900 --> UP WE GO
For now, hold your horses boys, we charge when the signal flare is lit.
Regards,
GOL D ROGER

Shakeout before breakout BTC idea?Would love if we get something like this. Shakeout longs, retest trendline breakout + a few major MA's around 7.9k, and shoot up right before the halving. May or may not happen, just an idea that would make the most sense and would certainly be the most painful one. Going up from here seems too "easy" money to me.


BTCUSD. Buy or sell ? Actually we can't have a clear decision about buying or selling BTC. But if the price couldn't break the resistance line ,there is a high probability that it will fall down to 7500 USD as a safety target.Even though it can go bellow .
Like and share your view with me in the comment section ;)

BTCUSD In Shorting !! correction is coming NowBTCUSD In Shorting !! correction is coming Now
1 : the volume is not enough to move or push the price toward 7800-7900
2 : the price touch Massive resistance and is felling.
The next target to buy is 6780 $
Please support us for more analytics by follow and like.

BTC/USD LONG SET UP TO $7,770-8,150TITLE : BTC/USD BUY Limit
ASSETS : CRYPTO
SYMBOL : BTC/USD
ORDER TYPE : (EP1) BUY LIMIT ORDER
(EP2) BUY LIMIT ORDER
TF : H4
ENTRY PRICE 1: $6,396
ENTRY PRICE 2: $6,286
STOP LOSS : $5,980
TAKE PROFIT 1- $6,786
TAKE PROFIT 2- $7,096
TAKE PROFIT 3-$7,486
Modify SL TO TP.3 AND TRAIL SL
TP.4 $7716
TP.5 $8,000
STATUS : PENDING

REWIND AND FAST BULL EFFECT. $75k in 6-7months. Let's see what happens. This is only my idea, which I would like to save it. I think this worldwide crisis is the best opportunity for Crypto.
Don't take it as an investment opportunity.
