BTCUSD 1D UpdatedBTC ~ Updated
#BTC The $80,000 gate was just a matter of time. tell me if the price of BITSTAMP:BTCUSD is already $80,000
Btcidea

BTCUSD 1MBTC ~ 1M
#BTC on Monthly Time Frame BITSTAMP:BTCUSD Looks very good. The retest of the support line has been successful.
Our short term target is $80,000
Our long term target is +$100,000

BTCUSD 1DBTC ~ 1D Updated
#BTC It seems #Bitcoin Retesting the Support Line in this pattern.
Bulls still dominate as long as the price remains above this pattern.

BTCUSD 4D BTC ~ Updated
#BTC Successfully broke through the resistance line of this bull flag pattern.
It looks like a new ATH will form again soon.
We are targeting $80,000 for the new ATH.

BTCUSD 4DBTC ~ 4D Updated
#BTC On 4D Timeframe, CRYPTOCAP:BTC USD Formed a Bull Flag Pattern. It is very bullish if it breaks the resistance line of this pattern

BTCUSD 1WBTC ~ 1W
#BTC Very simple. we found this History for 1W MACD. When the MACD crosses, the price tends to be Down.
we found this at least twice in history.
will it happen again this time? if yes. $55,000 - $52,000 is the closest target currently possible to achieve.

BTCUSD 1WBTC ~ 1W
#BTC In the long term we still see a bullish pattern here.
Be patient, Every dip we just keep buying.
we'll let you know when we see a Bear zone emerge. here of course.

Bitcoin Midterm IdeaAs we can see btc has swept liquidity below 60K$ and again reclaimed that level so its mean do not sleep over this oppertunity. A massive pump coming after a decent pull back towards 60K$ again, this will be best buying oppertunity in btc as well as in Altscoins.

BTC Pullback, Road to 50kSimple trading - Lower lows and lower
Key idea: If BTC can hold below 67k, this would create a lower high. A potential major SELLOFF
BTC is currently trading in a bear market on the smaller timeframes. With the BTC halving on the way, it's clear as day that BTC will not hold above 70k.
So to capitalize on the 3rd red weekly candle, we are looking to see if BTC will make one final pullback to the upside. It's fair game for BTC now that we enter the weekend break. if this is a pullback, now is the time to rise. Pay attention to the price level at 67000. This is the final resistance before BTC flies to a new ATH. As long as we reject this level we will continue to SELL.
Currently in a buy at 63258
Stoploss in profit
TP 66900
The SELL (new chart will be posted)
Around 65k-68k seems like a good range for the price to break out. Wait for bearish candles and look to sell

BTCUSDT Short idea Hi dears, i thinking that BTC pulled back pretty enough after strong sell, and i expected that from here around 65000, maybe with another leg up to 66200 we will gona drop again. I assume 58000-58500 can be good point to check situation for closing short for another bounce up and looking for another short entry after bounce back.
I still believe that swing term goal for correction is 52000k - major support.

RSI in BTC 4H time frame is showing Bullish DivergencesRSI in BTC 4H time frame is showing Bullish Divergences and if it works, price can go up to 66k. Keep in mind that there are significant caveats when entering long trades!
BINANCE:BTCUSDT.P


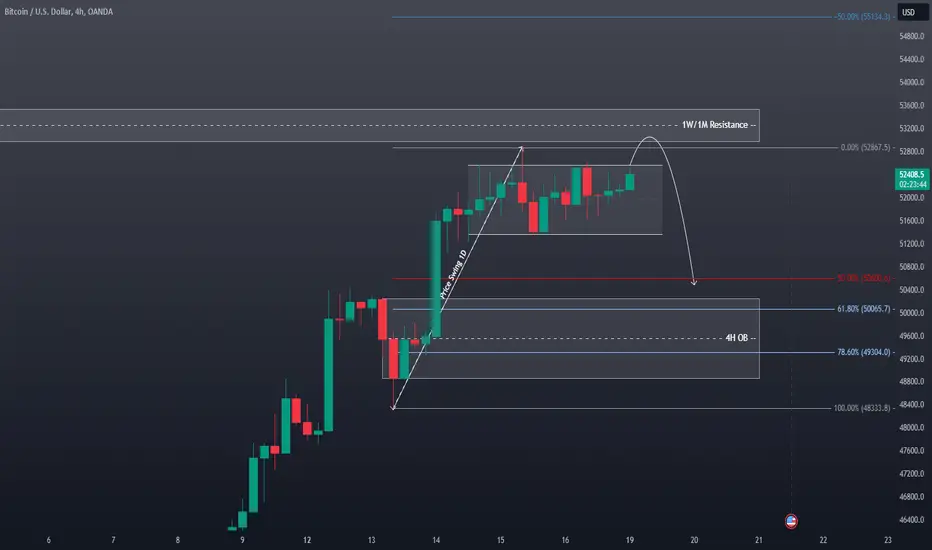
Bitcoin Technical Analysis: Key Resistance and Potential RetraceBitcoin (BTC) has recently encountered a crucial resistance level at its previous all-time highs. Given this development, we anticipate a substantial retracement in price. However, our outlook remains optimistic, with the potential for a continuation towards the $80,000.0 mark.
Our trading strategy involves closely monitoring the 1-week timeframe. Specifically, we aim to enter the market during the 50% to 61.8% Fibonacci retracement zone. Our profit target is set at 2R, emphasizing risk management and reward-to-risk ratios.
Disclaimer: This analysis serves as an opinion and should not be construed as financial advice. Traders and investors should conduct their due diligence and seek professional counsel before making any trading decisions.

BTC BITCOIN Technical Analysis and Trade Idea (video)This is a full video explanation of my previous post. #BTC has encountered substantial resistance at both weekly and monthly (1W/1M) timeframes.
The 4-hour (4H) chart reveals sideways price action and a formation of a lower high, indicating potential bearish pressure. Expect a retracement targeting the 61.8% - 78.6% Fibonacci zone, derived from a significant daily swing low to swing high.
Trade Suggestion:
- Monitor for signs of a bearish shift in the trend on the lower time frame to confirm the retracement.
- Consider short positions upon breakdown from the current range, targeting the Fibonacci zone.
- Stop-Loss: Implement a carefully calculated stop-loss above the recent swing high to manage risk effectively.
Disclaimer:
This analysis is offered for educational purposes only and should not be interpreted as direct financial advice. Always conduct your own thorough research and implement sound risk management practices before initiating any trades.

BTC BITCOIN Technical Analysis and Trade Idea#BTC has encountered substantial resistance at both weekly and monthly (1W/1M) timeframes.
The 4-hour (4H) chart reveals sideways price action and a formation of a lower high, indicating potential bearish pressure. Expect a retracement targeting the 61.8% - 78.6% Fibonacci zone, derived from a significant daily swing low to swing high.
Trade Suggestion:
- Monitor for signs of a bearish shift in the trend on the lower time frame to confirm the retracement.
- Consider short positions upon breakdown from the current range, targeting the Fibonacci zone.
- Stop-Loss: Implement a carefully calculated stop-loss above the recent swing high to manage risk effectively.
Disclaimer:
This analysis is offered for educational purposes only and should not be interpreted as direct financial advice. Always conduct your own thorough research and implement sound risk management practices before initiating any trades.
BTC Expecting a correctionI expect a little correction on Bitcoin, bouncing from the short-term trendline that also fit with a 4hrs support.. $41.200-$41.300 is a good area where BTC can make a good bounce targeting $43.500. Stoploss (if we get there) should be placed below $40.300.

Buy if a green zone is reached within the specified date rangeStrongly advise against buying Bitcoin if prices reach a green zone before or after the specified dates.


Bitcoin Hit Our Fib Level And Continues To ConsolidateBTC yesteday hit our fib level where we mentioned (0.618) and now its slowly pulling back up for more consolidation.possible retest points explained.
Thanks for watching

Where to from here on BTC part 3This is the third post in the series of posts where I am looking at possible direction of BTC and price targets.
Links to previous posts are in description.
In this post we will look at DXY and use its price action to guess where BTC is headed in future.
The chart you see in the post shows a wave count based on Elliott Wave analysis.
The most recent count that I am tracking and makes sense is a Zig Zag correction in DXY after it put in a massive rally to 114.
The Zig Zag is a 5-3-5 sequence, downwards the most difficult part of this sequence is to identify the 3 (ABC) sequence.
Right now, we have completed the first two parts of the zigzag. The first 5 waves down followed by 3 wave sequence as a Flat correction and about to begin the final 5 waves down to 94 region on Dxy as we have satisfied the minimum requirement for the 3-wave sequence completion, which the 0.5 retracement from top to bottom. We just tapped it and are rejecting from 0.5 retracement.
Why does it matter for BTC price?
It's because DXY is highly inversely correlated with BTC price, so if DXY is about to go down bitcoin is likely to go up.
Another thing I noticed is the divergence in DXY/BTC correlation. DXY has put in an enormous 8% rally, from 13th July when it bottomed out and btc topped on the same date. But after 17th of august dump there has been a divergence, Dxy Put in an almost 5% rally and during the same time BTC put in 15% rally after hitting 25K support. This shows the increasing strength of Bitcoin
overtime, possibly because of increasing adoption among institutions.
I will be tying it all together in this series, in a final post which is coming soon.
So please follow me for updated on this analysis and may others to come in future.

Where to from here on BTCI did a series of similar posts on SPX predicting its paths, and they have played out beautifully.
Let's see what BTC is up to.
We must look at a lot of things when guessing the direction of any asset, like looking at DXY, yields and traditional markets, but in this post, I will ignore all that, look at BTC purely based on its market structure.
On larger timeframes we have not made any progress at all in 6 to 7 months on bitty. We have just been ranging, we ranged from 25 to 31K in Range 1, then again did the same thing in Range 2 and now it seems are about to repeat that again and maybe form range 3. I want to see either Range 4 or Range 5 present themselves for any new possibilities until then well we just keep ranging. Right now, I am looking at the yellow part that played out last time when we rotated from bottom to top in Range 1.
An additional thing to note is the time it took for full rotation in Range 1 was 94 days and we are on the 94th day today and in Range 2 where we are seeing comparable price action highlighted in yellow so the possibility of a full rotation back-up must not be ignored.
If we do, there are two long term play that appear, we either break out of this range and form a Range 4, above, or we are in a distribution here and will create a Weekly Head and shoulder by creating a lower high this time around 29500-30500 area.
Now to the question, why have we been ranging.
Because of the law of supply and demand. We have massive Supply right above where we btc has been hitting its head and bounce from weekly demand.
As you can see, we have almost depleted the supply, but demand is deep, and we have only scratched the surface of it. So, it's possible if we create a lower high this time around, we dig very deep into the demand which would be in confluence with the target of the Head and shoulders that will form with lower high.

BTCUSD Analysis 3Sep2023BTC analysis is still in accordance with the analysis some time ago. Where the price goes down to SND and is currently still continuing the bearish trend. Seen prices approaching Wave 2, had seen bullish some time ago but the price returned to the 25800 area. There is a possibility that the price drops back more than wave 2. If this occurs is likely to be fake out, or if there is a bearish continuation then the Elliot wave notation will change .

BTC getting weaker.27.9K nextBTC first move of the month was dumpage to 28.6 where we wanted to initially long.candles looking weak and we might go lower. this area is THE AREA for btc to hold n pump. If not the rally is over
Thanks for watching
