BTC continues to accumulate, waiting for breakout to go up💎 MID-WEEK BTC PLAN UPDATE (06/08)
Brief BTC Analysis – 4H Timeframe:
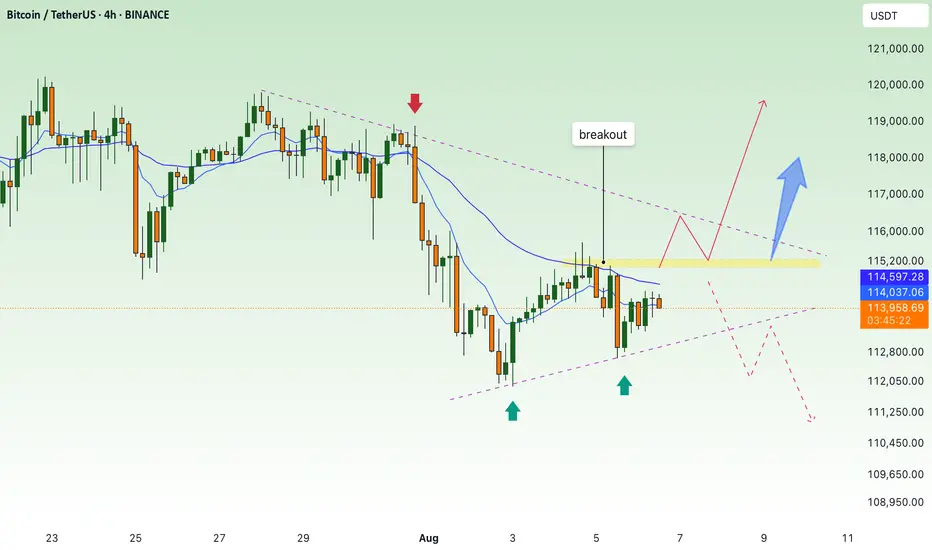
• Main Trend: Price is consolidating within a descending channel (green diagonal lines).
• Support: The 112,500–113,000 zone has been tested twice and bounced (green arrows).
• Resistance: The 114,800–115,200 zone (purple area) – this is the key level that will determine the next trend.
⸻
Two main scenarios:
🔺 Bullish Scenario (Preferred):
• Price breaks above the 115,200 resistance zone → confirms a breakout from the descending channel.
• Next targets: 116,500 → 119,000.
🔻 Bearish Scenario:
• Price gets rejected at around 115,000 and breaks below the 113,000 support → likely to revisit 110,000.
📌 Key Signals to Watch:
• A clear breakout above 115,200 with volume is a strong buy signal.
• If the price fails to break this zone, consider selling once there is a clear bearish reaction.
Btclong
U.S. Dollar Index (DXY) !!U.S. Dollar Index (DXY)
Long-Term Channel Support Held
The chart shows DXY moving within a rising parallel channel since around 2008.
Recent price action bounced right from the lower trendline (~98 zone), indicating strong structural support.
Bearish Pressure
DXY dropped below 100, currently around 98.72, down 1.32% this month.
Trading below the 200-month EMA, which suggests weakening long-term strength.
Bearish candlesticks forming near the lower channel indicate an increased risk of a breakdown if support fails.
Ichimoku Cloud Signal
Price below the Kumo (cloud) = bearish territory.
Cloud turning thin ahead — signaling potential indecision or transition.
What This Means for Markets
If the DXY breaks below this channel, it could trigger a broader USD sell-off, potentially bullish for cryptocurrencies, gold, and emerging markets.
If support holds, expect a rebound toward the 104–106 zone, especially if macro sentiment favors the dollar.
Stay updated and manage your risk accordingly.
DYOR | NFA

Updated chart: 1050 days of bull, 380 days of bearEach cycle fits quite neatly into ca. 1050 days of bull market and 375 days of bear. Sell in Sep/Oct 2025. Buy in Nov 2026.
An argument can be made that 2021 was a botched bull run. By the time we got to the second peak, Bitcoin was already running out of steam. One single peak would have topped around 100k. I blame SBF/Alameda.
People who are trying to extrapolate/do curve fitting through that 2021 peak will underestimate 2025.
2021 should be ignored as an exception.

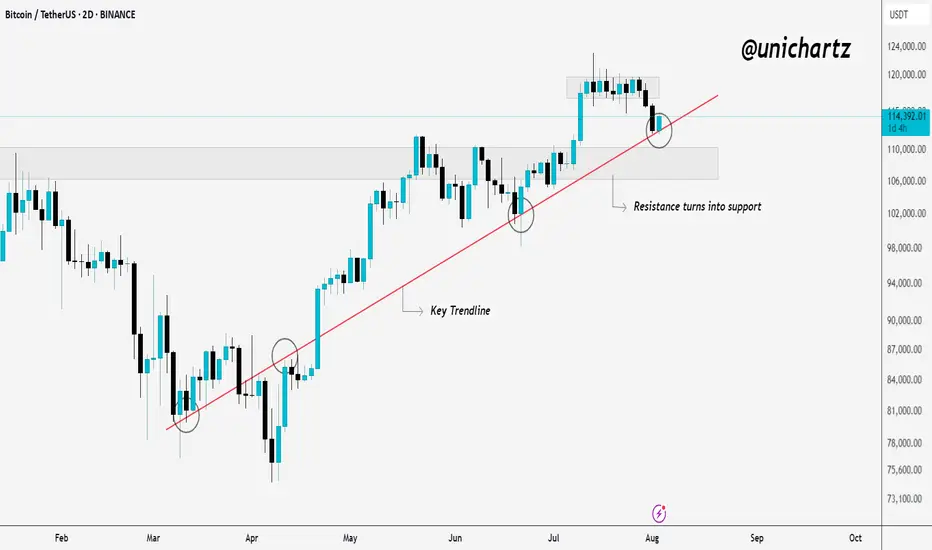
Smart Money Watching This Line — Are You?Bitcoin is holding strong above a key trendline that has acted as dynamic support since March. Every time price touched this line, buyers stepped in, and once again, it’s doing its job.
What was once resistance has now flipped into solid support. The recent pullback seems healthy, and the price is trying to bounce from the trendline area again.
As long as CRYPTOCAP:BTC respects this structure, the bullish momentum remains intact. If it holds, we could see another leg up from here.
DYOR, NFA
Thanks for reading!
Bitcoin to $116K in a Week? Here's the Case Everyone's IgnoringI know it sounds wild — but hear me out.
BTC is primed for something massive, and the ingredients are all on the table:
✅ ETF inflows are quietly stacking
✅ Supply shock post-halving is still underestimated
✅ DXY weakening = flight to hard assets
✅ Global uncertainty = Bitcoin safety bid
✅ Technicals pointing to a breakout above ATH with no resistance until $100K+
We're seeing the early signs of parabolic structure forming — and if volume confirms, this could move fast. Everyone thinks a 2x in a week is impossible... until it isn't.
Not saying it’s guaranteed — but if you've been around long enough, you know BTC doesn’t move linearly.
👀 Watch the $72K breakout zone closely. If it flips with conviction and volume, $116K is not out of the question.
Drop your charts. Agree or disagree?

BitcoinBitcoin/TetherUS (BTC/USDT) Trading Analysis - Jul 15, 2025
Key Observations:
Price Movement:
Current Price: $117,692.46
24h Change: -2,148.72 (-1.79%)
Range: Low of $116,250.00 to High of $119,940.83
The price is currently near the lower end of the day's range, indicating bearish pressure.
Support and Resistance:
Support Levels:
Strong Support: $112,000.00 (marked as S/L)
Intermediate Support: $113,500.00 and $110,000.00
Resistance Levels:
Immediate Resistance: $119,900.00
Higher Resistance: $120,000.00 and $122,500.00
Profit Levels:
The "Profit" section lists potential take-profit targets, with the highest at $135,000.00.
The price has recently dipped below the $120,000.00 psychological level, suggesting weakening bullish momentum.
Trend Context:
The chart spans from June to September, but the current price action (July) shows consolidation after a potential pullback from higher levels.
The presence of multiple support levels ($112K–$116K) suggests a critical zone for buyers to defend.
Actionable Insights:
Bearish Short-Term: The price is below key levels ($119,900–$120,000) and has broken below $118,250.00. A retest of support at $112,000.00 is plausible.
Bullish Reversal Signal: If BTC holds above $112,000.00 and reclaims $120,000.00, it could target $122,500.00 or higher.
Risk Management: A break below $112,000.00 (S/L) may trigger further downside toward $110,000.00 or lower.
Conclusion:
The market is currently in a corrective phase. Traders should monitor the $112,000.00 support for potential reversals or breakdowns. A close above $120,000.00 would shift bias to bullish.

#BTC Update #13 – Aug 01, 2025#BTC Update #13 – Aug 01, 2025
Bitcoin has approached the lower edge of its current channel and received a reaction from there. However, in the current timeframe, the ongoing candle seems willing to pull back again. The MA200 band held the previous candle well, which also represented the bottom of the current channel. There is high liquidity between the $113,200 and $121,000 zones. I believe Bitcoin will continue to move by sweeping through this region. Therefore, I think Bitcoin’s current target is to reach around the $118,000 level with a 3% push move.
If Bitcoin does not make this move and chooses to pull back instead, it may go as far as filling the imbalance at the $110,000 level. The last impulsive move was made around 20 days ago, and since then, the chart has been progressing with a correction of a correction. As long as there’s no close below $107,500, the uptrend will remain intact in the long term. However, if the $107,500 level is broken with a strong candle, we can say that Bitcoin has turned bearish on the 4-hour timeframe. For now, this doesn’t seem very likely. I believe Bitcoin’s next move will target the $118,000 region, continuing to clear out the liquidity accumulating in the upper ranges. However, this channel will need to break at some point.

Accumulate waiting for btc price increase💎 BTC PLAN UPDATE – End of July (31/07)
📊 BTC Technical Analysis (4H Timeframe – End of July)
✅ Positive Signals:
• BTC has broken out of the consolidation triangle pattern (blue diagonal line), indicating a potential strong uptrend.
• The current price is retesting the breakout support zone around 117,800–118,000 → showing a good reaction and creating upward momentum.
• MA50 and MA200 are starting to slope upwards → confirming increasing buying strength.
📈 Bullish Scenario:
• If BTC holds above 118,000, it is likely to move toward the nearest resistance zone at 119,900.
• After breaking 119,900, the next targets are:
→ 122,792 (Fibonacci 1.618)
→ Further target: 127,900 (Fibonacci 2.618)
🛑 Risk Note:
• If the price drops below 117,000, it’s important to monitor again, as it may retest a deeper support zone around 114,500.

#BTC Update #12 – July 31, 2025#BTC Update #12 – July 31, 2025
Bitcoin is currently at the upper boundary of the channel it has been following. It may experience a pullback from this upper boundary. This pullback is estimated to reach the $116,800 level. If it wants to go lower, it could drop as far as the $114,500 level.
There is a significant amount of liquidity between $121,000 and $117,000. Bitcoin may also try to sweep this area. However, despite 4 or 5 attempts, it still hasn’t managed to break above the upper resistance zone. Therefore, a pullback should always be taken into account.
Overall, Bitcoin is still in a correction within a correction. That means no impulsive move has occurred yet. It’s not at a suitable point for either long or short positions. You may choose to trade within this range, but keep in mind that it's quite risky.

#BTC Update #10 – July 27, 2025#BTC Update #10 – July 27, 2025
Bitcoin continues to move between $116,400 and $118,900, and staying within this range is actually a positive sign, even in bearish scenarios. A decisive close below $114,000, however, could open the door for a deeper and more prolonged correction.
Although BTC hasn’t broken to new highs yet, its ability to hold here means the trend isn’t broken. A strong breakout above $118,900 could lead to a rally toward $123,300 and possibly even $128,000.
🔹 On the 4H chart, BTC seems to have completed its minor correction.
🔹 On the daily chart, the correction remains incomplete – despite dipping to $114,700, the key $112,900 zone hasn’t been tested.
In lower timeframes, BTC remains squeezed within a symmetrical triangle. While it occasionally pokes out, it quickly returns inside — showing indecision.
📌 Direction is unclear at the moment. There’s no strong signal for Long or Short. Waiting for confirmation with volume and a clear breakout is the safer play.

#ARKM is ready for an upside move of more than 150%#ARKM is ready for an upside move of more than 150%, and the remaining altcoins are set for a 100% move.
This will be the final upside move—after this, a severe crash will follow, one beyond imagination.
For example, SOL could fall below even $50.

Accumulate BTC over 115K💎 BTC PLAN UPDATE (July 23rd)
NOTABLE NEWS ABOUT BTC
Bitcoin (BTC) and Ripple (XRP) are approaching their all-time highs, while Ethereum (ETH) continues to grow steadily toward the important $4,000 mark. These top three cryptocurrencies by market capitalization are showing signs of a new bullish momentum, supported by strong technical structures and increasing investor interest.
TECHNICAL ANALYSIS PERSPECTIVE
1. Main Trend
The overall trend remains bullish, with a clearly rising price channel (black diagonal line).
However, BTC is currently in a short-term correction phase, consolidating sideways after the recent strong surge.
2. Key Price Levels
🔵 Strong Support Zone: 116,000 – 117,000 USDT
This zone includes the 200-day moving average (MA200), horizontal support, and a previous bottom — making it a decisive area for the short-term trend.
If this zone breaks, BTC could fall to a deeper support area around 111,000 USDT.
🔴 Resistance Zone: 122,000 – 123,000 USDT
This is a previous peak and a recently “false breakout” area — a strong psychological resistance.
If broken convincingly, BTC could surge to the 130,000 USDT zone (Fibonacci extension 1.618).
3. Possible Scenarios
✅ Bullish Scenario:
Price retests the 116,000 – 117,000 support zone and then bounces.
If it breaks through the 122K resistance, the next target is 130,000 USDT.
❌ Bearish Scenario:
If price breaks below MA200 and the 116K support zone → it could drop to the deeper zone around 111,000 USDT.
4. Technical Signals
There is a triangle accumulation pattern (with flat tops and bottoms).
The “false breakout” at the resistance zone shows that buyers are not yet strong enough and a retest of support is needed.
Follow the channel for the latest and continuous updates on XAUUSD, CURRENCIES, and BTC.

#BTC Update #9 – July 22, 2025#BTC Update #9 – July 22, 2025
As previously noted, Bitcoin is currently trading within both a horizontal range (box) and a tightening triangle formation. Although there was a drop last night, price didn’t pierce the lower boundary of the box and is now showing an upward reaction.
As long as BTC holds above this box, there’s no major risk. Bitcoin has already completed the 0.382 Fibonacci retracement from its previous impulsive move. If that correction is sufficient, the next upside target is $127,900.
However, one key point to watch: Bitcoin failed to break its previous high in its last three attempts — a clear sign of price compression and market indecision.
📌 No need to rush into Long or Short positions. It’s best to wait for a confirmed breakout before acting, as premature entries could carry elevated risk.

#BTC Update #8 – July 21, 2025#BTC Update #8 – July 21, 2025
Bitcoin isn’t moving in a textbook symmetrical triangle, but it’s trading in a similar, tight range, mostly bouncing around the highlighted box area in the chart. It’s attempting a new impulsive leg, but $120,000 remains a key resistance level, having rejected price several times already.
As long as $116,500 holds, there's no major risk for Long bias. However, considering the triangle-like structure, the short-term upside is limited to about 2% for now.
A breakout above the upper edge of this structure, particularly if $123,200 is broken with strong volume — would justify a Long position. Until then, I don’t plan on entering any trades.
The last corrective move has completed, and my next major upside target is $127,900. If further correction occurs, watch for potential support around $115,000, $113,000, and the strong base at $112,000 — though I don’t expect price to fall that low.

BTC Bull & Bear historical Periods 3 Bull & Bear Markets
Bull markets took around 152 weeks...
then
V
v
v
v
v
Bear Markets took around 52-59 weeks..
then
v
v
v
v
v
v
v
Bull Market gain...
----------------------------------------------------------------------------------------------------------
After 2021 ATH
BTC recorded his current bottom after 52 weeks ( 15500 $).
BTC pumped after 59 weeks .
then what ?
Will the history will repeat itself again ??
if we will be alive inshallah ,we will see the next 152 weeks to ( October - November 2025 ) if this will be the New ATH of the next bull market or not :D
It is not a financial advice , PLZ DYOR

Still btc bullish
Don't predict just move according to market
Manage your risk before go to trade
Flag pattern also confirming market still continue up
Strong resistance level looking for break if it broken market make new higher high TP 75 to 82

The Critical Blue Line – Will Bitcoin Soar or Sink
🔹 Bitcoin Technical Analysis – Key Blue Line, Bear Trap Possibility & Long-Term Scenario
On the Bitcoin chart, the blue horizontal level has acted multiple times as both support and resistance. The price has broken it several times but failed to sustain above, indicating high-volume decision-making zones by institutions and large players.
📉 Why this pattern keeps repeating:
Strong supply and demand concentration at this level.
Inability to break and hold shows market indecision.
Repeated fakeouts are likely used to shake out weak hands.
🔍 Important hidden scenario: Bear Trap Potential
If the price dips below the blue line but quickly reclaims it, it may form a bear trap, tricking short sellers into entering prematurely. This move could ignite strong bullish momentum from trapped sellers and renewed buyers.
🔮 If price holds above the blue line:
Signals market strength and potential bullish structure shift.
Targets:
109,800
117,200
120,000+ (Long-term)
📛 If support fails again:
Retracement toward the lower channel near 101,000 or lower is possible.
📊 Conclusion:
This zone is one of the most critical decision points in the current market. Traders should combine volume, candlestick behavior, and confirmation signals to avoid getting trapped by fake breaks

BITCOIN PREDICTION: INSIDER DATA THAT WILL HIT YOU HARD(warning)I am sharing with you my personal insider data of what I know about Bitcoin right now!

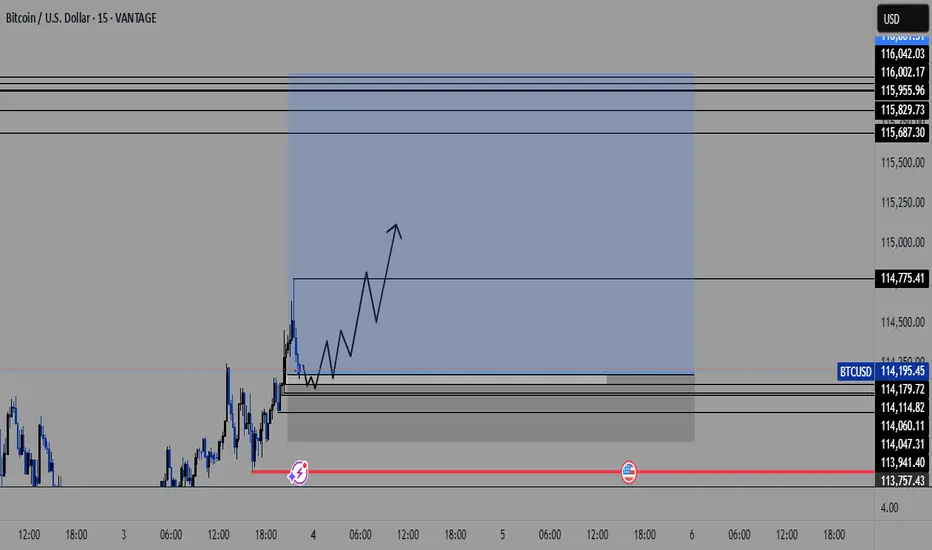
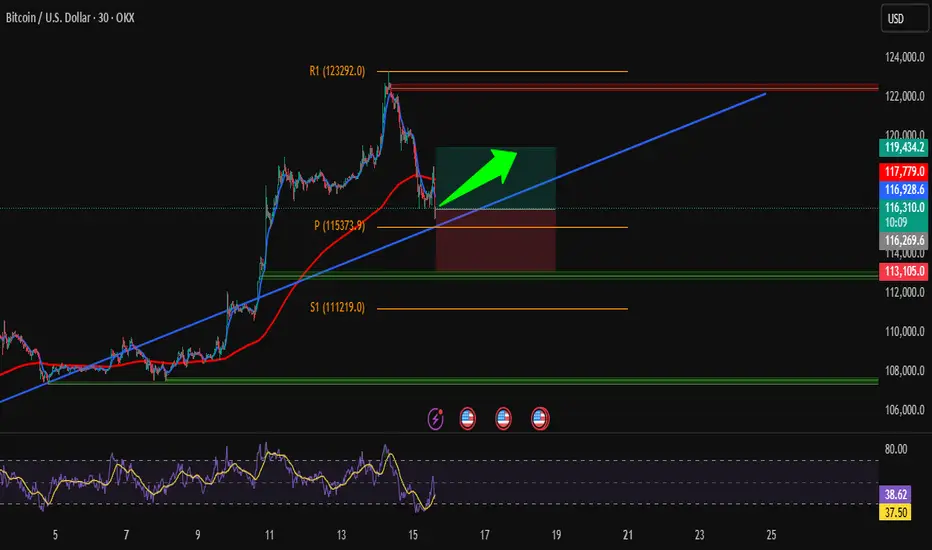
Clean BTC Trade – Bounce from Key Trendline SupportHi traders! , Analyzing BTC/USD on the 30-minute timeframe, we can observe that price is respecting the ascending channel and reacting to the dynamic trendline support (blue line). This bounce, aligned with prior structure, signals a potential bullish continuation.
🔹 Entry: 116,249
🔹 Take Profit (TP): 119,434
🔹 Stop Loss (SL): 113,105
Price remains above the 200 EMA while continuing to respect the ascending trendline, signaling sustained bullish structure. The RSI is showing a bullish divergence, which supports the idea of upward momentum. We also saw a strong reaction at the pivot point (115,373), and a bullish engulfing candle formed right near the trendline — adding further confirmation to this potential long setup.
This long setup presents a favorable risk/reward ratio within the context of the broader trend. Targeting a clean break above previous resistance and return to the R1 zone.
⚠️ DISCLAIMER: This is not financial advice. Trade at your own risk and always use proper risk management
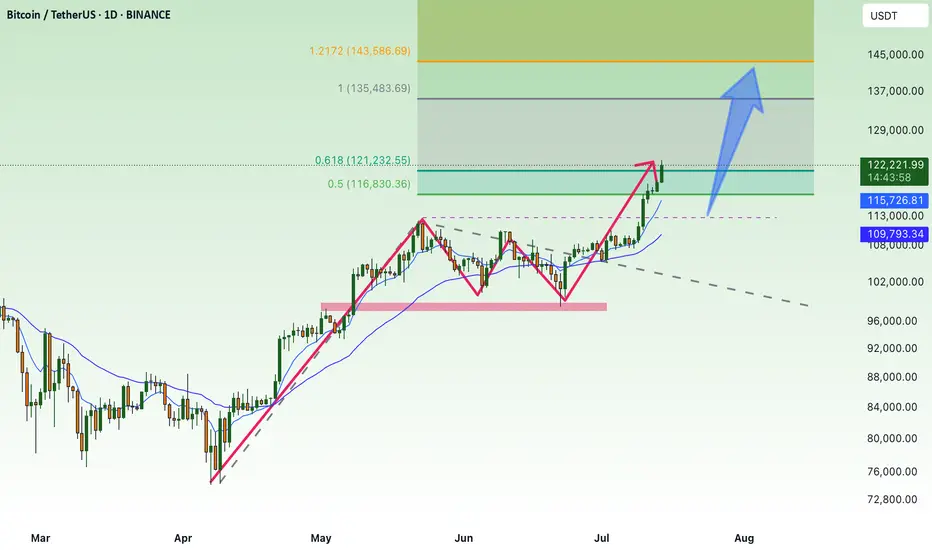
BTC Era, continue to create new ATH💎 BTC WEEKLY PLAN UPDATE (14 July )
NOTABLE NEWS ABOUT BTC
Bitcoin (BTC) broke above a key milestone on Friday, setting a new all-time high of $119,999 with no signs of slowing down. The technical outlook supports further gains as momentum indicators remain strong and price action is solidly in price discovery mode, with the next potential target at $135.000
Bitcoin’s Next Stop: $135.000
Bitcoin entered price discovery on July 9, and since then, the king of cryptocurrencies has surged toward the $120,000 target—a key psychological level for traders. Early Monday during the Asian session, BTC climbed to a peak of $119,999, marking a new all-time high and the closest the asset has come to this milestone.
TECHNICAL ANALYSIS PERSPECTIVE
Two key momentum indicators on the daily timeframe signal underlying bullish momentum in Bitcoin, suggesting a potential for further upside. The Relative Strength Index (RSI) reads 76, and the Moving Average Convergence Divergence (MACD) is flashing green histogram bars above the neutral line.
However, if BTC undergoes a correction, it may extend its pullback to find support near the lower boundary of the Fair Value Gap (FVG) around $115,222.
Derivatives market data shows that $76 million was liquidated over the past 24 hours as BTC surged toward its new high. The long/short ratio, which is considered an indicator of bullish or bearish trader sentiment, is above 1—indicating that more derivative traders are optimistic about Bitcoin and are expecting further gains in the king of cryptocurrencies.
Stay tuned to the channel for updates.
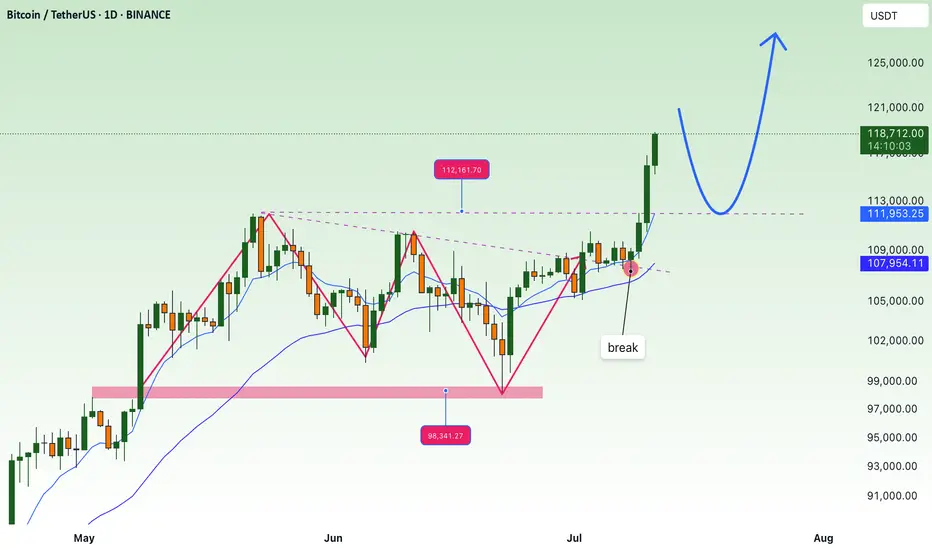
FOMO price increase, create new ATH💎 Update Plan BTC weekend (July 11)
Continuously creating a new ATH, preparing to have a short sale?
The reinforcement of Bitcoin price around the upper boundary of the previous consolidation area was broken at $ 108,355, which ended on Wednesday. The price has soared to the highest level of the new time of $ 116,868 on Thursday. At the time of writing on Friday, the price is fluctuating above $ 116,600.
When BTC entered the price exploration regime and if the trend of increasing continues, the price can expand the momentum to an important psychological level of $ 120,000.
Technical analysis angle
Our community has continuously chose the trend of increasing as the mainstream for all previous transactions and currently preparing to welcome 120k as forecast.
The relative power index (RSI) on the daily chart reaches 71, higher than the excess buying 70, showing a sharp increase. However, traders should be cautious because the ability to adjust the decrease is very high due to over -purchase. Meanwhile, the average divergence dynamic indicator (MACD) has shown a price intersection at the end of June. The indicator also shows that green histograms are increasing on neutral zero, showing that the rising momentum is being strengthened and continues to increase.
However, if BTC must be adjusted, the price may extend the decline to search and support around the upper boundary of the unified area that has been broken earlier at $ 108,355.
Plan has been constantly accurate in the past 2 months, which is the positive signal of the channel that brings value to the community.
Please follow the channel to receive accurate scenarios about gold and BTC
==> Comments for trend reference. Wishing investors successfully trading
BTC Long / Buy SetupBTC is strongly Bullish towards 120k liquidity level, I'm not seeing any healthy correction before hitting the 120k level. If BTC strongly breaks and closes below 106.9k then chances are high that it will touch the weekly level and again come to 107k level, but this time it will struggle to break the 107k level because it will become bearish fvg, if it holds the 107k level and give any strong reaction from the zone then the next level is 120k. even a wick towards 105k or below doesn't matter, any body closing below the 106.9k (at least 4hrs) will lead short term weakness to the trend.
