BTC/USDT Chart UpdateBitcoin's price has slightly increased to around $67,312.72 after facing resistance near the $72,000 level. Despite the minor retracement, the bullish structure remains intact, with strong support around the $64,000 to $65,000 range. The chart suggests a consolidation phase near current levels, with a potential bullish breakout if the price moves past the resistance zone.
The projected upward curve indicates that the price could see another upward movement targeting $76,000 and higher. Key support levels to monitor include $64,000 and below, where buying interest may re-emerge to push the price back up.
Disclaimer: This analysis is for informational purposes and is not financial advice. Always stay updated with market movements and adjust your trading strategies as needed.
You can DM us for information on any other coin.
@Peter_CSAdmin
Btclong

BTC/USDT Chart Analysis Update!!Bitcoin has continued its bullish trend within the established channel. The price faced resistance at the high of $72,000, which aligns with previous resistance areas marked on the chart.
Currently, Bitcoin is hovering above a key support level, and a successful bounce off this level could take the price toward the target of $78,000, as indicated by the upward trajectory. The moving averages continue to support this bullish sentiment, suggesting that the momentum remains positive.
Given the ongoing price action, traders should keep an eye out for a strong breakout or potential pullback above the resistance zone that could provide a buying opportunity at lower levels. Monitoring these levels will be crucial to understand the next significant move in Bitcoin’s price trend.
Disclaimer: This analysis is for informational purposes and is not financial advice. Always stay updated with market movements and adjust your trading strategies as needed.
You can DM us for information on any other coin.
@Peter_CSAdmin

Bitcoin Analysis Update!!Bitcoin continues to trade within a broad ascending triangle pattern, with its recent price action showing signs of strength as it approaches a crucial resistance area.
Bitcoin's moves within this pattern indicate increasing volatility, with higher highs and lows.
The price is currently testing a key supply zone acting as resistance. A breakout above this level could indicate strong bullish momentum.
For long entries, look for a confirmed breakout above the horizontal supply zone, targeting higher levels in the resistance zone.
A stop-loss can be placed below the support of the ascending triangle to protect against false breakouts.
Bitcoin's ability to maintain momentum and break key resistance levels will be key to confirming the next major move. Keep an eye on this setup and adjust strategies based on price's reaction to these levels.
Disclaimer: This analysis is for informational purposes and is not financial advice. Always stay updated with market movements and adjust your trading strategies as needed.
You can DM us for information on any other coin.
@Peter_CSAdmin

BTC Next planThis is the scenario I will be expecting on BTC for the few days
We wait a little bit correction to the daily OB below and sweep the liquidity above
Follow for more market update and trade setup

BTC/USDT Analysis UpdateBitcoin has formed an ascending triangle pattern, and the price is currently testing a key horizontal supply zone. This level has historically acted as a resistance area, making it a crucial point to watch for a breakout.
The triangle's upward trendline shows steady buying pressure, with the price making higher lows.
Bitcoin is trying to break through this significant resistance area, which could trigger a bullish rally if A confirmed breakout above this zone, with strong volume, would suggest a continuation of the bullish trend, targeting higher resistance levels.
Consider entering a long position if there is a confirmed breakout above the supply zone with a retest showing support.
To minimize risk, a stop-loss can be placed just below the ascending triangle's lower boundary.
Look for profit targets around the next significant resistance levels.
Keep a close eye on the price action and volume to confirm the breakout, as this could set the tone for Bitcoin's next major move.
Disclaimer: This analysis is for informational purposes and is not financial advice. Always stay updated with market movements and adjust your trading strategies as needed.
You can DM us for information on any other coin.
@Peter_CSAdmin

BTC Chart - Bullish / Bearish in short termBTC chart looks confusing one right now. I am super bullish in next 2-3 months. However, there are two scenarios which I would like to share with you all here could play out in short term.
Scenario 1:
BTC breaks down one more time from this diagonal resistance and daily 200 EMA, and get the liquidity from 50k-52k zone before moving back up.
Scenario 2:
BTC breaks out from this daily downward resistance, test or break the 64K zone and go back to test the 72k zone again.
We need a good positive news like ETH ETF launch and institutions inflows etc. in order to go from this zone. Otherwise, we are going to test the lows first before going back up.
Would love to hear other traders opinions and thoughts...

BTC/USDT Analysis Update!Bitcoin is currently consolidating within an ascending triangle pattern, indicating potential bullish momentum. The price action suggests an attempt to break a crucial horizontal supply zone, which could act as a crucial hurdle for further gains.
The formation of an ascending triangle is typically a bullish continuation pattern, indicating the possibility of an upside breakout.
Bitcoin is testing a crucial supply zone, where sellers have been active previously. A decisive breakout above this zone would confirm the bullish trend.
Consider a long position on a confirmed breakout above the supply zone with strong volumes.
A stop-loss can be placed just below the lower boundary of the ascending triangle to manage risk.
Look for potential profit targets around the next resistance levels or key psychological levels. This setup needs to be monitored closely as market volatility could increase in the coming days.
Disclaimer: This analysis is for informational purposes and is not financial advice. Always stay updated with market movements and adjust your trading strategies as needed.
You can DM us for information on any other coin.
@Peter_CSAdmin

BITCOIN UPDATE !Bitcoin continues to consolidate within the descending broadening wedge pattern. The price recently faced rejection at the upper resistance level, indicating a potential downward move.
The repeated rejection at the upper boundary suggests strong selling pressure at the current levels.
The chart highlights multiple bearish formations, each leading to significant drops, which could indicate a similar scenario if the price fails to break out.
The green trendline and the lower yellow zone are potential support areas where buyers might step in.
A short position could be considered if the price is rejected at the upper resistance.
Place a stop-loss slightly above the resistance zone to minimize potential losses.
Target the lower support area around the $51,650 to $50,650 range for potential take-profit levels.
Monitoring Bitcoin's behavior near the wedge's upper boundary is crucial to anticipate the next move.
Disclaimer: This analysis is for informational purposes and is not financial advice. Always stay updated with market movements and adjust your trading strategies as needed.
You can DM us for information on any other coin.
@Peter_CSAdmin

Two scenarios for Bitcoin, will Bitcoin ATH?The last scenario I had for Bitcoin reached Target.
Now the price is involved in a strong resistance zone, and there is a possibility of breaking this price zone. If you see a sell confirmation in the 1-hour timeframe, you can think about the short position.
Scenario 1 is that Bitcoin reaches the price zone of 68,250 to 70,000 thousand dollars, after that we see weakness in the upward trend and enter a sell position after receiving confirmation in the 1-hour time frame.
Scenario 2 is that Bitcoin breaks the price zone of 68,250-70,000 dollars and stabilizes above it and tries to break the last price ceiling and register a new ATH.

$BTC Daily update - LONGCRYPTOCAP:BTC #BTC Turned given resistance at $61,953 into a support, Previous daily close looks amazing, possible upside likely towards $65,789 resistance test as bullish engulfing forms on current Daily, previous weekly close also with dragonfly doji with positive volume, tons of great signs that #Bitcoin is looking great, $64,344 currently resisting, $63,544 support not yet tested so $62,580 is current and possibly a key support moving forward.

BTC/USDT Long Update
Bitcoin's price action continues to develop within the descending broadening wedge pattern, highlighting a potential bearish trend as it faces resistance at the upper levels. As indicated in the chart, the repeated rejections suggest that the price might move downward toward the support levels.
Bitcoin has faced multiple rejections at the top of the wedge, each time leading to a significant downward move.
The large red arrows in the chart indicate the potential risk of further downward pressure if the price fails to break above the resistance levels.
If the price fails to break out to the upside, a drop towards the lower trendline of the wedge could be expected.
Waiting for a confirmed breakout above the descending wedge is crucial to enter a long position.
Implement a stop-loss below the lower boundary of the wedge to manage risk.
If a breakout happens, monitor the key resistance zones around the $66,000 to $70,000 range for possible profit-taking.
Monitoring Bitcoin's movement around these critical levels will provide insights into the potential bullish or bearish breakout. Let me know if you need a more detailed analysis!
Disclaimer: This analysis is for informational purposes and is not financial advice. Always stay updated with market movements and adjust your trading strategies as needed.
You can DM us for information on any other altcoin.
@Peter_CSAdmin

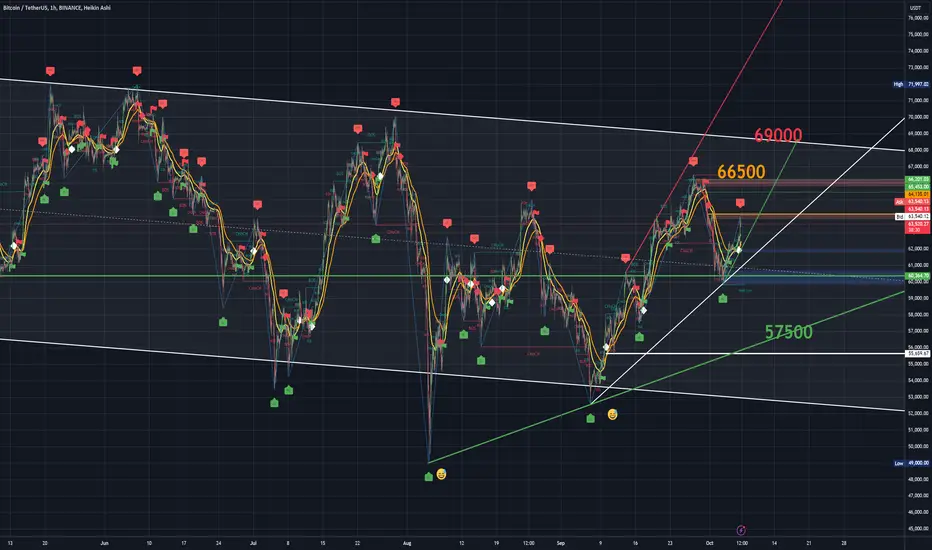
BTC DAILY ANALYSISAfter taken sellside of swing low and creation of fvg we will see a retracement of the price in fvg after that we will see an expansion to taken liquidity buy side of previous daily high at the price 66500

$BTC DAILY ANALYSISDaily Swing is Bullish , Daily Internal Bearish
After Bullish BOS ( Break Of Structure ), we are having corrective pullback to the downside and price already has mitigated weekly demand range in August. Although a deeper mitigation to the level of $44.000 is very likely imo, we are currently bullish in recent minimal structure so if price keeps pushing and we get a daily candle closure above $64.450, I personally don't think the supply zone between 64.800-66.400 will cause a strong bearish momentum. And I will be following the price in LTF to catch any short positions in this recent daily supply zone, but longs are more probable as I don't think this supply will hold for long.
The main Supply range, 67.000 - 70.000, is where I will be looking for confirmation short setups until I see daily internal structure switch to bullish.

BTCUSDT 1D for me a long cup of coffeeBTCUSDT 1D for me a long cup of coffee
If you like my AT, and you agree with the approaches, please FOLLOW ME and press BOOST so we can share it with more people. We are working on an automated Trading tool so that everyone can apply their strategies VISUALLY and PROFESSIONALLY, as we present in the analysis.
Thank you!
____________________________________________________________________
BTCUSDT 1D for me a long cup of coffee
Right now we are in an erratic zone in BTC where anything can happen within the handle formation.
It could fall again until it touches the base of the dynamic support and rise again until it reaches the neck of the cup or resistance zone at 70k.
If 49k was the lowest part of the handle, we have to start building ascending lows and break the flag resistance. That is what we have to watch out for.
:GOAL: 120000
To see the forest as a whole, we cannot be inside the forest, because there we will only see trees :)
__________________________________________________________________
Automated Cryptocurrency Trading Bots:
All these strategic alternatives can be configured with TradeX BoT, since it will allow you to position in both directions without having to block any amount per position. It will only be necessary for the conditions to be met, either downward or upward, for the orders to be executed in one direction or another, taking the necessary deposits from your portfolio.
TradeX BoT (in development): Tool to automate trading strategies designed in TradingView. It works with both indicators and technical drawing tools: parallel channels, trend lines, supports, resistances... It allows you to easily establish SL (%), TP (%), SL Trailing... multiple strategies in different values, simultaneous BUY-SELL orders, conditional orders.
This tool is in the development process and the BETA will soon be ready for testing.
FOLLOW ME and I will keep you informed of the progress we make.
I share with you my technical analysis assessments on certain stocks that I follow as part of the strategies I design for my portfolio, but I do not recommend anyone to operate based on these indicators. Get informed, train yourself and build your own strategies when it comes to investing. I only hope that my comments help you on your own path :)

BTC 3D AnalysisHere is an analysis for Bitcoin on 3 day time frame. Once it break the down trendline and good retest done we can expect a good profit. Expected targets are given on chart. Can we see this play? Please comment. DYOR. NFA.

The BTC/USDT 1-day chart shows the following key technical pointBitcoin is currently trading within a descending channel, which indicates a continuation of the bearish trend unless there is a breakout.
There is a crucial resistance area around the $66,000 to $70,000 range. BTC may struggle to break above this level without strong bullish momentum.
The chart shows a lower trendline acting as support, which is currently located around the $50,000 level. If BTC breaks below this level, it could lead to a more significant decline.
The purple line on the chart represents a moving average that has acted as both support and resistance in the past. BTC is currently trading below this moving average, indicating a bearish sentiment.
Disclaimer: This analysis is for informational purposes and is not financial advice. Always stay updated with market movements and adjust your trading strategies as needed.
You can DM us for information on any other altcoin.
@Peter_CSAdmin

BTC LONG The chart right presents the pre bullmarket btc chart in 2020.
Strategy:
Potential long setup from the consolidation zone. The price action indicates a demand zone around the current levels, with a potential for reversal towards higher levels, as shown in the shaded blue area. The right-hand chart supports this bullish bias.
Entry: Around the current price levels (consolidation)
Stop-loss: Below the local support (recent swing low)
Risk management is essential, considering the current volatility and broader market correlation.

BTCUSDT 1H - This impulse could break the flag structure to the BTCUSDT 1H - This impulse could break the flag structure to the upside.
That's all there is to it. BTCUSDT has stopped falling at around 60K and is gaining a strong momentum that could finally lead it to break the resistances above it. As always, we must pay attention to the dynamic SLs for our decision making. Those of you who are already on the ship can prepare to go to the moon.
Don't forget to fasten your seatbelts and keep an eye on the dynamic SLs in case the ship turns over :)
This weekend we had a bearish EMA 50 - 100 crossing up to 60000 and now we have a BULLISH EMA 50 - 100 crossing that counteracts all the strength of the previous impulse in a support zone.
Below 60000, we would be out until it takes that level again.
All these strategic alternatives can be configured with TradeX BoT, since it will allow you to position in both directions without having to block any amount per position. It will only be necessary for the conditions to be met, either downwards or upwards, for the orders to be executed in one direction or the other, taking the necessary deposits from your wallet.
TradeX BoT (in development): Tool to automate trading strategies designed in TradingView. It works with both indicators and graphic design tools: parallel channels, trend lines, supports, resistances... It allows you to easily establish SL (%), TP (%), SL Trailing... multiple strategies in different values, simultaneous BUY-SELL orders, conditional orders.
This tool is in the development process and the BETA will soon be ready for testing.
FOLLOW ME and I will keep you informed of the progress we make.
I share with you my technical analysis assessments on certain stocks that I follow as part of the strategies I design for my portfolio, but I do not recommend anyone to operate based on these indicators. Get informed, train yourself and build your own strategies when it comes to investing. I only hope that my comments help you on your own path :)
BTC/USDT CHART UPDATE !Bitcoin is approaching a crucial resistance area (highlighted in red), which has historically acted as a strong barrier to upward price movement.
The chart suggests a potential bullish scenario where BTC could break the descending trendline and head toward the resistance area. If it successfully breaks this level, it could continue the uptrend.
An alternative scenario is highlighted on the chart with a red arrow, indicating the possibility of a bearish rejection from the resistance area. If Bitcoin fails to break this level, it could face a pullback towards lower support levels.
The lower green trendline represents a key support area. If the rejection occurs, BTC could retrace towards this trendline, which is around the $50,000-$52,000 range, which offers strong support. The chart shows two possible outcomes: A breakout above the resistance zone could lead to further gains. Failure to break the resistance could result in a downward move towards lower support levels. This dual approach highlights how BTC performs near the resistance zone in determining the next direction of the trend.
Disclaimer: This analysis is for informational purposes and is not financial advice. Always stay updated with market movements and adjust your trading strategies as needed.
You can DM us for information on any other altcoin.
@Peter_CSAdmin

BTC/USDT 50MA CHART ANALIYSIS !The BTC/USDT 1-day chart shows a crucial confluence area, with the 50-day moving average (5OMA) acting as support. Here is a detailed analysis: The resistance area is a strong horizontal resistance area marked in red between $66,000 and $72,000. This area has historically been a supply zone where sellers emerge.
Bitcoin is currently holding above the 50-day moving average (red line). This level is important because traders often use it as a key dynamic support or resistance point.
The chart has a green arrow pointing to a potential upside move. If Bitcoin can maintain support above the 50-day moving average and break the descending resistance (white trendline), it could challenge the $66,000-$68,000 area. Failing to sustain above the 50-day moving average could push the price towards the lower green trendline, around the $55,000-$58,000 area, which acts as a broad support zone.
Bitcoin is in a crucial range, with bullish potential if it breaks above the descending trendline and crosses the $66,000-$72,000 resistance zone. However, a breakdown below the 50-day moving average could trigger further declines.
Disclaimer: This analysis is for informational purposes and is not financial advice. Always stay updated with market movements and adjust your trading strategies as needed.
You can DM us for information on any other altcoin.
@Peter_CSAdmin

Bitcoin Trading into Weekly FVG | Bottom might be inIn this video, I break down Bitcoin’s current price action as it moves into the weekly Fair Value Gap (FVG).
This could present a strong swing trade opportunity, aiming for long-term price targets of over $100,000! 📈
🔍 What to expect:
In-depth analysis of the weekly FVG zone
Evaluation of current market structure and potential support levels
Intraday perspective to identify short-term entry and exit points

BTC biasBTC is still bullish we are just facing a short term retracement before actual pump start
Follow for market update
Wait for 58k or 59k before considering going long

According to the BTC/USDT 1-day chart !According to the BTC/USDT 1-day chart, the strong resistance level around $67,800 is an important area to watch for the following reasons:
The $67,800 level historically serves as a significant resistance point, closely aligning with the upper boundary of the recent supply zone. Many traders and investors have likely placed sell orders or profit-taking levels around this price, increasing the chances of BTC hitting resistance when it approaches this area.
The price currently respects the descending trendline and the $67,800 level is aligned with this trendline resistance. This convergence of factors strengthens the resistance, making it an important area to monitor for potential selling pressure.
Based on recent price action, trading volumes usually decrease when BTC reaches higher resistance levels, but strong volume rejection around $67,800 could trigger bearish momentum. On the other hand, a breakout above this level with strong volumes could signal a significant bullish momentum.
As BTC approaches the $70,000 mark, levels like $67,800 become psychologically important, where traders may turn cautious, and large sell orders may accumulate, acting as a barrier.
If BTC breaks above $67,800 decisively with strong volumes and momentum, it could signal a trend reversal and a potential move toward the $72,000 – $75,000 range.
Rejection at this level and other bearish signals (such as overbought conditions or trendline resistance) could lead to a retreat to lower support levels around $60,000 or $55,000.
Do you want me to adjust the analysis or add more details on a specific aspect?
Disclaimer: This analysis is for informational purposes and is not financial advice. Always stay updated with market movements and adjust your trading strategies as needed.
You can DM us for information on any other altcoin.
@Peter_CSAdmin
