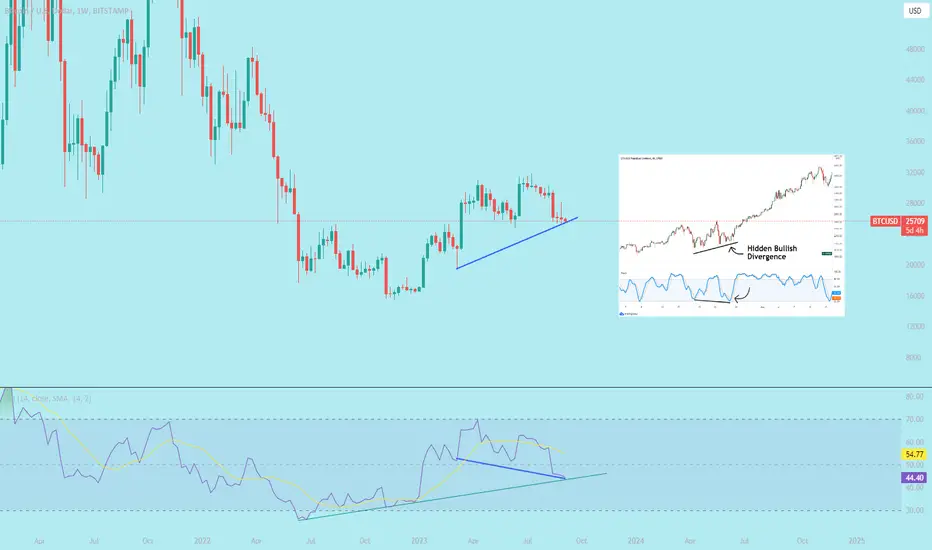
$BTC 1W showing Hidden BullishCRYPTOCAP:BTC 1W showing Hidden Bullish
What Is Hidden Divergence?
Hidden divergence is created when the price of a cryptocurrency carves a higher low, while the indicator creates a lower low. Typically a hidden divergence can also be categorized by a bullish or bearish hidden divergence.
For example, a bullish hidden divergence happens during a correction of an uptrend when the value of an asset makes a higher low. However, the oscillator is still showing a lower low. This usually translates that the bullish trend continuation signals trader to take profit.
Bearish hidden divergence, on the other hand, is the opposite. Meaning the value of an asset makes a lower high, but oscillators are showing a higher high. This signals a trend reversal in which a trader should stop loss and sell-off as soon as possible.
Btclong
BTC local movesIts been 5 days BTC is in the range.
Every move up gives good opportunity for Alts to Pump and every move down - Alts immediately bleeding
On LTF BTC can give some bullish moves. We can expect bounce until 26500$ - 27100$ with, high probability, bearish reaction from these price levels. (n.1)
If BTC will manage to close with D candle above 27200$ - then it will bring more chances for continuation of the uptrend. (n.2)
If you see that BTC is closing with 4 H candle below 25500$, then expect that BTC will drop even more towards to 24000 - 23500$

BTC/USDT 1DAY UPDATE BY CRYPTO SANDERS !!Hello, welcome to this BTC/USDT update by CRYPTO SANDERS.
CHART ANALYSIS:- Bitcoin was trading below 26,000 on Labor Day, as volume in the cryptocurrency market was mostly lower.
BTC/USD slipped to an intraday low of 25,817.03 to start the week, following a high of 26,087.15 the day prior.
The decline pushed Bitcoin closer to a collision with support at $25,600, however, bulls have so far rejected this retracement.
This comes as the 14-day relative strength index (RSI) found a floor of its own at the 35.00 mark, helping to ease the bearish pressure.
the index is now tracking at 37.16, with the next visible resistance point at 43.00.
In the event that this ceiling is broken, BTC bulls will likely make advancements toward 28,000.
I have tried to bring the best possible outcome to this chart.
Hit the like button if you like it and share your charts in the comments section.
Thank you

XMR LONG SignalGot a Long signal on MONERO USDT, usually the XMR Signals do work out with a winrate of 83%.
Once the algo closes the trade i will update the idea here, stay tuned

BTC/USDT 1DAY UPDATE BY CRYPTO SANDERS !!Hello, welcome to this BTC/USDT update by CRYPTO SANDERS.
CHART ANALYSIS:- Bitcoin continued to trend lower on Saturday, as the bears were once again in control of crypto market sentiment.
Following a high of 28,148 on Tuesday, BTC/USD started the weekend falling to a low of 25,362.61.
The decline has come as a result of profit-taking, and also the changing economic climate in the United States.
Consumer spending is slowing, whilst the labor market remains tight as a result of increasing interest rates.
today’s decline pushed bitcoin below a key support point of 25,600, however, bulls have since reentered.
BTC is now trading at 25,818.66, with a target of 26,000 likely to be present throughout the weekend.
I have tried to bring the best possible outcome to this chart.
Hit the like button if you like it and share your charts in the comments section.
Thank you

BTC/USDT 1DAY UPDATE BY CRYPTO SANDERS !!hello, welcome to this BTC/USDT update by CRYPTO SANDERS.
CHART ANALYSIS:- Bitcoin moved back over the 28,000 level during the last several hours, following Grayscale’s court win over the Securities and Exchanges Commission.
After trading at a low of 25,998.08 earlier in the day, BTC/USD peaked at 28,089.34 late on Tuesday.
This pushed the world’s largest cryptocurrency to its highest point since August 17, when the price was on the cusp of 29,000.
Earlier gains have since fallen, as traders have seemingly captured profits, with bitcoin now trading at 27,353.52.
this comes as the relative strength index (RSI), reached a ceiling of 53.00, before falling lower.
the index is now tracking at 48.52.
I have tried to bring the best possible outcome to this chart.
Hit the like button if you like it and share your charts in the comments section.
Thank you

Bitcoin - LONGIn my previous posts i called this move down to 27k. However, i didnt have the patience to stay with that idea. However, it ended up playing out. Lot of fear on the timeline right now, This is a solid support area, if it fails ill look to 25k. I think this will look like a great buy within a few weeks.

Channel tradingHow to trade channels after sharp moves, where there is a valid money flow in the market.
During this short video I just described one of very common and useful techniques that is applied for channel trading, which is for this video scalping, but it applies to all time frames.
Here you need to get confirmation and be patient for pull back, it is important to put your stop loss precisely and of course be loyal to it (please do not move it)
Put the stop loss under that shadow but with enough space for breathing

BTC update#BTC update...
As TVC:DXY shows weakness and goes for a correction, #bitcoin has a chance to catch its breath towards ~29/30k...
Volatility is back... Here are my points of interest to go long or short...

BTC Elliot Wave + Fib ExpectationBullish case for BTC over the next 2 quarters. Possible run up to 28, with a shallow correction, another run to 30-32k.. then re-evaluate..

Bitcoin scalping ideaBINANCE:BTCUSDT.P
Possible Targets and explanation idea
➡️We got Daily FVG marked with levels
➡️On 1H timeframe 3 main pools, 2 of them we swiped
➡️Walk from liquidity to another liquidity. now road to 27761 and 28701
➡️ At this levels need to see price reaction from sellers.
➡️ If there is no reaction road to 35-48 possible in October till May 2024 if we take a look globally
Hope you enjoyed the content I created, You can support with your likes and comments this idea so more people can watch!
✅Disclaimer: Please be aware of the risks involved in trading. This idea was made for educational purposes only not for financial Investment Purposes.
---
• Look at my ideas about interesting altcoins in the related section down below ↓
• For more ideas please hit "Like" and "Follow"!

Usdt.d(based on NEo wave)I think it may be is bow tie pattern and we can take long positions on btc and eth.
The red line is stop loss and the target is black line!

Will BTC continue its dump or it'll surprise everyoneHi dear community members, my lovely and loyal followers, I hope you are fine and make good trades.
I haven't published analyses for 2 months coz I expected #BTC to dump towards 26.5-27K as I mentioned in my tweets/ which you can check on my previous publications.
BTW I warned about this dump back on June 24th when BTC price was 31500/ almost at the top/ but I didn't expect that BTC will go below 26K in any case we haven't seen daily candle close below it)).
Now I'm looking at daily timeframe and as you see BTC cleared/swept all SSL and felt all imbalances below 28.5K, even it took out previous major swing low/EQL/ below 24.7K and hit daily bullish OB. If we measure the recent move from 31,850 to 24.7K it is below 100% projection of previous move from 31059 to 24.7K.
I'm sure BTC bottomed on August 18th at 24.5K and after some types of consolidation between 25-28K, which will last about 2-4 weeks, BTC will start its major impulse move towards 37-38K even higher. I marked upcoming move with pink line.
I also mentioned the most critical level on the chart /RED zone/, which has to be respected by bulls in the worst case to provide upcoming bullish movement otherwise game is over for bulls.

BTC/USDT 1DAY UPDATE BY CRYPTO SANDERS !!hello, welcome to this BTC/USDT update by CRYPTO SANDERS.
CHART ANALYSIS:- Bears continued to circle Bitcoin (BTC) to start the weekend, as the cryptocurrency had its biggest one-day decline since the collapse of FTX.
BTC/USD dropped to a low of 25,668.92 on Saturday, which comes less than 24 hours after trading at a high of 26,598.65.
bitcoin remains close to a two-month low, with some traders targeting a breakout below 25,000.
the relative strength index (RSI) is deep in bearish territory, with a current reading of 18.56.
Price strength hasn’t tracked below 20.00 since January last year, which for some was the beginning of the so-called “crypto winter”.
Should there be further declines this weekend, the target will likely be a support point of 24,900.
I have tried to bring the best possible outcome to this chart.
Hit the like button if you like it and share your charts in the comments section.
Thank you

BTC/USDT 1DAY UPDATE BY CRYPTO SANDERS !!hello, welcome to this BTC/USDT update by CRYPTO SANDERS.
CHART ANALYSIS:- Bitcoin (BTC) bears pushed the cryptocurrency to a two-month low on Friday, following the news that Spacex had liquidated its holdings in BTC.
After peaking at 28,525.11 during Thursday’s session, BTC/USD plunged to a bottom at 25,409.11 late last night.
This was the weakest point that Bitcoin had fallen to since June 16, when the price was near a breakout below 25,000
it appears that the sell-off came as the 14-day relative strength index (RSI) fell deep into oversold territory.
The index is now tracking at 20.10, the lowest level it has hit since January 2022, which ironically was when Tesla began to sell off its own holdings in Bitcoin.
Price has somewhat rebounded from earlier lows, and is now trading at 26,041.67.
I have tried to bring the best possible outcome to this chart.
Hit the like button if you like it and share your charts in the comments section.
Thank you

BTC LONG TERM Since the end of March, the market has been experiencing a low-volume phase .
Currently, even though we observe a potential double top formation, the market is unpredictable.
Our $40,000 expectation remains unchanged, but before that, there are two highly possible scenarios:
1 - Making a new bottom around the $28,300 level and continuing its path.
2 - Performing a liquidity cleanup between $25,250 and $26,000 and continuing its path.
Whichever of these two scenarios unfolds, it will present a buying opportunity for us.

#BTC 🟢 M15 LONG (Bitcoin). Long awaited failure 📣For more than one week, Sellers have been gaining selling positions... Although they haven't reached the main selling zone 32k. But there was an impressive sale .. and at the same time, grandiose discounts for 26.2K, who didn’t have time - he didn’t have time)
On the retest of the M15 imbalance near our D1 Buy Zone, we expect a hike up and a breakout of the long-awaited level of 31K.
Entry price below market opening price.(✔️)
M15 imbalance at the potential of the D1 range.(✔️)
Below the First Buyer of Exchange Options.(✔️)
According to CFTC futures reports, SHORTS prevail so far. 12851/14261 .(⚠️)
input: 26560 (on test/retest)
sl: 26223
tp1: 26898
tp2: 27566

2023-08-18, BTC 1D CHART: Bottom Rocket RefuelingThis month we are witnessing the 2nd refueling to go to the moon estimation of $65K.
This is actual chart (not the logarithmic chart). You would be able to see my same ideas from previous published post.

📈Bitcoin prediction, 26.5K or 31.5K? 📉BINANCE:BTCUSDT
COINBASE:BTCUSD
Hello dear traders
Due to the decrease in trading volume in the last few weeks, I'm going to do some weekly Bitcoin analysis.
In the next few days, Bitcoin is expected to return to the $31,000 range if it holds above the indicated areas (29600-29800).
If the price breaks below the mentioned areas, the price will drop to the level of 28,460 and then 26,500.
✌💥If you are satisfied with my analytical content, please share my ideas💥✌
✍🐱👤Otherwise, make sure you leave comments and let me know what you think.🐱👤✍
🤑🍾Thank you for your support. I hope you will gain profit by following my analyses.🍾🤑

BTC/USDT 1DAY UPDATE BY CRYPTO SANDERS !!hello, welcome to this BTC/USDT update by CRYPTO SANDERS.
CHART ANALYSIS:- Bitcoin (BTC) Bitcoin (BTC) was trading in the red for the majority of the day, as price consolidated prior to the release of U.S. retail sales data.
After peaking at 29,660.25 to start the week, BTC/USD fell to a low of 29,272.35 earlier in today’s session.
Since moving above 30,000 on August 8, the world’s largest cryptocurrency has mostly trended sideways.
One reason for a lack of direction appears to be due to the relative strength index (RSI) tracking between a support and resistance of its own.
The index is currently at a reading of 47.57 and has mostly moved between a floor at 47.00, and a ceiling at 49.00 in recent days.
For bulls, a breakout above the 49.00 zone will also likely be the straw needed to break the camel’s back.
I have tried to bring the best possible outcome to this chart.
Hit the like button if you like it and share your charts in the comments section.
Thank you

$UNFI looks Bullish If break TrendlineNYSE:UNFI looks Bullish If break Trendline
This beast wakeup anytime
Price broke the trend and consolidating above the Trend.
Pump is loading 🚀 ⌛

$RUBE Adam and Eve Pattern Performing in 1dWhat is the Adam and Eve Chart Pattern?
Adam and Eve is a bullish and bearish reversal chart pattern that appears in a downtrend or uptrend. The pattern was first mentioned in the book Encyclopedia of Chart Patterns by Thomas Bulkowski, and until these days, it is a relatively unfamiliar classical chart pattern to many traders worldwide.
In essence, Adam and Eve is a variation of double top and double bottom patterns and is only slightly different from the traditional double bottoms/tops. The pattern is marked by the first bottom or top, the Adam, then the price moves up or down and creates another U-shaped where we can see Eve.
So, instead of having two peaks like in the double top or double top (or three peaks for the triple bottom and the triple top pattern), Adam and Eve is formed by two highs – the first is a peak while the other has a round shape.
Overall, it is an excellent chart pattern to find entry levels as it gives you double confirmation of the price failing to break above or below a specific price level.

$STMX breakout Bullish SymmetricalWhat is a Symmetrical Triangle
A symmetrical triangle is a chart pattern characterized by two converging trend lines connecting a series of sequential peaks and troughs. These trend lines should be converging at a roughly equal slope. Trend lines that are converging at unequal slopes are referred to as a rising wedge, falling wedge, ascending triangle, or descending triangle.
KEY TAKEAWAYS
Symmetrical triangles occur when a security's price is consolidating in a way that generates two converging trend lines with similar slopes.
The breakout or breakdown targets for a symmetrical triangle is equal to the distance between the initial high and low applied to the breakout or breakdown point.
Many traders use symmetrical triangles in conjunction with other forms of technical analysis that act as a confirmation.
