BTC - The moment of Truth, Big move in upcoming 12 days#BTC/USD Chart
I am expecting BTC to make a big move between now and the upcoming 12 days (so 13 sept the latest). Currently BTC is in a falling wedge and the MACD could turn bearish on the 3D if the price continues to fall.
I expect a upmove. Same movement / pattern like the "power of 3"
1. Accumulation (we had this)
2. Manipulation (currently happening)
3. Expansion - big move upside (expected to happen before 13 sept)
If BTC breaks down again, which seems unlikly but all is possible, it will look very bad for the bulls.
💻 Press the "boost"🚀 button if you agree
Btclong

Bitcoin Pattern At The Start Of A Catastraphic Down Move!*Disclaimer: Not Financial Advice*
IMPORTANT: By Now We have quadruple bearish RSI divergence and double bearish divergence on Stoch RSI
BTC all time high pattern is repeating right now (purple rectangle) I've talked about it in video - EVEN the divergence are the same.
DXY Broke the descending wedge and is consolidating , with todays news it could surge up which will follow in BTC,SPX,NQ1 sell off
*Strongly Encourage to watch this until the end*
PLEASE consider SUPPORTING Me by Boost,Follow,Comment and Sharing-

BTC - Pullback , ready for long long position !? #BTCit looks like we 're seeing a pullback BINANCE:BTCUSD .
everything is clearly visible in the chart
MAX Leverage = 5 - 10 (above 5 is a greedy decision!!!)
Max Loss (with leverage 5 ) = ~20%
Max Profit (with leverage 5 ) = 35 - 65%
|--| 70% sell in first target and 30% for next target |--|
always DYOR , Buy and sell with full knowledge of financial markets.
Maybe This Way , Lets See that ...

$btc long | $30k min tpbtc is struggling to break this eq and feels like it's going to hold.
had a similar setup with eth last week, where we refused to drop.
on 12h (posted in comments) we have rsi holding bull side eq and AO has reset.
as much as we wanted the drop, i think this is the safer RR play.
RR at 5.06 to ride to $30k.


BTC Pattern showing Strong Bearish Sentiment More Than Ever!!Two new BTC bearish pattern (one mentioned at the start that will blow your mind)
Bitcoin Exited the Orange parallel channel and is consolidating below the support of the blue parallel channel
Stoch RSI on weekly is at its peak and needs to come down which will follow by heavy sells & Head and shoulder still in play
Dxy doing a descending wedge which is bullish.Ive talked about it in video cause its very important
SPX is in a big bear flag - could rally up and form bearish divergence
Strongly recommended to watch it untill the end.lots of important information and signals
Please Consider Supporting Me By Boost,Follow,Comment

BTC/USD 1DAY UPDATE BY CRYPTO SANDERSHello, welcome to this BITCOIN /USD update by CRYPTO SANDERS.
CHART ANALYSIS:-Bitcoin ( BTC ) There was a move back above the 28000 level on Saturday as the market continued to react to the latest NFP report.
Payrolls came in at 236,000, marginally lower than the 240,000 many were expecting.
After trading at a low of 27814.00 BTC/USD rose to a high of 28159.86 in today's session.
An increase in price comes when the Relative Strength Index (RSI) bounces off its low at 58.00.
The index is tracking at 59.07, which has helped delay the inevitable downward cross with the 10-day (red) moving average and its 25-day (blue) counterpart.
BTC is trading at 28,059.28.
I have tried to bring the best possible outcome to this chart.
Hit the like button if you like it and share your charts in the comments section.
Thank you.

BTC Weekly Update | Will we wait for a good climb ? (LONG)After many struggles, BINANCE:BTCUSDT (Bitcoin) was able to start a green jump with very good candles.
Goals ahead :
** First - 25,000 is a strong resistance.
** Second - If 25,000 is broken and stabilized, it will have the ability to reach 30,000 .
Simple is better than complicated
Maybe This Way ...

BTC Breaking OUT..?Price is already trapped inside ascending triangle
and consolidation but converging for almost a month
now. We can expect Breakout on upcoming NFP or before
new week starts.
Once breakout of this zone we'll enter
SHORTS or LONGS accordingly.

BTCUSDTHey folks here is the analysis for Bitcoin and here is the target for Bitcoin but make it is just potential target but not valid until isn't breakout 👍

BTCUSDTNear the midline, there is hope for an upswing🦬
The beginning of the second upward wave
Back to the 0.618 Fibonacci area for a correction
4-hour powerful PRZ defeat
TP
Moving towards 1.27 Fibonacci

BTC/USD 1DAY UPDATE BY CRYPTO SANDERS !!Hello, welcome to this BITCOIN /USD update by CRYPTO SANDERS.
CHART ANALYSIS:-Bitcoin ( BTC ) was once again trading under $28,000 on Thursday, as markets began to prepare for tomorrow’s non-farm payrolls report.
BTC/USD dropped to an intraday low of $27,831.56 in today’s session, which comes less than 24 hours after trading at a high of $28,714.22.
The move came as bitcoin bulls were unable to sustain a breakout of a key resistance level of $28,500.
Looking at the chart, this latest drop in price came as the 14-day relative strength index (RSI) dropped below a floor of 58.00.
As of writing this, the index is now tracking at 57.80, with the 10-day (red) moving average nearing a downward cross with its 25-day (blue) counterpart.
Should sentiment remain bearish, there is a strong possibility that BTC will fall to a floor at $27,000.
I have tried to bring the best possible outcome to this chart.
Hit the like button if you like it and share your charts in the comments section.
Thank you.

BTC long plan if btc play on range then the first one likely to stand out if not it might go lower and sweep the liquidity and then heading for 30k+

BTC/USD 1DAY UPDATE BY CRYPTO SANDERS !!Hello, welcome to this BITCOIN /USD update by CRYPTO SANDERS.
CHART ANALYSIS:-Bitcoin ( BTC ) broke out of a key resistance level on Wednesday, with traders now targeting a move beyond the $29,000 mark.
Following a low of $27,979.75 on Tuesday, BTC/USD moved to an intraday high of $28,739.24 earlier in today’s session.
The move saw Bitcoin climb above a recent ceiling of $28,500, hitting a four-day high in the process.
Overall, it appears that the move occurred once the relative strength index (RSI) bounced from a recent floor at 58.
As of writing, the index is tracking at 62.48, with the next visible ceiling of 65.00 as a possible target for bulls.
There is a strong possibility that BTC will be above $29,000 if and when this resistance point is hit.
I have tried to bring the best possible outcome to this chart.
Hit the like button if you like it and share your charts in the comments section.
Thank you.

BTC Price Action and Behaviour Analysis (Multi timeframes)First of all, let's discuss the 1D time frame. The primary thing to notice here is the bull rally of the BTC. Price is moving upward by making HH and HL as per DOW theory. Price is moving in a parallel ascending channel and respects the lower trend line of the channel.
One thing to notice here is that Price did a fake-out on 10 March by making a LL and then continuing in the previous direction. It was to liquidate the retailers.
Now let's talk about the retracement levels of the BTC. The first bull rally was till 24k and then we saw a retracement to 0.68 fib level. Then we observed the second bull rally up to 25. The time period from one HH to the next HH was 22 days.
After that, we saw the LH which goes to 1.41 fib level. Then the next HH took 32 days to reach the 32k level.
Now the BTC is in a small distribution phase before jumping into the next HH.
1H Analysis and Bisa
Price is testing the parallel ascending channel's support and RSI is around 38. Now the most likely scenario is that it will test 28665 in a day or two. So one can go long from here.
One the bigger picture, the price can go up to 30k than 31k and 32k respectively.

BTC/USD 1DAY UPDATE BY CRYPTO SANDERS !!Hello, welcome to this BITCOIN /USD update by CRYPTO SANDERS.
CHART ANALYSIS:-Bitcoin ( BTC ) continued to trade close to a key resistance level on Tuesday, as volatility in the market remained high.
BTC/USD rose to a peak of $28,433.74 earlier in today’s session, which follows up from a low of $27,276.72 on Monday.
As a result of today’s surge, bitcoin moved near its recent price ceiling of $28,500, however, bulls were not able to reach this point.
Looking at the chart, this seems to be because the relative strength index (RSI) continued to hover near a floor of 60.
As of writing, the index is tracking at 61.00, with the next visible ceiling of 65.00 as a possible target for buyers.
Should this level be reached, there is a strong possibility that BTC will be trading above $28,500.
I have tried to bring the best possible outcome to this chart.
Hit the like button if you like it and share your charts in the comments section.
Thank you.

BTC did it 2 times in its whole history! at least 58K in 2023? Hi dear community and my loyal followers. As you remember I posted earlier if BTC monthly candle closes above 5D GC/ 25.8K/ better above middle line of weekly GC /27.6K/ #BTC downside action will be limited and it will hit min 58K in 2023)) based on 5D GC and 52K based on weekly GC. BTC managed to close monthly candle above 28476 USD which is above 5D GC upper band and middle line of weekly GC. BTC also succeeds holding 200 weekly MA and it is consolidating below 28.5-29.3K main resistance. As soon as it is broken 34-35K will be on the table. I expect BTC to consolidate between 25.2-29.2K for 3-4 weeks and give room for alts to explode. I expect mini alt season in April as soon as Total 2 main resistance is broken/look below/. BTW based on current projection, the most bullish cross in BTC history will occur on May 1 2023. It happened 2 times in its whole history/no false signals/ and it marked officially bull market start. Check that Monthly 8 & 21 EMA bullish cross chart below.
If you like my ideas, don't forget to like, comment and follow please. I will appreciate any single follow and any kind of support, thanks in advance.

BTC/USD 1DAY UPDATE BY CRYPTO SANDERS !!Hello, welcome to this BITCOIN /USD update by CRYPTO SANDERS.
CHART ANALYSIS:-Bitcoin ( BTC ) started the week consolidating around the $28,000 level, as volatility in crypto markets remained high.
Following a low of $27,607.67 earlier in today’s session, BTC/USD rose to a peak at $28,475.62 as the day progressed.
The move saw bitcoin move closer to a recent resistance level of $28,500, which was broken over the weekend.
The recent price consolidation comes as the 14-day relative strength index (RSI) failed to move beyond a ceiling of 65.00.
As of writing, the index is tracking at 62.00, which is also a key point of support for traders.
Overall, the world’s largest cryptocurrency is now trading 1.46% higher than at the same time last week.
I have tried to bring the best possible outcome to this chart.
Hit the like button if you like it and share your charts in the comments section.
Thank you.

BTC upward move is incoming🔥BTC has formed a bull flag pattern, and its very probable to break the upper edge of triangle, because of the good accumulation of past days in range of 26800~28500.
RSI and MACD shows that an upward move is incomin'.
it is necessary to mention that the fake news of interpol red notice to CZ published to hunt long poistions, before the main move.
Keep your eyes on BTC chart 👁️👁️
Target 31K~32K5 $. Marked in chart.
Good luck 👊🏿

Bullish Railway Track Pattern in 1 hour chart Hello,
What you see with a blue arrow is the bullish railway track pattern.
However, Patterns do fail.
So, as we are on the weekend, the volume will be low.
Even then if BTC moves higher than on Monday we will have a CME gap which will bring back the price to 28450.
So keep your trades safe.
PUT SL and trade with low lev.

BTC/USD 1DAY UPDATE BY CRYPTO SANDERS !!Hello, welcome to this BITCOIN /USD update by CRYPTO SANDERS.
CHART ANALYSIS:-Bitcoin ( BTC ) rose towards $29,000 on Saturday, as markets continued to react to yesterday’s consumption expenditure (PCE) figures in the United States.
PCE climbed to 0.3% in March, less than the 0.4% markets were expecting, showing that inflation was slowing.
BTC/USD rose to an intraday high of $28,802.46 earlier in today’s session, which comes a day after trading at a low of $27,854.63.
Looking at the chart, the move saw BTC briefly breakout of a long-term resistance level of $28,500.
Earlier gains have since declined, which comes as the 14-day relative strength index (RSI) failed to move beyond a ceiling at 65.00.
As of writing this, the index is now tracking at 63.65, with a floor of 62.00 a possible target for sellers.
I have tried to bring the best possible outcome to this chart.
Hit the like button if you like it and share your charts in the comments section.
Thank you.

Bitcoin broke the resistance above into April #EasterBullRun !!!I have been following bitcoin for the past 3 months trying to catch the bottom and top of this rally, It's not an easy task so I urge you to take my word as an Easter gift because #BTC just broke the line resistance line above 28K. #EasterBullRun #EasterBullish
As usual, We all know it's not possible to catch the top or bottom of any market but 80-90% accuracy is enough to make you win big !!
Just buy $BTC and hold till 100k !!

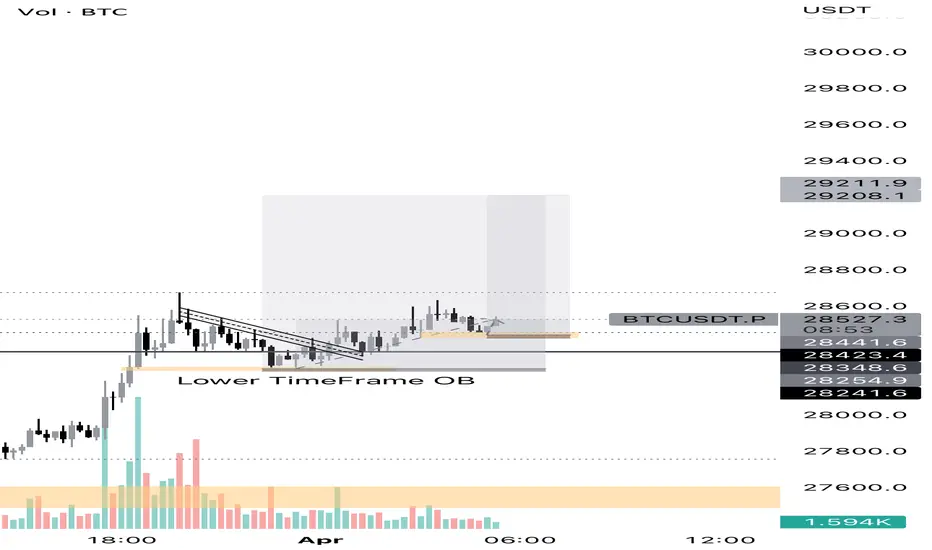
Btc Giving another long 1:40 RR TradeThis is a continuation of my previous trade where we bought BTC at 28255 and will hold till 29200 having our stooss at 28235. So we know the current trend is bullish, price created an imbalance between 28420-28450 we trader that and will hold till 29200