BTC Daily-- LONG ABOVE 29K!Here are some Fib levels that demonstrate entry and targets for bitcoin IF we can break out of the current range (Above 29k). Best practice is to move stops up at each target as it is broken. As can be seen, there is a lot of confluence between the fib levels and support/resistance zones on the daily chart.
Btclong

#BTCUSD - A Break of this Zone Indicates a Pump to 28.8k!So, our last Short trade had some good open profits running until those huge green bars happened!
Not to worry, we can't win them all, a small loss of a few percent is ok in the grand scheme of things!
Looking at this chart now it appears #BTC has formed a new lower supportive trend line and has broken one key level of resistance, a break through the next level would make #BITCOIN unstoppable up to almost 29k!
_________
What Do You Think?
If you enjoyed or agree with this idea - drop us a comment, like & follow! 😀
Ideas by theCrypster meet the guidance notes and disclaimer as mentioned below and within our website. See Signature for more info! ✌️
🔥🔥🔥
Crypto Tipster v2
theCrypster
🔥🔥🔥

BTC/USD 1DAY UPDATE BY CRYPTO SANDERS !!Hello, welcome to this BITCOIN /USD update by CRYPTO SANDERS.
CHART ANALYSIS:-Bitcoin ( BTC ) moved to its highest point in nine months, despite cryptocurrencies mostly consolidating ahead of the upcoming U.S. GDP report.
Following a low of $28,155.83 on Wednesday, BTC/USD raced to an intraday peak of $29,159.90 earlier in the session.
As a result of this surge in price, bitcoin climbed above the $29,000 level for the first time since June 10.
Looking at the chart, the move came as BTC briefly broke out of resistance at $28,500, with the relative strength index (RSI) moving past a similar threshold.
As of writing, the index is tracking at the 65.27 level, which is marginally above its ceiling of 65.00.
Overall, BTC bulls have moved to secure some of their earlier gains, with the price now trading at $28,582.20.
I have tried to bring the best possible outcome to this chart.
Hit the like button if you like it and share your charts in the comments section.
Thank you.

BTC WEAKPreparing to short btc. Still no confirmation (red circle) gonna wait for more distribution. Seeing weakness when I look at all of my strategies, but there is no point to go in now I think. Possible to have way better entry once it cools off for a moment and bounces back/confirms.

BTC/USD 1DAY UPDATE BY CRYPTO SANDERS !!Hello, welcome to this BITCOIN /USD update by CRYPTO SANDERS.
CHART ANALYSIS:-Bitcoin ( BTC ) once again moved above the $28,000 level on Wednesday, as markets reacted to the latest consumer confidence report in the United States.
The increase in confidence is seen by some as validating the Federal Reserve’s recent decision to hike rates marginally.
Following a low of $26,677.82 on Tuesday, BTC/USD raced to an intraday peak of $28,619.54 earlier today.
This latest surge in price occurred as the relative strength index (RSI) continued to move away from a recent floor at the 60.00 mark.
As of writing, the index is tracking at the 64.27 level, marginally below its upcoming ceiling of 65.00.
Earlier gains have slightly eased as BTC edged closer to this point of resistance, with the price now trading at $28,423.03.
I have tried to bring the best possible outcome to this chart.
Hit the like button if you like it and share your charts in the comments section.
Thank you.

8h Long IdeaLong from the 0.618 level. Good chance this falling wedge plays out, and rebounds for a push higher next month.

BTC/USD 1DAY UPDATE BY CRYPTO SANDERS !!Hello, welcome to this BITCOIN /USD update by CRYPTO SANDERS.
CHART ANALYSIS:-Bitcoin ( BTC ) fell below $27,000 in today’s session, as markets reacted to the news that the CFTC had filed a lawsuit against Binance.
BTC/USD fell to an intraday low of $26,606.69 on the news, which comes a day after trading at a peak of $27,979.07.
As a result of today’s sell-off, the world’s largest cryptocurrency fell to its lowest level since March 17.
Looking at the chart, this drop comes after a recent floor at the $27,100 mark was broken, which coincided with the relative strength index (RSI) also experiencing a breakout.
As of writing, the index is now tracking at the 58.51 level, which is marginally below its support at 60.00.
Overall, bulls have somewhat reentered the market, and as of writing, bitcoin is trading at $27,126.85.
I have tried to bring the best possible outcome to this chart.
Hit the like button if you like it and share your charts in the comments section.
Thank you.

Would like to see something like this playout.Just another trade idea, I think this has a very good chance of playing out.

Bitcoin goes Biblical - Forbidden Pump Do I really need to go into detail here?
Obviously, we go up from here.
Pack your bags, for thou Jesus will descend upon us and pump our bags for thou shall not pump without packed bags

BTC/USD 1DAY UPDATE BY CRYPTO SANDERS !!Hello, welcome to this BITCOIN /USD update by CRYPTO SANDERS.
CHART ANALYSIS:-Bitcoin ( BTC ) started the week trading marginally higher, with prices hovering near the $28,000 level.
Following a bottom at $27,678.15 on Sunday, BTC/USD moved to a high of $28,178.14 earlier in today’s session.
The move saw bitcoin edge toward a recent resistance point at the $28,300 mark, which was last hit on Friday.
Overall, BTC mostly consolidated on Monday, which comes as the 14-day relative strength index (RSI) collided with a ceiling at the 65.00 zone.
As of writing, the index is tracking at the 64.51 level, with the next visible point of support at the 62.00 mark.
Should bulls take price strength below this point, there is a strong possibility that BTC could move below $27,000.
I have tried to bring the best possible outcome to this chart.
Hit the like button if you like it and share your charts in the comments section.
Thank you.

BTC 4H Support ZoneBTC 4H support is now at ~$27000
Enter 50% at the current price
and try to set some BUY orders near the support zone
If BTC stays above the trendline,
the Take-Profit target would be 5%, 10%, and 15% from your entry
Cheers

BTC/USDT 4HOUR UPDATEHello, welcome to this BTC/USD 4-hour update by CRYPTO SANDERS.
CHART ANALYSIS:-Bitcoin ( BTC ) looking at Bitcoin’s recent price action, it can be seen that the intense bullish momentum has weakened while a confluence takes place between the Bitcoin bulls and bears at this specific price region.
Considering the psychological strength of the $30K price level, the most probable scenario for Bitcoin in the mid-term is to consolidate in a static range between $25K and $30K.
I have tried to bring the best possible outcome to this chart.
Hit the like button if you like it and share your charts in the comments section.
Thank you.

BTC/USD 1DAY UPDATE BY CRYPTO SANDERS !!Hello, welcome to this BITCOIN /USD update by CRYPTO SANDERS.
CHART ANALYSIS:-Bitcoin ( BTC ) started the weekend consolidating below the $28,000 mark, as market volatility eased on Saturday.
Following a high of $28,208.21 on Friday, BTC/USD moved to an intraday low of $27,039.27 earlier today.
As a result of the move, bitcoin collided with a floor at the $27,050 level, however, bulls have rejected a breakout below this point.
Today’s sell-off occurred as the relative strength index (RSI) fell below its own floor, at the 65.00 mark.
the index is now 62.75, with the next visible support point at the 60.00 mark.
Overall, BTC has rebounded from earlier lows, and at the time of writing, is trading at $27,655.15.
I have tried to bring the best possible outcome to this chart.
Hit the like button if you like it and share your charts in the comments section.
Thank you.

BTC Short Term - SHORTAfter successful confirmation of Double TOP we expect #BTC price to retract about 2.36 FIB of support ( 26600 Mark ) and then continue to 32.200 price action whereby larger correction is expected.

BestZone 4 Long in Bitcoin!I have drawn for you the points where I will open a long position if the price returns to them.
Don't forget money management.

Bitcoin (BTC) forming bullish Gartley for another price reversalHi dear friends, hope you are well and welcome to the new trade setup of Bitcoin ( BTC )
Recently we caught a powerful pump of BTC as below:
Now on a 2-hr time frame, BTC has formed a bullish Gartley for another price reversal move.
Note: Above idea is for educational purpose only. It is advised to diversify and strictly follow the stop loss, and don't get stuck with trade

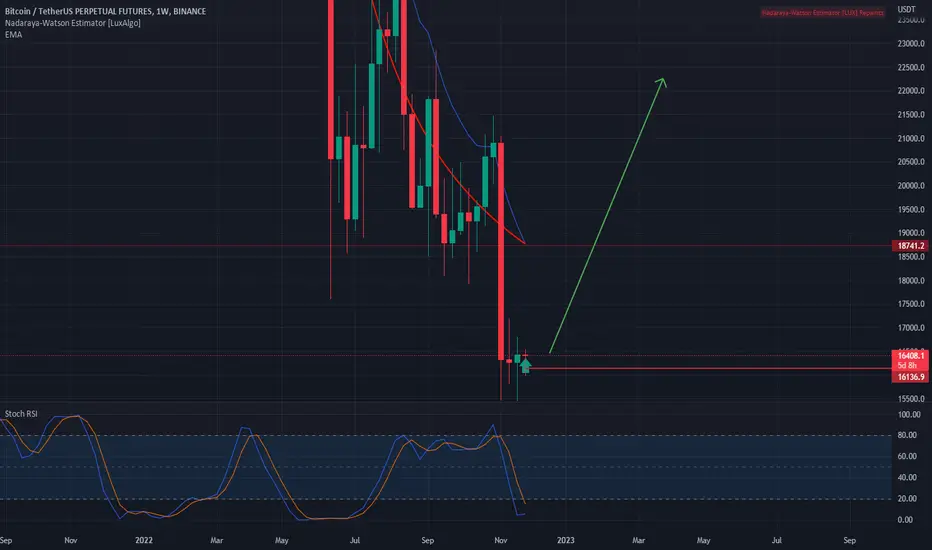
Looks nice on weekly Bitcoin will go up BTC-LongI have my own strategy for it, it works quite well, as it looks like we will start the BTC pump soon. It's a weekly forecast so I expect some nice change in the coming days/week
BTC/USD 1DAY UPDATE BY CRYPTO SANDERS !!Hello, welcome to this BITCOIN /USD update by CRYPTO SANDERS.
CHART ANALYSIS:-Bitcoin ( BTC ) dropped below $28,000 on Thursday, as markets continued to react to the latest Federal Reserve rate hike.
The Fed moved to increase rates by 25 basis points, whilst signaling that no cuts will be made this year.
BTC/USD fell to an intraday low of $26,760.00 on the news, which comes a day after trading at a peak of $28,803.34.
From the chart, the decline appears to have come as a result of the relative strength index (RSI) failing to break out of a ceiling at 72.00.
As of writing, the index is tracking at 66.54, with the next visible point of support at the 62.00 mark.
Overall, prices are still relatively overbought, which could lead to further bears reentering the market in the coming days.
I have tried to bring the best possible outcome to this chart.
Hit the like button if you like it and share your charts in the comments section.
Thank you.


BTC/USD 1DAY UPDATE BY CRYPTO SANDERS !!Hello, welcome to this BITCOIN /USD update by CRYPTO SANDERS.
CHART ANALYSIS:-Bitcoin ( BTC ) closed in on a fresh nine-month high in today’s session, as markets continued to anticipate today’s Federal Reserve rate decision.
Following a low of $27,785.11 on Tuesday, BTC/USD surged to an intraday peak of $28,439.56 earlier today.
The move sees bitcoin move back towards a recent nine-month high, recorded earlier in the week.
This latest surge in price comes as the 14-day relative strength index (RSI) attempted to break out of a ceiling at 72.00
As of writing, the index is tracking at 71.70, which is its highest reading since early February, and deep in overbought territory.
Traders are likely waiting for this afternoon’s announcement prior to attempting to move beyond this point.
I have tried to bring the best possible outcome to this chart.
Hit the like button if you like it and share your charts in the comments section.
Thank you.

BTCUSDT BITCOIN LONG ANALYSISHello, friends. Nice to meet you
Bitcoin Is Now Indicating Expansionary Wave, It's Bounced Bullish
If you support the upper line of the extended wave, we can reach 1.272 and 1.618 points

btc next moveA brief idea regarding BTC next. I can see a successfully breakout done and now doing retest is going on.
So we see BTC can go for 28k$.
Let see what going to happen

"Bitcoin Breaks Out of Falling Wedge Pattern: Nearing 33,000" Bitcoin, the world's leading cryptocurrency, has been on a wild ride lately. After reaching all-time highs in late 2021, it experienced a sharp correction, causing many to speculate on whether the bullish trend was over. However, recent market movements have provided some hope for Bitcoin bulls, as the cryptocurrency has broken out of a falling wedge and is now attempting to retrace to the 618 level at around $33,000.
A falling wedge is a chart pattern that occurs when the price of an asset is making lower highs and lower lows within a tightening range. This pattern is often a sign of a bearish trend, but if the asset breaks out of the wedge pattern, it could be a signal that the trend is reversing. Bitcoin's recent breakout from the falling wedge pattern has been a positive sign for traders, indicating a potential reversal of the bearish trend.
The 618 level, also known as the golden ratio or Fibonacci retracement level, is a significant level of resistance for Bitcoin. This level has been visible for the past two years as an area of interest for traders. If Bitcoin is able to break through this level, it could signal a significant shift in market sentiment and lead to a rally towards new all-time highs. However, if Bitcoin fails to break through this level, we could see a significant sell-off as traders take profits and exit their positions.
It's important to note that technical analysis is not always a reliable indicator of market movements. Market sentiment and external factors such as regulatory changes, geopolitical events, and the overall state of the global economy can all have a significant impact on the price of Bitcoin. Therefore, it's important to keep a close eye on these factors when analyzing the cryptocurrency markets.
In conclusion, Bitcoin's recent breakout from the falling wedge pattern and attempt to retrace to the 618 level at around $33,000 is a positive sign for traders. However, it remains to be seen whether Bitcoin will be able to break through this level and continue its bullish trend. Traders should approach the market with caution and keep a close eye on market sentiment and external factors that could impact the price of Bitcoin.
