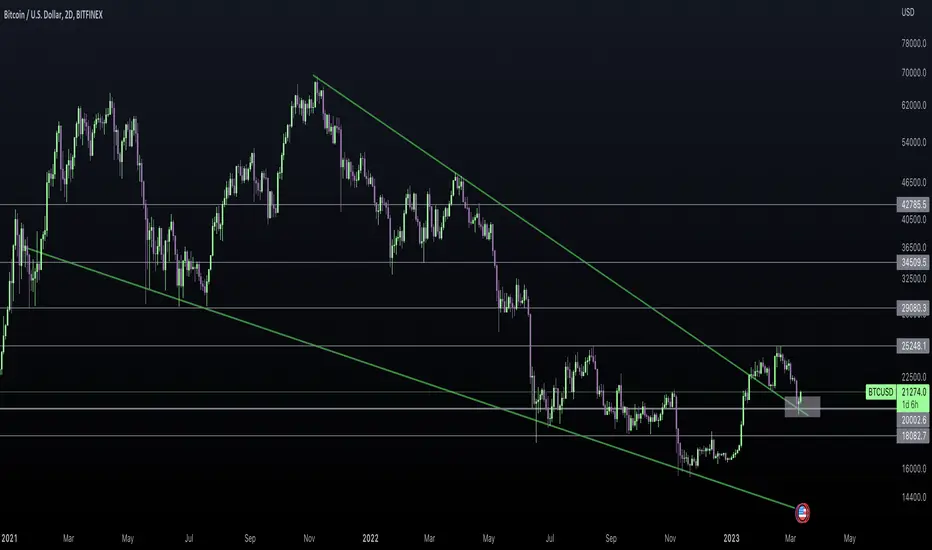
BTC weekly updateFor now, we have an obvious range to trade with. You can notice range high deviation, it means price took buy side liquidity, and the next target would be sell side liquidity that resting just below range low. My game plan will be to find local short with range low target and after range low deviation will occur the best condition to find long.
Not a financial recommendation.
Have a good profit!
Btclong

Bitcoin is about to Complete inverse H&S pattern on 1D ChartBTCUSDT is about to complete inverse Head and shoulder Patter on 1D chart after bearish Trend . Which means sooner or later it is gonna break neckline and the breakout is gonna huge . Let's wait n watch for the Breakout . 🤘

BTC SHORT UPDATE 2Currently out of my BTC short. Managed to close it in profit but since indicators are oversold already I'd say that we may see this wyckoff accumulation pattern playing out. Would also make sense if we would combine it with the missing 5th wave. Pretty easy to adjust You gameplan if You consider this scenario. Gonna enter short as high as possible. Ideally after we'll breach the Resistance line.

Common Reasons Why Traders lose Money Even in an UptrendHi guys, This is CryptoMojo, One of the most active trading view authors and fastest-growing communities.
Consider following me for the latest updates and Long /Short calls on almost every exchange.
I post short mid and long-term trade setups too.
Let’s get to the chart!
I have tried my best to bring the best possible outcome to this chart, Do not consider financial advice.
Common Reasons Why Traders Lose Money Even in an Uptrend
#Not Setting Stop-Loss:
#Not Conducting Technical Analysis:
#Going against the Trends:
#Following the Herd:
#Being Impatient:
#Not doing Homework or Research:
#Averaging on Losing Position:
Buy low sell high' is the motto. As simple as it sounds, why do most people lose money trading or investing?
There are four major mistakes that most beginners make:
1. Excessive Confidence
This stems from the idea that people think of themselves as special. They think they can 'crack the code' in the stock market that 99.9% of people fail to, and eventually make a living trading and investing. However, taking into consideration the fact that more people lose money in the market, this form of wishful thinking is the same mentality as going into a casino feeling lucky. You may actually get lucky and win big the first few times, but in the end, the house always wins.
2. Distorted Judgements
While simplicity is key, the approach most beginners make in trading and investing are too simplistic, to the extend where it's hard to even call it a trading logic or reason to invest. They spot a few reoccurring patterns within the market, and this is almost as if they discovered fire. It doesn't take long to realize that the "pattern" they spotted was never based on any solid reasoning, or worse, wasn't even a pattern at all in the first place.
3. Herding Behavior
The fundamentals of this is also deeply rooted in a gambling mindset. Beginners are attracted to the idea of a single trade or investment that will make them a millionaire. However, they fail to realize that there is no such thing. Trading and investing is nothing like winning the lottery. It's about making consistent profits that compound throughout time. While people should definitely look for assets that have high liquidity and some volatility , the get-rich-quick mentality drags irrational beginners into overextended/overbought stocks that eventually drop drastically.
4. Risk Aversion
Risk aversion is a psychological trait embedded within all of mankind's DNA. Winning is fun, but we can't tolerate losing. We tend to avoid risk, even when the potential reward is worth pursuing. As such, many beginners take extremely small amounts of profits, in fear that they might close their position at a loss, trading with a terrible risk reward ratio. In the long run, their willingness to not take any risks leads to losses.
Depending on the price action, they also go through seven phases of psychological stages:
- Anxiety
- Interest
- Confidence
- Greed
- Doubt
- Concern
- Regret
------------------------------------------------------------------
Lack of Discipline
An intraday trader must stick to a proper plan. A full-fledged intraday plan includes profit targets, factors to consider, methods to put a stop loss, and ways to select the right trading hours. The trading plan provides a comprehensive overview of how trading should be executed. Also, you can keep a record of trades executed during the day with the performance analysis of each stock at the end of the day. Such records help you identify the weak areas in your trading strategy and correct them. It is very important to be disciplined as a trader, the proper discipline will help you minimize the losses and maintain your capital.
Not Setting Proper Trading Limits
In intraday trading, the success lies in managing the risk. You should pre-define a stop loss and profit target when entering intraday trading. This strategy itself is an important part of trading discipline and this is where most people fail. For instance, if you incur a loss in the first hour itself, you should shut down the trading terminal for the rest of the day. You should also have an overall capital loss limit in place, it will safeguard you against trading losses.
Compensating for a Rapid Loss
This is one of the common mistakes in the trading community. When a trader incurs a loss, he/she either tries to average a position or overtrades excessively to recover the loss. This further leads to a greater loss and put them into more trouble. Losses are a part of intraday trading, instead of overtrading, it is wise to accept the loss, analyze the strategy and make improvements from the next day.
Heavy Dependency on Tips
Nowadays, there are ample of intraday tips flowing everywhere on the digital media. It is a common phenomenon for a trader to rely on these external tips, however, this needs to be avoided. The best way to learn intraday trading is by gradually learning how to read charts, understanding structures, and interpreting results on your own. Many traders refrain from taking these efforts and because of this, they end up on the losing side. The Beyond App by Nirmal Bang provides deeper insights into the market, the technical research offered by Nirmal Bang is spot on. You can use that research for reference, however, nothing can beat practical experience.
Not Keeping Track of Current Affairs
The external news, events, and tragedies do have an impact on the stock market. Hence, it is important for an intraday trader to keep a track of the Indian as well as global markets. Even the performance of global markets has an impact on the movement of Indian markets. Make your trade after the news or event has been announced, do not try to speculate the market based on the news.
There are even instances when traders do not have any sound trading strategy, they just make decisions based on gut feelings or emotions. One needs to remember that intraday trading in itself is a skill, it is not a gamble, it takes time to develop proficiency, you cannot expect rapid results. The above are some of the major reasons why intraday traders lose money, ensure that you are disciplined enough, stick to a proper strategy, analyze your strategy at regular intervals, and things will fall in place.
This chart is likely to help you make better trade decisions if it does consider upvoting it.
I would also love to know your charts and views in the comment section.
Thank you


Bitcoin Last Hasbullas Pump Before Downside NukeBitcoin retraced to the upside ~22300 over the weekend to liquidate all those high leverage shorters + performing a SL hunt
Right now its holding the price for more LONGs to build in order to liquidate them.
depending on traditional markets (SPX) we could get a counter trend rally to the upside (~4000) which btc will follow that gives bears another chance for a good short position.
KEEP in mind the market in general is in denial so any upside move considered a fake move and will follow with a major down side move
Thanks for all the support

BTC MASSIVE FALLING WEDGE RETESTEDBTC has been forming a falling wedge that started on February 4th, 2021. There has been strong bullish momentum off this level as this is now the second retest of this trend line this month. This has been a very prominent resistance for 488 days and has successfully turned into support. No one is truly expecting whats to come... great timing with mass fear from SVB situation. I believe this was the last negative event to instill fear. Bright times ahead. Patience is a virtue.
BTC 4H RESISTANCEBTC 4H Resistance is now at $22125
If BTC managed to break the resistance, it will be a good opportunity to enter a long position.
Cheers
BTC bull run has started!!! BTC rally to new ATH from May 2023!!Dear community and my loyal followers.
I would like to share one of my best analyses which proves all my analyses have been posted since 2022 June .
I'm looking at monthly timeframe. As you see on the bellow indicator, after consecutive green columns when price created equal highs, a grey column appeared on monthly & marked BTC bottom + a new bull run start.
After 1st grey column the last green column appeared & price dumped and tested the base of the structure, 2 months later the price bounced above equal highs and BTC started its rally to new ATH)) Where is the price now?
in 2015 BTC dumped 12.19% bellow the trendline with the wick but candle close above it. I expect the same 12.19% dump bellow the trendline at the current moment hitting the orange line/almost 18K/ could be +-300-500$/.
I expect the price to go below the trendline and test my main zone 17.5-18.5K zone with the candle close above the trendline.
I inclined that the same scenario repeats this time and BTC will be above 25K on 1st May when 2d grey column appears & BTC starts its rally to new ATH.
Don't forget that the same 2015 scenario happened couple days ago when BTC reached 25K/ Check my previous analyses titled BTC Super Guppy's super prediction)) 24-25K then 28-30K or 19K & Will BTC repeat this identical pattern as it did in 2015?.
Also please check my previous analysis posted before this one/ BTCUSDT !! My ideal BTC scenario for coming days and weeks./ and pay attention to comments where you can fine more than 5-6 proofs about BTC bottom and a new bull market start.
Don't forget to like, share, comment, and follow please. I will appreciate any single comment.

BTC/USDT 3DAY UPDATE BY CRYPTOSANDERSHello and welcome to this BTC /USDT chart update by Crypto Sanders.
I have tried to bring the best possible result in this chart.
Chart Analysis:- BTC finally made a bullish candle after successfully retesting above the falling wedge, MA 50, and the Ichimoku cloud.
This is a sign of a bullish momentum back in the market as the CME gap has also been filled.
This is not a piece of financial advice.
Hit the like button if you like it and share your chart in the comment section.
Thank you

several hard weeks for BITCOINthis is a speculation of what we might see in future behavior of market.
there are two not-that-powerful anchors for btc to pullback, with sharp and shadowy movements in a way that many people again forget about the bearish momentum.
so be careful about your positions.
for the next drop or jump, we should follow and trace this neutral movement ahead.
leave comments please

BTCUSDT !! My ideal BTC scenario for coming days and weeks. Hi dear community members and my loyal followers.
My updates for BTC current situation. As I posted earlier, BTC is repeating 2015 bear market bottoming structure I published in my previous analyses.
You can check the bellow attached analyses where I warned you about the recent dump after hitting 25K/swept previous swing high liquidity/:
I think BTC finished 1-5 bullish wave structure and now it is forming ABC correction structure before new highs.
More likely we'll see short term bounce from 19-19.5K zone to 23.5-24K zone/B wave/ and dump to 17.5-18.5k zone/ C wave/ creating new LH.
Even if in the worst case BTC dumped bellow 17.5-18.5K and drops to 14-15K zone, it will be super fast long wick bounce above 18.5K zone.
Would be great if BTC clears huge liquidity bellow 18.5K zone and bounce back. Let's thank BTC for its generosity coz it gave us last chance to buy lower prices before bull market starts. BTW I'm officially announcing all My analyses about BTC bottom have been published since June 2022 have been confirmed in February. There is super strong sign that not only BTC bottomed at 17.5K in June 2022/ a real bottom/ and 15.5K fake breakdown/spring-bear trap/ with double bottom but also BTC bull market has started. Later I will post about the most powerful confirmation.
As you see 17.5-18.5K is the strongest support zone/ there is BB, FVG zone, strong support & resistance zone, Wyckoff base & huge amount of BTC accumulation by whales.
Max pain will be stop loss hunt bellow 18.3-18.5K zone/liquidity sweep/ and strong bounce back. If my scenario plays out, BTC will from huge Inverse H&S pattern which I will post bellow this tweet.
Stay level headed, keep patience, close your eyes on Wars, high inflation, Recession, hiking rate and any kinds of FUD.
If you like my ideas, don't forget to like, follow and support. I'll appreciate any comment, likes and follow.
Don't forget to check my bellow analyses. Have a good day.

BITCOIN 1d ANALYSISHi, friends. Nice to meet you.
BITCOIN is at its most important point.
If it falls from the STRONG UPWARD TREND, it will be difficult for many candles to come up to the current branch.
If we do SupORT now, we expect a strong rise.
The bank run, various bad news, and the FOMC ICP announcement were very bad, but I personally hope that BITCOIN will rise.

BTC SUPPORTBitcoin seems to have respected the 0.618 Fibonacci line. This could be a big support point that might delay the fall of Bitcoin for a while or even cause the price to return.

BTC Long MomentumFurther to our September 28th, 2022 analysis inverse head & shoulders is not fully confirmed.
We expect price to hit 18.800 mark and follow ascending sequence pattern :
a) 18.800 - 33.000
b) 36.000 - 50.000
c) 55.000 - 74.000
Retraction Sequence:
a) 74.000 - 55.000
Further Bullish momentum before significant correction:
a) 55.000 - 104.000

One more Trigger for BTC drop (Possible, not definite)This is a very accurate line in a logarithmic chart. this jump was just like a pullback to this line and a possible reaction is expected.
But if broken, there's no resistance until 29K.
Be precise and do risk management

#Bitcoin - thoughts out loud #1.Good afternoon, dear colleagues!
I want to continue my opinion and vision of the current situation on the cryptocurrency market on the example of this instrument.
In the New Year, we see positive dynamics, but this is not enough to index this movement as "successful". Therefore, in order to update local highs, we have to go even lower to gain positions at more favorable prices for ourselves (price range 15555-16666). Scenarios of possible development of the situation №1,№2 are relevant, but the market will settle everything by itself.
If we consider the picture on the smaller time frames for a more detailed assessment of the market strength.
Dear colleagues, on the 4H time frame, we see how the price was artificially held by professional operators. Pay attention to the first two processes (marked with a circle), we have a great volume, a great result in relation to each other, but the progress does not suit us, okay, we can ignore the progress.
We go further and on the 3rd process there is a sign of local force on increased volumes, everything suits us perfectly. And the fourth, extreme situation (blue rectangle) highlighted bars and volumes, the question is why we observe an abnormal volume on the narrowing spread?
My assessment of this situation is "WEAKNESS" but on the news background we can observe a false breakout of the highs and further depreciation of the instrument.
Thank you all for your attention, I wish you success, and remember:
Sometimes you win/sometimes you learn.

BTC long IDEAPrice swept previous week low and took out sell stops. The next high probable scenario is to take out buy stops above range high and to fill imbalance above (orange box), plus we have confluence like breaker.
The next few days I expect to see price there.
Not a financial recommendation.
Have a good profit!

BTC 1H: After a descent, I start to go up.📊 The chart has formed a bearish trend and reached a relatively strong support of $21,400
📉 According to the signs of the matrix series indicator, we will have a small decline to around 21000
📈 But in general, the declines will be limited because we have reached the oversold area and the chart is doomed to grow, and we are also below the moving average, which are signs of the growth of the chart.

BTC/USD 1DAY UPDATE BY CRYPTO SANDERS !!Hello, welcome to this BITCOIN /USD update by CRYPTO SANDERS.
CHART ANALYSIS:-Bitcoin ( BTC ) fell for a fourth straight session on Thursday, as markets reacted to news that Silvergate Bank will be liquidating its operations.
Following a high of $22,198.90 on Wednesday, BTC/USD slipped to an intraday low of $21,609.99 earlier today.
The decline in price pushed bitcoin to its lowest point since February 13, when it traded at the bottom of $21,366.
Looking at the chart, this latest sell-off coincided with the 14-day relative strength index (RSI) falling to its lowest point since November 28.
As of writing, the index is tracking at 36.86, which is marginally below its support point of 37.00.
Despite this, BTC remains above its own floor at $21,700, and should this zone hold steady, there is a chance prices could rebound heading into the weekend.
I have tried to bring the best possible outcome to this chart.
Hit the like button if you like it and share your charts in the comments section.
Thank you.

Bitcoin is under bullish divergence influence.Bitcoin - 24h expiry - We look to Buy a break of 22666 (stop at 22106)
Bullish divergence can be seen on the daily (the chart makes a lower low while the oscillator makes a higher low), often a signal of exhausted bearish momentum, or at least a correction higher.
We are trading at oversold extremes.
Although the bears are in control, the stalling negative momentum indicates a turnaround is possible.
A break of the recent high at 22606 should result in a further move higher.
Bullish divergence is expected to support prices.
Our profit targets will be 24066 and 24366
Resistance: 22150 / 22400 / 22606
Support: 21800 / 21500 / 21352
Please be advised that the information presented on TradingView is provided to Vantage (‘Vantage Global Limited’, ‘we’) by a third-party provider (‘Signal Centre’). Please be reminded that you are solely responsible for the trading decisions on your account. There is a very high degree of risk involved in trading. Any information and/or content is intended entirely for research, educational and informational purposes only and does not constitute investment or consultation advice or investment strategy. The information is not tailored to the investment needs of any specific person and therefore does not involve a consideration of any of the investment objectives, financial situation or needs of any viewer that may receive it. Kindly also note that past performance is not a reliable indicator of future results. Actual results may differ materially from those anticipated in forward-looking or past performance statements. We assume no liability as to the accuracy or completeness of any of the information and/or content provided herein and the Company cannot be held responsible for any omission, mistake nor for any loss or damage including without limitation to any loss of profit which may arise from reliance on any information supplied by Signal Centre.

LONG BTC short-term swingThis gives us a 3 to 1 Risk/Reward ratio
We can see hitting 21.5-21.7K BTC need to watch for a strong bounce here. And then we need to see a strong reversal.
Cut if this falls below 21k

BTCUSD Rdy for 40K PUMP🧨🧨🧨Contrary to the opinions of people who are not experts and only have a strong social network, Bitcoin will rise and reach 40,000 dollars.
So now I can tell you with all my knowledge to be a buyer because the crypto market will be pumped.
