If BTC pullsback to 80K, DO NOT PANIC -Here is why
Very simply, Bitcoin recently broke over the line of resistance ( dashed line) that has kept it down since the ATH at the beginning of the year.
As you can see, it has not yet returned to that line on a larger time scale chart, to retest it as support. It did do that on a 4 hour chart but maybe we are about to see that on a daily to, just to check how strong it is.
After all, things are very uncertain right now in many ways.
The Federal Reserve of the Usa has a speech day tomorrow and so this may act as a catalyst, one way or another.
Bitcoin Weekly MACD is in a position of strength now
And we have seen a positive reaction of PA already, if a little subdued while we wait for the Macro environment to calm down
The Histogram is looking Bullish though this can change quickly but over all, we are in a very good place right now.....
So, Worry not if PA drops some in the next 24 hours.
If we loose 78K, then get a little uncertain.
The next level of support below that is the 2.272 fib extension at 76900 - we do not want to loose that one for too long but I doubt we will get there, providing Macro stays steady
So, Chill out and let see what happens tomorrow with the FED speech.
Btclong

$BTC.D to 66%, $TOTAL2 / BTC down to 0.43The final year of bitcoin halving year is usually a bullish year for the Altcoins. CRYPTOCAP:TOTAL2 is the measure of the Total Market Crypto Market CAP without $BTC. Today we are looking into a ratio chart of TOTAL2 vs BTC Market cap. The supposed strength in Altcoin is missing as is evident from the CRYPTOCAP:BTC.D chart and the ration chart between TOTAL2 vs BTC.
If we plot the Fib Retracement levels on the CRYPTOCAP:BTC.D from the last cycle lows to the highs, we see that in the current halving cycle the CRYPTOCAP:BTC.D is progressing towards 0.786 Fib retracement levels which is currently indicating a CRYPTOCAP:BTC.D of 66.2 %. The ratio of Toatal2 vs BTC Market cap fits surprisingly within the Fib levels and makes new lows every week in this weekly chart. The levels to watch on the ratio chart will be 0.43
What does this trend tell us. It might be possible that the Altcoins USD pairs are bullish, but the Altcoins are making new lows vs BTC. So, it's a better strategy to go long $BTC. The risk reward is very much in favour of CRYPTOCAP:BTC rather than Altcoins.
Verdict: Long CRYPTOCAP:BTC , CRYPTOCAP:BTC.D to 66%.

BTC/USDTbitcoin hit our target of 85k from the 77k entry.
a small correction is expected here to 82k-84k due to resistance from the 200 day and 50 day emas before rise.
next target:95K

BTC - Will it be able to close above 86k?As long as BTC holds above $84,000 (the current VAH/POC cluster), we may see continuation toward $86,300–$87,500 where previous inefficiencies and liquidity lie. A failure to hold $84,000 may trigger a retracement back to $82,600–$81,800 zone where buyers could defend again. Short-term bias remains bullish, but volume tapering suggests the move could slow down soon unless new buyers step in with momentum.
this is what the Profile says, but my doodle is prediciting this, offcourse with a news! Drawn is two outcomes to get settled!

BTC/USDT 1DAY CHART UPDATE !!50-day moving average (red line):
This is a short-term trend indicator. It reacts more quickly to price changes and is often used to identify short-term trends.
When the price is above this moving average, it usually indicates bullish momentum; when it is below, it may signal bearish momentum.
200-day moving average (green line):
This is a long-term trend indicator. It provides a smooth moving average that helps identify the overall trend over a long period.
A price above this line indicates a long-term bullish trend, while a price below it indicates a potentially bearish market.
Current Analysis
Price Action: As of the current date, the price is hovering around the 80,000 USDT, just below the 50-day MA, which may indicate a potential resistance area.
Convergence of MAs: The behavior of both the 50-day and 200-day MAs can provide insight:
If the 50-day MA crosses above the 200-day MA (a “golden cross”), this typically indicates a bullish signal.
Conversely, if it crosses below (a “death cross”), this can indicate a bearish sentiment.
Support and Resistance: The chart also shows areas of support (horizontal green lines) around 76,000 to 80,000 USDT. If the price breaks this resistance, it may have room to move towards the next levels indicated.
If you found this analysis helpful, hit the Like button and share your thoughts or questions in the comments below. Your feedback matters!
Thanks for your support!
DYOR. NFA

BTC/USDT 1DAY CHART UPDATE !!A downward trendline connecting the recent high points indicates bearish pressure.
A horizontal support level around 77,500 USDT shows where the price has struggled to drop.
Current Price:
As of your chart's timestamp, BTC is trading at approximately 79,883.75 USDT.
Potential Movement:
If the price can break above the descending trendline and stay above the support level, there could be potential upward momentum. The upward arrow suggests a bullish outlook.
Key Levels to Watch:
Resistance: Look for resistance at trendline breaks and the next significant levels above the current price (e.g., 82,500 USDT).
Support: The 77,500 USDT level is crucial; a drop below it could signal further downward movement.
If you found this analysis helpful, hit the Like button and share your thoughts or questions in the comments below. Your feedback matters!
Thanks for your support!
DYOR. NFA

BTC/USDT 4H Chart Update. Current Price: ~$78,336
BTC has broken below the symmetrical triangle and is testing the key horizontal support between $78,424 and $79,183.
A wick is visible below the support, but the candle closed within the area, indicating a potential fakeout or demand absorption.
Resistance (downtrend line): ~$85,500
Support Zones:
Primary: $78,424
Secondary: $79,183
Immediate Resistance: $82,000 – $83,000 (recent breakdown zone)
Outlook & Scenarios:
Bullish Reversal Scenario (Green Arrow):
The green arrow projection suggests a potential bounce from this demand zone.
If BTC reclaims $80K+ with strong momentum, it could aim for the descending trendline near $85K.
A bullish confirmation would be a 4H candle close above $80.5K–$81K.
Bearish continuation (if support fails):
If the price fails to hold this support zone, the next downside targets could be:
$76,000
$73,500
Sentiment factor:
The previous sentiment (Fear & Greed Index: 28 – Fear) reflects ongoing market caution.
Price action near key support in the fear zone could trigger a short squeeze or panic sell-off, depending on volume and reaction.
Summary:
BTC is at crucial support, and unless volume confirms a deeper breakdown, the bounce is likely to be short-lived.
Moving back above $80K would signal that bulls are regaining control.
Want any strategy ideas for trading this setup?
If you found this analysis helpful, hit the Like button and share your thoughts or questions in the comments below. Your feedback matters!
Thanks for your support!
DYOR. NFA

BTC Quickie to 83.8kQuickie for BTC, The red aiming down shall be done first before any movement, sudden shift of OB suggest the Blue box is ideal point to buy those reversing back to 83,846 and 84,120.
Clean chart and probable scenario's, as mentioned, the latter red one is the most probable scenario, and extreme liquidity hunt comes at the cost of green. keeping targets stagnant!

BTC/USDT 4H Chart Analysis !!Current Price: $83,809
The chart shows a symmetrical triangle pattern, indicating a possible breakout soon.
Upper Resistance: Around $86,000
Lower Support: Around $82,000
Key Support Levels: $79,183 and $78,424
Bullish Breakout (Green Arrow)
If BTC breaks above the resistance trendline (~$86K), it could see a strong move towards $90K-$92K.
Confirmation would be a candle close above $86K with volume.
Bearish Breakdown (Red Arrow)
If BTC loses the support trendline (~ GETTEX:82K ), it could drop towards $79K-$78K.
The candle closing below GETTEX:82K could fuel further selling.
Market Sentiment:
Fear & Greed Index: 28 (Fear) – Investors remain cautious.
The direction of the breakout will depend on market sentiment and volume.
If you found this analysis helpful, hit the Like button and share your thoughts or questions in the comments below. Your feedback matters!
Thanks for your support!
DYOR. NFA

Bitcoin Breaks Free from the S&P 500: The Start of a New EraWe may be witnessing a historic moment in the evolution of Bitcoin. On April 3rd, 2025 at 15:00 UTC, Bitcoin officially broke its correlation with the S&P 500 a connection that had persisted for years.
Since that moment, the divergence has become clear:
• The S&P 500 has continued its sharp decline, now down over 7%, amid rising macroeconomic uncertainty and trade tensions.
• Meanwhile, Bitcoin has held strong, even climbing up to 4%, and has now entered a period of sideways consolidation rather than following the broader market into panic.
As of April 4th, 2025 at 20:00 UTC, this trend is holding and it might just signal the start of a new era for digital assets.
📉 A Shift in Market Psychology
Historically, BTC has mirrored traditional markets, especially during moments of fear. But this time is different. Bitcoin is resisting the gravitational pull of global financial weakness.
This could mean that investors are starting to see Bitcoin not as a high-risk tech bet, but as a legitimate hedge against global instability a digital store of value.
🔍 Why It Makes Sense
• 🌐 Borderless: Bitcoin is not tied to any single economy or government.
• 🏛️ Decentralized: No central authority can manipulate its supply.
• 💎 Scarce and predictable: With a fixed max supply of 21 million, Bitcoin offers transparency and reliability.
In a world of rising protectionism and financial tension, Bitcoin offers what traditional systems can’t: a neutral, incorruptible asset available to anyone, anywhere.
🔮 What’s Next?
If the decoupling continues, we could see:
• 📈 Capital shifting into Bitcoin for protection, not just speculation.
• 🚀 A new wave of adoption, as institutions and individuals look for safe havens.
• 🔁 Altcoin markets gaining momentum, once confidence trickles down from Bitcoin's stability.
🧠 Final Thoughts
This moment could be a turning point. While traditional markets falter, Bitcoin holds firm. While governments talk tariffs and trade wars, Bitcoin offers freedom.
If this trend continues, it may redefine the role of Bitcoin in the global economy — not just as a volatile asset, but as a truly global store of value and pillar of financial independence.

Bitcoin (BTC) on 4-hour timeframe. Current Price: Bitcoin is currently trading around $81,830.
Trend Line: There is a downward trend line indicating bearish sentiment over the observed period.
Support Level: There is a green support area around $78,424 to $80,000. Bitcoin needs to stay above this level to avoid further declines.
Recent Activity: After the decline, Bitcoin has attempted to stabilize near the support but has not made any significant upward move.
Considerations
If the price breaks below the support area, the bearish trend may continue.
Conversely, if Bitcoin breaks above the trend line, it may signal a reversal and potential upward movement.
Feel free to ask for further analysis or specific technical indicators!
If you found this analysis helpful, hit the Like button and share your thoughts or questions in the comments below. Your feedback matters!
Thanks for your support!
DYOR. NFA

BTC/USDT 1DAY CHART UPDATE !!A downward trend line indicates resistance; the price is struggling to move above this line.
The green line at around 78,000 to 79,000 USDT is a crucial support level, providing a base for the price movement.
Recent fluctuations: The price shows a recent bounce, indicating a potential bullish reversal if it breaks the trend line.
Future forecast: The upward arrow indicates a bullish outlook; if the upward movement continues, then targets around 102,500 to 110,000 USDT can possibly be set.
If you have specific questions or need further analysis on certain aspects, feel free to ask!
If you found this analysis helpful, hit the Like button and share your thoughts or questions in the comments below. Your feedback matters!
Thanks for your support!
DYOR. NFA

BTC/USDT 15-Minute Chart Analysis🚀 BTC/USDT 15-Minute Chart Analysis 🏆
🔍 Market Overview:
The chart shows Bitcoin (BTC/USDT) price action on a 15-minute timeframe with key resistance & support levels, along with potential trade triggers.
📌 Key Observations:
📈 Strong Resistance (🚧 85,339.85 USDT)
🔥 Major hurdle for buyers! A breakout above this could ignite a rally.
🚀 If BTC closes above this level with volume, we might see a strong uptrend.
🛑 Important Support (🔵 84,727.22 - 84,912.40 USDT)
🛡️ Holding this zone is crucial for bulls to maintain momentum.
❌ Losing this support could trigger a bearish move.
📊 Moving Averages (7, 25, 99 SMA):
🟡 Short-Term SMA (7): Price is testing this moving average.
🔵 Medium-Term SMA (25): Acting as dynamic support.
🟢 Long-Term SMA (99): Still bullish, showing an uptrend bias.
⚡ Trade Triggers:
✅ Long Trigger (📈💰) - If BTC breaks 85,339.85 USDT with volume → 🚀 BUY Opportunity!
❌ Short Trigger (📉🔻) - If BTC drops below 84,727.22 USDT → 🏴☠️ Short setup possible!
📢 Trading Strategy:
💎 Bullish Plan: Watch for a breakout above 85,339.85 USDT with strong volume → 🎯 Targets: 85,500+ USDT.
⚠️ Bearish Plan: If BTC breaks below 84,727.22 USDT, look for a drop to 84,498.52 USDT or lower.
🔥 Final Thoughts:
Bitcoin is in a critical decision zone! 🎯 Breakout = Bullish Rally! ❌ Breakdown = Bearish Move!
📢 Stay Alert! Volume Confirmation is Key! 🎯

BTC/USDT 4-Hour Chart Analysis. The chart shows Bitcoin (BTC) previously trading within an ascending channel (marked by two parallel black lines).
Recently, BTC broke below this channel, signaling a bearish shift in momentum.
BTC is currently attempting to retest the lower boundary of the broken channel.
This is critical—if BTC fails to reclaim the channel, it could confirm a downtrend continuation.
The chart suggests a possible short-term bounce toward resistance around $85,000-$86,000.
However, after this retest, BTC is expected to drop sharply toward $79,000 - $78,400 (green support zone).
$79,059 & $78,424 are identified as key support zones.
If BTC reaches these levels and holds, a rebound is possible.
If broken, BTC could see a deeper decline toward lower levels.
Breakout invalidation: If BTC breaks above $86,000 with strong volume, it could regain bullish momentum and move higher.
If you found this analysis helpful, hit the Like button and share your thoughts or questions in the comments below. Your feedback matters!
Thanks for your support!
DYOR. NFA

Bitcoin Part2: Bullish Trade longBad economy,global inflation,recessive U.S. economy,hypes,uncertainly, the white house policy.
All these facts matter:They put the markets under massive pressure
Where is the chance: To plan different scenarios and models that have benn working in such similar scenarios. 202 is a good example, as the markets suddenly experienced big pressure.
Last not least, the FED transistory inflation, that wasnt real inflation, now indeed is becoming a dangerouse reality: We will have higher inflation, and global risks increasing.This will impact global liquidity inflow into markets.
Additionally we are noticing an outflow of the US stock markest, and increasing inflow of capital in foreign countries stock markets.
This are not good news for Bitcoin nor for crypto at all.
The chane in my opinion is just to think reverse.like 2020
Sell when positive news from the Whitehouse andpositive tone from FED.
Buy when White house talking and announcing threadful tariffs and if FED talks negatively.
Why?Because we have indieed real thread of inflation, and FED is the more competent team, who really now does everything to tame the inflation.Therefor i beleive them more.
Also short term contarian trade is just planned for max 24-48 hours. not longer
As the volatility rises.
Helding positions for more periode of time means increasing the risk.Upwards and downwards.

Bitcoin Dump Perfectly Predicted ! What's Next? 76k ?🚨 DID EVERYONE REMEMBER ? 🚨
🔥February 14th – I told everyone loud and clear SHORT or SELL because BTC was about to DUMP. Look at where we are now another perfect prediction, another massive win. 🚀
Hope all my real ones remembered and stayed safe in this move. We are still valid in our analysis, deep in profits, and absolutely killing this trade.
✅ Book partial profits – Lock in those gains.
✅ Move SL to entry – No risk, stress-free ride.
We move smart, calculated, and ahead of the market. Now, let’s analyse
the next move.
🔍BTC Technical Analysis What’s Next ?
Bitcoin followed the bearish rejection from key resistance and is continuing its downtrend. We saw a weak consolidation before another breakdown, and structure still favors further downside.
📊 Key Levels to Watch
🔻 Support: $68,500-$70,000 – If this level breaks, BTC could accelerate lower.
🔺 Resistance: $85,000-$86,000 – A reclaim of this zone would invalidate further downside.
🔮 Potential Scenarios
1️⃣ If BTC holds above $75,000-$76,000, we could see a short-term bounce before another drop.
2️⃣ If BTC loses $70,000, expect further downside targeting $68,500 or lower.
3️⃣ Bulls need a strong reclaim above $85,000 to flip structure bullish again.
📉 We remain bearish until BTC shows clear strength. Manage risk, stay disciplined, and ride the trend.
💬Drop a comment and follow if you caught this move & let’s stay ahead of the game!🚀

Bitcoin in Ascending Wedge?Looks like a rising wedge guys - I'm not a charting TA expert but would love to here your thoughts. Many bears keep posting a drop to $70K level.. I guess that drop is written in some prophecy somewhere, and they believe (or hope) it MUST happen, before we go for new ATH. Maybe so... however can anyone explain WHY that must play out like that? A couple of weeks back i was in that camp but after I see the slow and steady Bitcoin recovery, I have changed my mind.

Bitcoin (BTC/USDT) 4H Chart Update. BTC has broken out of a descending triangle, leading to a strong upside.
Currently trading inside an ascending channel, facing resistance near $90,000.
Bullish Scenario:
If BTC holds above $87,000-$88,000, a continuation toward $92,000-$95,000 is possible.
A strong breakout from this channel could lead to an attempt at $100,000.
Bearish Scenario:
A rejection at the channel's top may push BTC back to the $84,000-$85,000 support level.
If the support breaks, BTC could drop to $79,000-$78,400
Resistance: $90,000, $92,000, $95,000
Support: $85,000, $84,000, $79,000
If you found this analysis helpful, hit the Like button and share your thoughts or questions in the comments below. Your feedback matters!
Thanks for your support!
DYOR. NFA

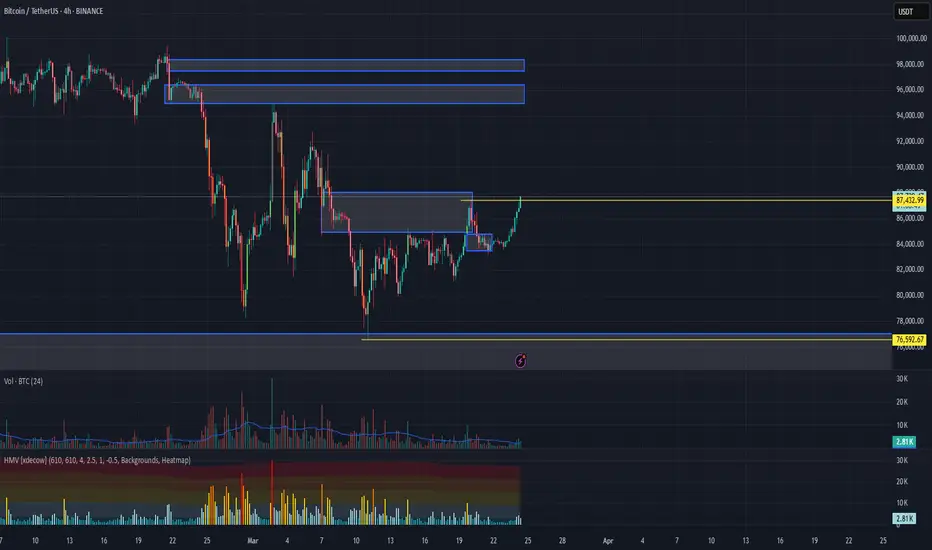
Market overview
WHAT HAPPENED?
Last week, bitcoin tested the key zone of $85,000-$88,000 (volume zone). After receiving the seller's reaction, we formed a local structure that questioned the global decline.
In the daily analysis on TradingView on Friday, a support zone of $84,800-$83,500 (pushing volumes) was noted. After the test, we received a reaction and confirmed the buyers' intentions to move the quote to higher levels.
WHAT WILL HAPPEN: OR NOT?
At the moment, longs are a priority. The confirmation of this scenario will be overcoming the $87,500 level. The target for the movement is the $95,000 mark, and there is no significant resistance before it.
Despite the fact that we’re in an uptrend, there are no volume zones of the buyer up to the minimum mark of $76,000. Therefore, with strong market activity of the seller at the current level, it’s possible to resume the decline to the lows.
Sell Zones:
$95,000–$96,700 (accumulated volumes)
$97,500–$98,400 (pushing volumes)
$107,000–$109,000 (volume anomalies)
Buy Zones:
$77,000–$73,000 (volume anomalies, pushing volumes)
IMPORTANT DATES
About the macroeconomic news this week:
• Monday, March 24, 13:45 (UTC) — publication of the index of business activity in the manufacturing sector and the index of business activity in the US services sector for March;
• Tuesday, March 25, 14:00 (UTC) — publication of the U.S. consumer confidence index for March and data on new home sales in the United States for February;
• Wednesday, March 26, 7:00 (UTC) — publication of the UK consumer price index compared to February 2024;
Wednesday, March 26, 10:00 (UTC) — publication of the UK spring budget forecast;
• Thursday, March 27, 12:30 (UTC) — publication of US GDP for the 4th quarter of 2024, as well as the number of initial applications for US unemployment benefits;
• Friday, March 28, 7:00 (UTC) — publication of UK GDP for the 4th quarter of 2024;
• Friday, March 28, 12:30 (UTC) — publication of the basic price index of US personal consumption expenditures for February, as well as in comparison with February 2023.
*This post is not a financial recommendation. Make decisions based on your own experience.
#analytics
$BTC to the MoonFor BTC, we are still sticking to our "to the moon" analysis 🚀 hehehe. We remain in a trade with the following parameters:
Entry: 81,758
Stop Loss: 79,901
Target: 109,390
This is our trade operation, but we have also increased our hold position at this entry point, aiming for the very long term. Currently, our average price is 42,350.
What reinforces our analysis?
By analyzing the daily and H4 time frames, we can observe:
✅ Bullish continuation purges
✅ SMT (Smart Money Theory) confirming the movement
✅ A shift in the state of price delivery
With that in mind, I remain bullish, and may the moon be just the first target! Let's go, BTC! 🚀

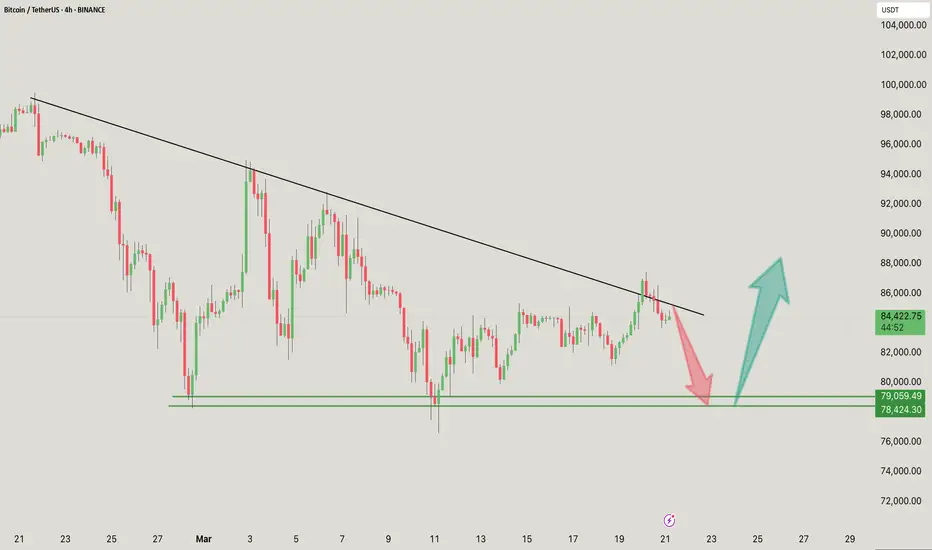
BTC/USDT 4-hour chart update. The Bitcoin (BTC/USDT) 4-hour chart suggests a key decision point near descending trendline resistance.
BTC is testing a key descending trendline, which has acted as resistance multiple times.
Rejection from this level could lead to a retracement towards the $79,000 – $78,400 support area (red arrow).
If BTC breaks above the trendline with strong volume, it could signal a bullish continuation towards $88,000+ (green arrow).
Immediate Resistance: $85,000
Key Support Area: $79,000 – $78,400
Breakout Target: $88,000+
If you found this analysis helpful, hit the Like button and share your thoughts or questions in the comments below. Your feedback matters!
Thanks for your support!
DYOR. NFA
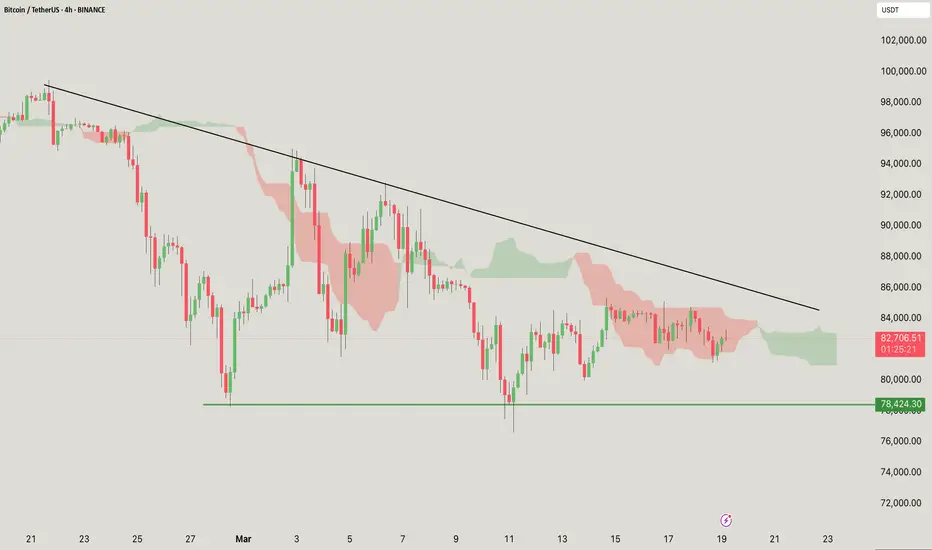
Bitcoin (BTC/USDT) 4-hour chart.
Price: Currently around $82,753.16, showing a slight increase of +0.05%.
Trend line: A descending trend line is visible, indicating potential resistance. If the price breaks above this line, it could signal a bullish reversal.
Support level: There is a strong support level at $78,424.30, which has been tested multiple times.
Indicators: The price is currently in the cloud, indicating a state of indecision. The green cloud above indicates potential resistance, while the red cloud below indicates previous bearish momentum.
Resistance: Keep an eye on the descending trend line and the upper edge of the cloud.
Support: The $78,424 level acts as a crucial support area.
Monitor breakouts: A breakout above the trend line may indicate an uptrend, while a breakdown below the support level may signal a further decline.
Volume analysis: Monitor trading volume to confirm breakouts.
If you found this analysis helpful, hit the Like button and share your thoughts or questions in the comments below. Your feedback matters!
Thanks for your support!
DYOR. NFA
BTC/USDT 4HOUR CHART UPDATE !!The BTC/USDT 4-hour chart suggests a descending channel pattern, indicating a possible continuation of the bearish trend until a breakout occurs.
Descending Channel:
Price activity remains within a downward-sloping channel, with lower highs and lower lows.
The upper trendline acts as resistance, while the lower trendline provides dynamic support.
Resistance: Near $85,000 to $87,500, aligned with the upper trendline.
Support: Around $78,424, the lower limit extending to $72,000 if a breakdown occurs.
(Red Arrow):
If BTC fails to break the resistance, it could drop towards $78,424 and possibly lower.
(Blue Arrow):
A breakout above the descending channel (~$87,500) could trigger a bullish run towards $90,000+.
If you found this analysis helpful, hit the Like button and share your thoughts or questions in the comments below. Your feedback matters!
Thanks for your support!
DYOR. NFA
