Bitcoin May Pause After Recent Highs📊 Market Move:
Bitcoin (BTC) recently touched an intraday high of ~$122.8K after hitting new all-time highs, supported by a weaker USD, strong institutional inflows, and favorable U.S. regulatory developments (e.g., GENIUS Stablecoin Act, CLARITY Act, and Trump’s executive orders). However, rising volatility (DVOL) and a rebounding USD are signaling a possible short-term correction.
📉 Technical Analysis:
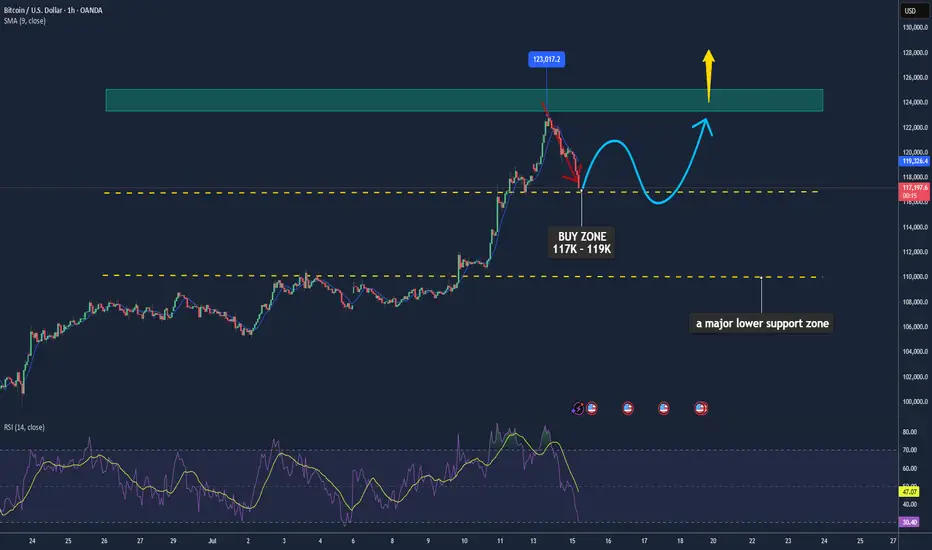
• Key Resistance: ~$123K–$125K
• Nearest Support: ~$117K (with $110K as a major lower support zone)
• EMA: Price is currently above the 9-day EMA → short-term trend remains bullish.
• Candlestick / Volume / Momentum:
• A cup-and-handle formation has emerged, typically a bullish continuation pattern, suggesting a possible 14% rally to ~$134.5K.
• Momentum is still strong; RSI is elevated but not yet overbought (14-day stochastic RSI at ~79.4%).
📌 Outlook:
Bitcoin may consolidate or experience a mild pullback in the short term around the $123K level, especially if the USD continues to strengthen or volatility spikes. However, a clean breakout above $125K could trigger a further rally toward the $134K–$146K range.
💡 Suggested Trading Strategy: (Spot only – no leverage)
🔻 SELL Bitcoin/USD at: $123K–125K
🎯 TP: $117K
❌ SL: $126.5K
🔺 BUY Bitcoin/USD at: $117K–119K
🎯 TP: $123K–125K
❌ SL: $115K
Btclongsetup
BTC - LONGAnother opportunity for BTC. We are at a 'Fear & Greed Index' of 21, there are no better moments. I believe the strong support is at 80k, down to a maximum of 75k. Maybe we'll be in the green again soon.

BTCUSD NEXT MOVE BRIEF ANALYSIS IS HERE!Bitcoin (BTCUSD) is currently trading near a strong demand zone, indicating a potential bullish reversal setup.
🔹 Key Levels & Zones:
Strong Demand Zone: BTC has entered a high-liquidity support area around $84,900 - $86,000, which has previously acted as a reversal zone.
Potential Upside Target: The first key resistance level is at $89,300, while a breakout could push BTC towards the $92,400 - $92,500 range.
Stop-Loss Consideration: Below the demand zone low to minimize downside risk.
🔹 Trade Plan & Expectations:
Bullish Reversal Setup: The current price action suggests that Bitcoin is forming a higher low within a demand zone, which may result in an upward move.
Breakout Confirmation: If price holds above $87,000, a push toward $89,000 - $92,500 is likely.
Bearish Invalidations: If price breaks below $84,900, the bullish setup may get invalidated, signaling further downside.
📈 Bullish Bias: A strong entry point is forming in the demand zone with a high reward-to-risk setup targeting key resistance levels.

$BTC Long Setup February 2025 | 4H | BTCUSDT See on Chart,✨ CRYPTOCAP:BTC Long Setup February 2025 | 4H | BTCUSDT
Recent News: Czech Central Bank Explores Bitcoin Amid Cautions Over Crypto Risks
Analyst Says Bitcoin Could Reach $100K in 1-2 Weeks, Trying to Create New Support. Bitcoin's price has recently bounced from a key support level, located just below the 78.6% retracement, which has been a focal point in the last few days. The price formed a local low and attempted a move to the upside. However, the bullish rally is still in its early stages, and the momentum seems too small to be considered a strong trend just yet.
Currently, Bitcoin has failed to break the previous swing high from February 3rd, which is around $96,700. For the bulls to show strength, a break above this level is essential. While this move up could be a sign of things to come, the price action is not yet strong enough to confirm a substantial low.
Crypto analyst Michael say Bitcoin and Ethereum in the coming weeks. He believes Bitcoin could reach $100K within 1-2 weeks, with the current consolidation phase offering a great entry point for investors. As Bitcoin holds at lower levels, van de Poppe sees it as a chance for a potential breakout.
Market Implications
The price area between GETTEX:89K and $57K may receive backing from institutional investors and ETFs yet a significant market fall below $57K would signal extended bearish trends. Long-term holders keep GETTEX:25K as their essential reference point for the market because previous market bottoms reached this exact value.
Disclaimer: This article is for informational purposes only and does not constitute financial advice. Always conduct your own research before making any investment decisions. You should only invest in products you are familiar with and where you understand the risks. You should carefully consider your investment experience, financial situation, investment objectives and risk tolerance any investment.

The Path to $158K – A Two-Phase Bull RunBitcoin (BTC/USD)
Bitcoin is on track to reach $134,000 by April 2025, following the natural progression of the bull market cycle. However, as BTC approaches this key level, profit-taking and market dynamics will likely trigger a pullback phase, setting the stage for the second and final leg of the bull run.
Phase 1: The $134K Target and Pullback (April–July 2025)
BTC’s bull market momentum is expected to push the price toward $134,000 in April 2025, marking a critical milestone.
As this level is reached, a selling phase will emerge, leading to a correction between $62,000 and $72,000 from May to July 2025.
This retracement will serve as a healthy market reset, allowing for renewed accumulation before the next explosive move.
Phase 2: The Final Bull Run to $158K (Nov–Dec 2025)
After the correction, BTC will enter the second phase of the bull cycle, characterized by renewed investor interest and fresh capital inflows.
A new wave of hype and adoption will propel Bitcoin toward its final bull market peak of $158,000 by November–December 2025.
This mirrors historical market cycles, where a strong initial rally, followed by a correction, leads to an ultimate parabolic run before the market cools down.
Key Price Levels to Watch:
Target 1: $134,000 (April 2025) → Key milestone before the pullback.
Pullback Range: $62,000–$72,000 (May–July 2025) → Profit-taking phase and market reset.
Final Bull Run Target: $158,000 (Nov–Dec 2025) → Peak of the bull market before a potential cycle shift.
Summary: History Will Repeat Itself
Bitcoin's bull market progression follows a well-established pattern of rapid price appreciation, sharp corrections, and a final euphoric rally. With $134K as the first major target, a pullback to $62K–$72K will act as the foundation for the second explosive phase, ultimately driving BTC to its anticipated $158K peak by late 2025.
As always, market cycles repeat, and this time, history appears to be following the same script once again.

BTC SHORT TERM BUY OPPORTUNITYI Hope btc may break the channel and sweep liquidity (Propably another short squeeze followed but quick bounce and continue in inside the channnel

Bitcoin yearly divergency BITSTAMP:BTCUSD
Take a look on this historical Bitcoin chart.
Based on my 2 indicators Accumulation and Distribution we can see huge yearly divergency. Step by step whales distribute coins which they got in a first 5 years. From 2015 till now we see pure divergency. I think we will see new ATH around 89000-130000 and reject one more time at the main line on ADZ indicator.
Based on Direction indicator (lowest) we touch the same level where BTC was in 2015. Of course we will not repeat % pump because Bitcoin is to heavy now. But model can be similar with uptrend move.
Hope you enjoyed the content I created, You can support with your likes and comments this idea so more people can watch!
✅Disclaimer: Please be aware of the risks involved in trading. This idea was made for educational purposes only not for financial Investment Purposes.
---
• Look at my ideas about interesting altcoins in the related section down below ↓
• For more ideas please hit "Like" and "Follow"!

Bitcoin's Bullish Surge: Is a New All-Time High Imminent?BTC/USDT has successfully broken out of a descending triangle, reclaiming momentum and trading above a key resistance level, which has now turned into strong support.
Supported by the ascending trendline, Bitcoin is showing a bullish trajectory and appears poised to test the all-time high (ATH) zone.

Chart Idea - BTC BULL FLAGBTC has been consolidating in a big bull flag pattern since March of this year. It has touched the resistance 5 times and support 3 times. Currently tested the support yesterday at 300EMA $53K. It can touch GETTEX:52K which is the 618 fib level. However, IMO the correction is almost done and we are on the way up from here.
BTC Swing Long Setup
Entry: $53K
SL: 50.2K
TP1: 67K
TP2: 72K
TP3: 102K
Trade should hit all TPs in next 3 months unless SL hit.

Chart Idea - BTC Potential Bull Market TargetI have rarely seen a cup and handle created on weekly this beautifully. Acc to this cup n handle pattern, the TP is coming around $290K. I personally will start booking profits once the monthly RSI hits around 90. Bearish divergence on weekly will give further confirmation to start selling in big chunks. It doesn't matter what the price would be and what the month in that cycle would be. IMO, it will be around 3rd or 4th quarter in 2025. Let's see
Not a financial advice!!

$BTC heavy daily bull div confirming | $96k targetnot many are talking about the valid bull daily bull div that will confirm in a few hours. feels like this should run back up to range high at a minimum, but we think if we regain the pivot, then this should run up to r5, which is a little above $96k.
y'all are likely panicking at the bottom.

Bitcoin Tapping the major ResistanceBitcoin Back at the monthly open and trendline resistance.
I think Break and hold above $63500 can potentially provide a good move up.

BTC Swing Long - Chart IdeaBuy Buy Buyyyyyy --- Screaming buying prices .. It's like a black friday sale...
- Hitting 300EMA on Daily WoW
- RSI is at 24
- Filled the fair value Gap
Buy ALTS is you can.. Thank me later !!!

Bitcoin swing trade 10RRPotential 10RR swing trade BINANCE:BTCUSDT.P
Possible Targets and explanation idea
➡️Watch the logic of entry! Not a 100% so we will sweep 5 march low but looks logical
➡️On a screen just a local range PWH will be like a target for take profit
➡️PDL and sweep March low will be the logic for entry with stop loss
➡️Mark your own leverage and count own stop loss properly
➡️PDH will be also like a first target to fix %
➡️Trade on indicator yesterday we got buy signal with small +3% bounce
➡️30 April yesterday we saw the money inflow by Money Power indicator
Hope you enjoyed the content I created, You can support with your likes and comments this idea so more people can watch!
✅Disclaimer: Please be aware of the risks involved in trading. This idea was made for educational purposes only not for financial Investment Purposes.
---
• Look at my ideas about interesting altcoins in the related section down below ↓
• For more ideas please hit "Like" and "Follow"!

BTC Chart Idea - Swing Long SetupBTC creating a huge bullish pennant on daily timeframe. Already touched support and resistance 3 times. If it breaks $72K, the swing TP should be $102K.
Entry - Once it breaks $72K on daily timeframe and confirm
TP - $102K
SL - Daily candle close below $70K


#BTC/USDT A bullish flag pattern can be seen in the 1H A bullish flag pattern can be seen in the 1H time frame and if the above trendline breaks it, it can go up between 72K and 73K. If you can't do that, if you break below the trendline, you can go down to 64k again!👀🌟
BINANCE:BTCUSDT


BTC - Spring ????Seems to me that the next move is spring , Already mentioned in previous idea today , that we will be visiting 51k in the coming move leg up.

Bitcoin → Broke Weekly Resistance! On to $46,000!? Let's Answer.Bitcoin has broken Weekly Resistance at $38,000 and raced to the top of the bull channel around $42,500. Now that the move seems to have played out, what is the next trade?
How do we trade this? 🤔
If you're not already in a long, Do Not Enter the market. We're too close to the bull channel resistance, we haven't tested the previous Weekly Resistance as Support, RSI is over 76.00 and far above the Moving Average. We should remain bullish given the macro trend and that the top of the 2021 Trading Range at $46,000 is at the proposed Measured Move target.
Best to wait for a pullback and find support again, likely around $40,000 at Bull Channel support. A bull signal bar and confirmation candle will give us the necessary probability to enter a 1:2 Risk/Reward Ratio Long.
💡 Trade Idea 💡
Long Entry: $40,700
🟥 Stop Loss: $38,500
✅ Take Profit: $45,100
⚖️ Risk/Reward Ratio: 1:2
🔑 Key Takeaways 🔑
1. Breakout from Previous High Support!
2. Bull Channel, Bias to Long.
3. Weekly Resistance Broken! Possible Measured Move Up.
4. $46,000 Measured Move Lines Up With Lifetime Resistance.
5. RSI over 76.00, Bias to Short for the short-term.
⚠️ Risk Warning! ⚠️
Past performance is not necessarily indicative of future results. You are solely responsible for your trades. Trade at your own risk!
Like 👍 and comment if you found this analysis useful!

Bitcoin Lifetime Analysis → Reverse to $20,000 Before New Highs?Bitcoin broke out of it's trading range between $25,000 and $32,000 and touched $44,800! Does this mean we're going to new all-time highs? I'm skeptical for a parade of reasons, all of which are based on historical and current data points. Let's dig in!
How do we trade this? 🤔
Recent Data
Since the trend reversal in January 2023 we've had three pushes to the upside, which is a textbook leg count before the trend converts into a trading range. The RSI has also been over 70.00 since October 2023 and the Daily candles leading up to December 4th 2023 could be the exhaustion bars at the end of the bull trend. This is enough evidence to warrant a pull back, likely to the top of the trading range around $32,000.
Historical Data
When are we going to see new all-time highs? Refer to the Monthly chart above. We can see that prior to hitting 3 of the 4 new all-time high events, Bitcoin will make contact with Lifetime Support. The one exception was the 2013 all-time high. Another data point is the Bitcoin halving has occurred prior to *every* new all-time high.
There is one more clue in the Weekly chart to observe! Look at the 2019 high, looks very similar to where we are now: Double-bottom reversal before touching Lifetime Support on Feb 2019, three pushes to the upside hitting the 2019 high, RSI over 70.00, price failed to break the 2019 high then capitulated to Lifetime Support, Bitcoin Halving happened shortly after, THEN went to new all-time highs.
I believe this is the situation we're in right now. If we don't make contact with Lifetime Support, I believe we need to at least come back down into the trading range before hitting new all-time highs. We also have the Bitcoin halving happening in the April 2024 area, all seems conveniently timed based on what we've discussed here!
Trade Options
There are many ways to trade this:
1. Fading your position down to lifetime support: Longing support areas as the price falls, starting with smaller positions and increasing your entry at every level.
2. Waiting for a bounce at lifetime support or in the trading range: Playing the reversal, which includes not entering until you see a reversal signal then you enter with a larger position.
3. Scalp your positions with higher probability of profit, but less profit and more risk in your Risk/Reward Ratio.
To strike a balance between Risk, Reward, and Probability, I'll stick with a standard Reversal Entry, which means we wait for a reversal confirmation. Based on this analysis, we should look to enter after a Lifetime Support or Trading Range bounce around $25,000. Enter in this price area, place a protective stop below the last bear run low at $15,000. Take profit areas are based on previous resistance and the projected lifetime resistance range of $120,000 and $130,000. The first take profit is at the price we just hit around $45,000, the next take profit should be just before the current all-time high around $65,000, the final take profit should be below the projected new all-time high somewhere in the $120,000 and $130,000 area, around $105,000. You could add more take profit areas between $65,000 and $105,000 based on lower timeframe analysis, but we don't have that data yet.
More updates will be provided as the months go by. Let me know your thoughts!
💡 Trade Idea 💡
Long Entry: $30,000
🟥 Stop Loss: $15,000
✅ Take Profit #1: $45,000
✅ Take Profit #2: $65,000
✅ Take Profit #2: $105,000
⚖️ Risk/Reward Ratio: 1:5
🔑 Key Takeaways 🔑
1. Bullish since January 2023. This is not *THE* bull run.
2. Bull Breakout of $25,000 to $32,000 Trading Range, but RSI overbought.
3. Every New All-Time high was Preceded by Touching Lifetime Support.
4. Bitcoin has not Touched Lifetime Support. Pullback to $20,000 Area.
5. RSI is above 70.00, Supports Pullback.
⚠️ Risk Warning! ⚠️
Past performance is not necessarily indicative of future results. You are solely responsible for your trades. Trade at your own risk!
Like 👍 and comment if you found this analysis useful!

BTC TO 75,OOO... ALMIGHTY LONG ?Looking at what BTC has done for the past 6 months now we can see that it tried to rebalance an inefficiency at 17,000 now the next move is toward the draw on liquidity to attack does that short BTC and think that it will never go up :)

BTC LONG TRADE PLAN BINANCE:BTCUSDZ2023
BTC long trade-
Trendline support
Positive market condition
34k is a PSY Level and Trendline support.
