Position QHF 22.10.2019Prices are moving turtle speed.
Most likely the reason is that there is a mid-term accumulation in bigger models of the market, prior to the faster distribution of the volume.
The situation with the bitcoin does not change.
The price has fallen into the conditional buying zone, where, perhaps, there will be some time.
As before, the priorities of purchase with a smooth averaging to the lower boundary of the model.
We do not recommend to sell at the bottom of the established range.
Btclongterm

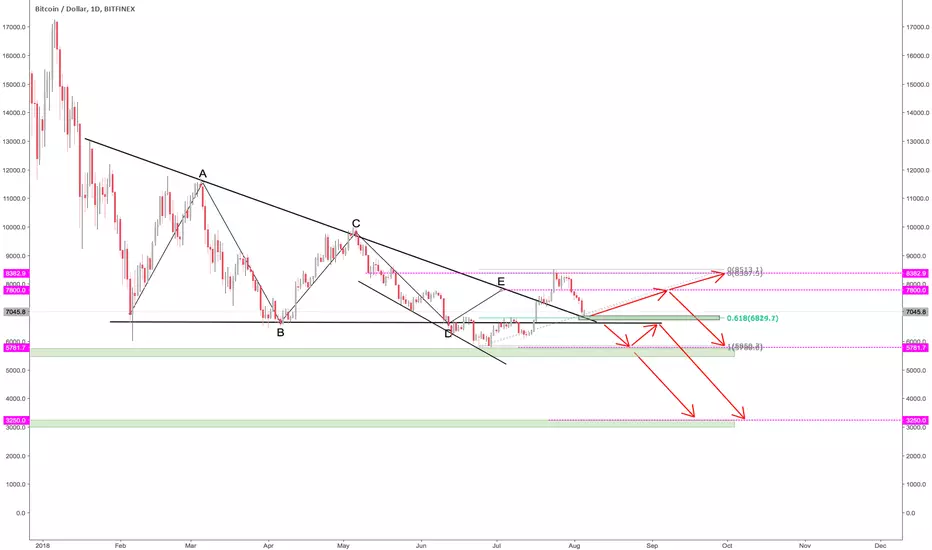
Position QHF 19.10.2018In past ideas, we have identified a large triangle, the boundaries of which were broken by a false shadow of market makers closing shorts (assuming the volume was created by market maker).
The range of buyers interest was specified (the price slowly slides down to that).
The position remains. In preference the game in long from the green range.
The primary targets at the exit of the model may be the levels near 7800.

Position QHF 17.10.2018After a short squeeze on the "tether is scam" news, the market began to stabilize.
The current situation with BTC indicates the formation of a possible (local) triangle model, out of which both up and down is possible to exit.
The boundaries of the midterm model of a larger triangle still remain relevant, as well as the logical development of the situation with the future price increases and the breakthrough up or down.
We are skeptical about a possible catastrophic sale down to the new minimum of 5750, because for the long period each negative event draws the rising minimums ..
We agree, not everyone is able to make money now. However, if you remove all info-noise and concentrate on simple and clear models, with constant risk / reward values, you can find the way.

Position QHF 15.10.2018The price broke out of a large triangle model, which, apparently, turned out to be a bear trap.
At this stage, you can safely look for longs. The model objectives are outside of 8500. Look for enter points on the local correction.
The target level of purchases located in the range of 7000-6800.

Position QHF 08.10.2018The price of Bitcoin continues to narrow the range of volatility, forming a triangle in a triangle. We have identified on the chart zones of double Fibonacci levels, which are most of all under the price, rather than higher.
The edges of possible graphical formations are built.
Paying attention to these details - they made an action plan, which suggests another sharp drop in prices a little later from the level of 7000-7200, in order to scare those who buy Bitcoin intraday.
In the coming hours, a test level of 6500 is possible, followed by an increase in the price to 7000, from where we expect another correction within the larger triangle model.


BTC/USD: Will we see a new ABC correction heading to 7700To my analyse BTC/USD has always hits blue-dat line by ACB correction. Not it is time to hit again !

BTC path to glory - BBANDS bounce to ichimoku cloud cross ideaWe are possibly bouncing off the lower bollinger band on the weekly.
Path to glory: bull run to middle line moving average, slight dip, then full bull run to above the clouds, the moon, and beyond!
Too simple or easy?
It's a long term move to watch - good luck!

BTC LONG I see ADX sure for Breackout , after price go to first 6k8 , then 7k2 .
buy BTC : 6K4
Sell target : 6k8
Sell target : 7k2 .

$BTC at decision point part 2$BTC also at $6800-6900 confluent with 0.618 fib retracement zone, where it can bounce or dump. 2:1 for bears right now in following scenario
BTC big move coming depending on MAIN SUPPORT 7.5kBtc is currently testing a very important support level around 7.5k is really important to hold for bulls or it's looking like another wave down to around 4.8k. Watch what btc does the next few days and enter a longer term trade.
This support is from all way back in jan 2018 so it's very important. If we break bellow it tells us that a high chance the breakout was not "the real run". If this happens you might have a GOLDEN chance to buy btc at bellow 5k. If support holds and btc goes above 9k it turns very bullish...waiting to see what happens.
Watch out for fake outs always put SL in profit!
Happy trading :)

Dalton BrothersJust a Idea, Not for fun
Ratios and Relativities!
Fine more?
Resistance and Support Ranges are shown on the chart.
The Main Battle in on the Battlefield
In Case of climbing $8,200, the next Target is 10000$
Otherwise the range of $5,500 - $4,000 will fall
Finally this year will reach over $20,000

IS BITCOIN DEAD? [2014 edition]The 2014's one and the current bubble look pretty same... I compared them and found out that both are based on Elliot's waves.
LOOK AT 2018 edition TO FIND SOME SIMILARITIES
I suggest you to read this in order to understand Elliot's waves

IS BITCOIN DEAD? [2018 edition] The 2014's one and the current bubble look pretty same... I compared them and found out that both are based on Elliot's waves.
LOOK AT 2014's edition TO FIND SOME SIMILARITIES
I suggest you to read this in order to understand Elliot's waves

BTCUSD Long term scenarioOn the 1-day timeframe chart long term BTC analysis suggests that BTC finally gains strength. There should be a new rally soon, it wont we similar to the previous where BTC was pumped however it will be a gradual rise within months till the middle of the Autumn. It doesn't look like this time BTC will fail again. There are a much more solid technical and fundamental foundation this time.
Ichi cloud lines intersection and XABCD pattern with repeated BB contraction suggest that there should be trend reverse. This is confirmed by regular bullish divergence and price movement in the median channel.
Nevertheless there are a high possibility of decrease in the short term. On the large timeframe scale it can be seen that the price should go back to the critical support level around $5900. There will be more thorough analysis of short term timeframe chart later.
Still there is no guarantee of a great and smooth rally. When it consolidates around support line in the short term there will be new wave of growth which can be accompanied by drawbacks or sharp rises.
We have a very strong rally foundation now the only problem is that the market is still not confident to just buy and FOMO again. Trust has been destroyed during two last month of market falls. So there is a big chance BTC will go sideways in the mid term after short term consolidation.
Conclusion: current BTC price rise is only upward correction of a downtrend in the short term. The price will move to the mentioned on the chart zone. However according to analysis in the long term the price should move upward after that till Autumn. Moreover in the mid term there is a chance of sideways movement.
Breaking $10 000 level will be a strong sign of a new wave of growth which will be confirmed after consolidation around $11 360

BTC in slumber? Looking longer term...Taking a longer term perspective on this one, using the weekly candles, reality sets in as i put on my bear glasses.
Historically, BTC saw an almost perfect recovery on the 50MA twice as highlighted in the green boxes, however, printing lower highs, and finally failed its 50MA support in May, resulting in further downward capitulation. For all those bulls out there, long term recovery/reversal might not be so soon as the next foreseeable support lies at the 100MA or 23% fib retracement level.
In the shorter term, BTC might look to retest the 50MA, but i'd be quite sceptical on its success. If i were to make a call, the lowest threshold would be in the 3,500 to 5,000 range. Furthermore, declining volume indicates weak interest in the market. What i'd be looking out for is an over-extension of the RSI, testing the 30 range - this might be a good buy zone.
Happy trading out there :)

This could be it! what's my next move? (BTC)Hello everyone
After a week with no ideas, I’m back! A lot to talk about today, let's get straight into this!
So first of all we've seen a relatively stable market for the last couple of days. BTC price stays between the 6.3K and 6.8K. That’s a very good sign. A couple of ideas ago I told you guys that I thought this market was going back up. We saw between may 30th and June 6th that the prices were stable aswell. Then I wrote that we've could see a possible break through like we saw back in the end of march. First of all a week or 2 with very stable prices and then a very nice uptrend. we can say that the stable price-action of the beginning of June was a false alarm. Now we're back with a stable market at a much lower point, this could really be it!
The next thing I want you to look at is the triangles. So we can see that the range between the highs and lows are getting smaller. that's because the volatility went down. The volatility went down because of the volume. If you check the volume bars, you can see that it has never reached the highs of December. The volume is consistently going down and that's the only scary thing that we're experiencing RN. So the logical result: if we go back up in the uptrend and the volume stays the same or decreases more --> then we will never go higher than the 9K mark. The thing that could save the low volume:
- BTC-etf
- ETH futures
- new institutions/ big investors coming in.
My next move:
- So we can clearly see that there is a huge potential in price action at the moment. The fundamental news is getting more positive aswell at the moment (ETH futures, ETH not a security, BTC etf,...)
- we can see that we are creating a nice new support-line at the moment. we're holding strong at 6.2K. For me we're def in a buy zone at the moment.
The most important things we've to look at:
- volume increasing?
-breaking through the downtrend?
- are we holding are support level
- Are we going through our next resistance (will be determined by volume)
my orders:
- I set my orders on 6.3K, if the markets go down, 6.3K will be a solid price at the moment if you ask me
- If BTC will continue to raise--> try to buy at a moment of lows (6.5/ 6.6 depending of the volume and momentum).
- Now at the moment I'm going to hodl and I’m going to wait to thick my wallet.
Give it a like if you appreciated it
comments and thoughts are always welcome
My orders are my thoughts and are no financial advice!


Selling my Lambo to buy BTCDotted lines: areas to watch for strong reversal indications.
1st entry: $4850-5100
2nd entry: $3000-3300

BTCUSD 6th month anniversary chart - Is BTC about to bounce ?Bitcoin has a 6th month anniversary from Jan 6. BTC has seen the dip and top points at 6th of every following months.
Now the next 6th is June 6.
And also Long term resistant level and Long term support levels cross each other at 15th June.
The next 6th month anniversary must be the bullish starting indicator for 2018.
I hope this is gonna happen. Good luck everyone.

BTC DECENDING CHANNEL Bitcoin has been following the same flow sequence since Jan 6 , every 6th of the months Feb, Mar ,Apr ,May , and following this Sequence it predicts that June should have an upwards momentum , but not until the decending channel from 6th of May ends on 6th of June.
Now in the last week of the decending Channel it points that we might hit $6300 before and upwards momentum.


4H support holding upThe 7,828.70 - 8,000 support zone on 4H was strong enough to break the Channel Down. 4H is now on a typical bullish reversal pattern (neutral RSI = 50.573, Highs/Lows = 0, over bullish MACD = 18.400 and STOCH = 72.856). 8,777 is the Resistance and the first bullish target of an emerging Channel Up, assuming that the 8,300 support holds (otherwise will not allow the Channel Up to emerge).
