Shakeout, or breakout? My BTC intraday playSuperStoch exhausted pretty much on all TF's. IF we are still in range, I am expecting downside. Over the red line and we may see a bullish breakout. Risky trade due to halving fomo, but great RR ratio.
Btcsell

BTC intraday short opportunityPrice moved upwards as predicted in the previous idea. We are now consolidating under one of the major trend-lines, where breakout usually occurs on the 3rd TL touch, which leads me to believe we are up for more complexity to form some bullish pattern against the main TL, I'd bet on WXY running flat to sweep the lows first, therefore shorting the 2nd touch (if we get there) with a very tight SL above the high could be the play of the day.


Bitcoin's Evening Star Pattern The Bitcoin price is in the process of creating a daily evening star pattern, which consists of
Bullish engulfing candlestick (March 19)
Doji (March 20)
Potential bearish engulfing candlestick
The pattern would be completed with a daily close below $5400, which would take the price towards the range lows at $40xx.
Please leave a LIKE if you enjoy the analysis.


Bitcoin bull run Confimerd in daily chart!!Bitcoin bull run is been confirmed as the 20 MA crossed 200, whoever still waiting for 50 MA to cross.
A small pullback is been expected from 10,200$ mark

BTCUSD - Sell 10/02/2020Friends, please before reading, support this idea with your Like and any Comment, thanks.
You can sell BTCUSD from 10000
Stop-loss at 10200
You will find more trading ideas in SAV Finance community.

BTC USD SHORT - STRONG RESISTANCE - SHORTTERMBTC will go down to retest the Downtrend channel - after that, we will continue the uptrend.
Short - short term
Lets go to 7500 $ USD i think its more or less a flash crash to this target.
We have to shake out the last weak hands out of this market.


BTCUSD - thoughts part 2Just a continuation from my last post. I am learning and do not recommend placing trades off my charts

BTCUSD SellShort position
1.Strong resistance level
2.Rising wedge
3.Second retest resistance area
4.R/R is >1.5
5.TP 1 / 7393.

BTC (Bitcoin) still range-boundThe most popular cryptocurrency opened trading on Monday, November 4 with a 2.3 percent increase and a green candle to $9,423. It peaked at $9,597 during intraday and successfully broke above the 38.20% Fibonacci level.
Bulls, however, were not able to hold their territory and retreated to $9,311 on the next day, Tuesday, November 5. We saw the BTC/USD pair trading as low as $9,174 during the session.
On Wednesday, November 6, bitcoin was trading lower around noon but managed to recover in the evening closing with at $9,347.
BTC still ranging in the $9,500-$9,000 zone as $9,500 also is covered by the Fibonacci 38.20%
Expecting a drop below $9,000 in the coming days mainly due to the relatively low volume - between $22-$28 billion since November 4, still lower compared to the peaks in late October, and low volatility. Bulls seem weak and out of steam.


SHORT BTC GET RICH - THIS SCAM GOES TO 4K EOYIt is simple gravity.
What goes up must go down.
Haven't you learned already? I hope you took the short I've told you in Sample #1 and Sample #2.
This is all Tether manipulation!

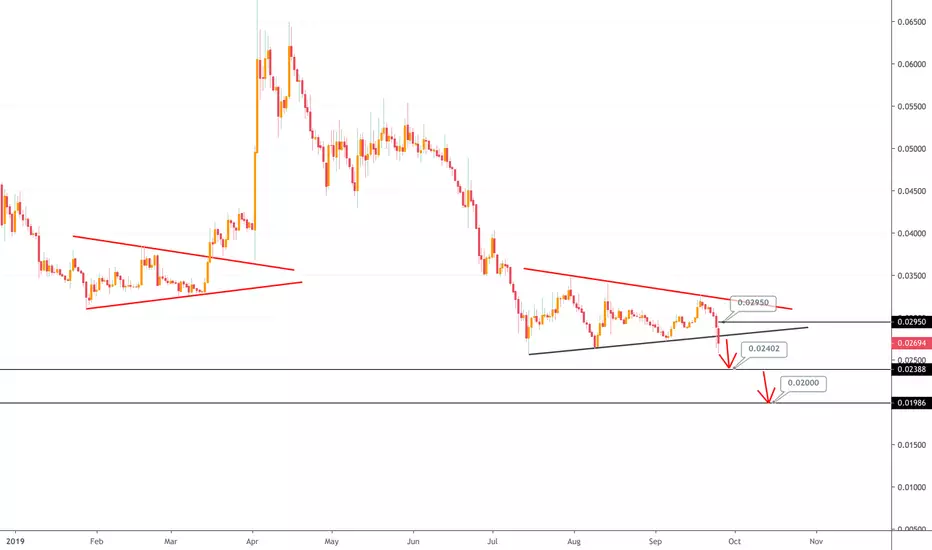
BCH NOT GOOD - OR SELL OR SHORT The market has just plummeted, but for a classic pattern trader I still have to share with you the bad thing about BCH / BTC.
BCH SELL OR SHORT (X3) FROM : 0.0270-0.02750
TARGET 1 : 0.02400
TARGER 2 : 0.02000
SL : 0.02950


BTC BULL TRAPjust watch at the volume, volume is decreasing an price is going up with no reason. That's the definition of bull trap. :D

CRYPTO: BITCOIN (XBTUSD) BTC SHORT OPPORTUNITY - WEEKLY PINBARAfter a rallying week to $14k, we saw a massive sell-off, which, to be fair was expected so let's not be disheartened by it. A pullback is healthy and necessary to sustain any gains in the markets... and a great opportunity to buy back in at a low price so I welcome them with open arms :)
If the weekly candle closes below $10.7k, this would be confirmation that the bears have taken control and I would expect a breach of $10k.
I have set out target support levels where I would expect a significant bounce from and levels that we are likely to test/reject:
Level 1: $10,000.00
Level 2: $9,200.00
Level 3: $7,350.00
Level 4: $6,000.00


Btc looks strong update to the recent chartat most best case if it goes up from 5800 then this is scenario

Next moves of almighty BTC As given idea in my first ever my published chart in tradingview (was not best looking chart or professional) but with the best possible prediction and same happened as told. Now it is risky to hold BTC as per me i believe by looking risk return management and also the scenario which has more probability to happen or next move most probably going to happen is downside.
The scenario is only invalidated when btc closes two daily candles and one weekly candle above 6300 then i can say we are really in bullmarket and rebuying btc could be good.But i dont think this is going to happen.
The risk to hold is bigger and loss is 10% but the return is 30-40% and risk is less to hold.
last thing is when tether fud happened there were all different types of chart in different exchange. somewhere it was looking like we brokedown and we are directly going down and somewhere it was like my chart is playing out. so i was totally confused therefore gave those bearish charts but with tight stop loss and we gained nice profit with almost very little loss and now be ready for downside move.
