BTC BIG SHORT!We did a mirror retest, and many other signals also point to a sharp decline, indicating numerological codes 69/96.
Btcshort

BTC SCALP TradeWait for the entry then take with small amount no high risk must use SL. If BTC don't retrace towards 106.5k in coming hours then don't take risk on shorting it will breakout towards 113k

BTC - High Probability Trade Idea Here we have a major resistance at this upper level. And market seems to create a "Double Top Patter". So its indicating a possible bearish move.
Target and Sl on chart. Follow risk and money management.
BINANCE:BTCUSDT BITSTAMP:BTCUSD BINANCE:BTCUSDT.P INDEX:BTCUSD BYBIT:BTCUSDT.P BINANCE:BTCUSD

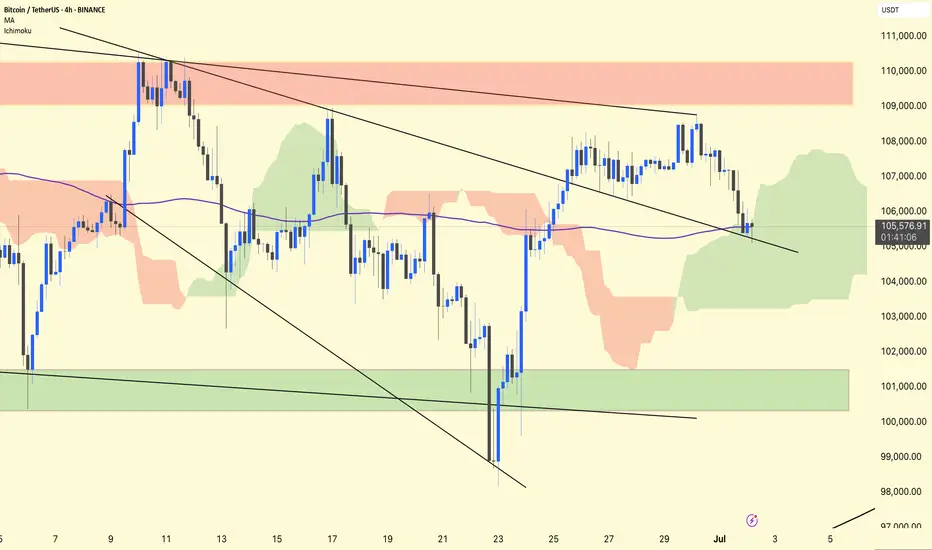
BTC/USDT 4H Analysis.
BTC remains in a retest phase after breaking out of the first descending broadening wedge.
The price has returned to test the upper wedge trendline, which is now acting as support around ~$105,500.
The purple 1 00-period MA (~105,570) overlaps this retest zone, adding additional confluence to the support.
Ichimoku
BTC is inside a green cloud, indicating indecision but not a confirmed trend reversal.
The cloud provides dynamic support in the ~$104,500–105,500 area.
Stay alert!
BTC at Critical Resistance… Drop Incoming!Hi traders! Currently analyzing BTCUSD on the 1H timeframe.
Price is reacting to the upper boundary of a descending channel, where sellers are showing strong pressure. This area has previously acted as a significant resistance, pushing price lower multiple times.
I'm now selling from 108,075.19, expecting a bearish move towards my target at the bottom of the channel.
Take Profit: 104,493.63
Stop Loss: 111,891.49
RSI is showing signs of bearish divergence near the resistance area, adding confluence to this setup.
Price may have performed a liquidity grab above the trendline before rejecting the area, which aligns with the current market structure.
I'm actively managing this trade, keeping an eye on how price behaves around this key level.
Disclaimer: This is not financial advice. This is my personal analysis shared for educational purposes only.

BTC Pullback or Breakout? Key Levels to Watch Around 110KBitcoin is showing repeated rejections from the $110K and $108K zones. Currently, it's moving upward from the $98K area toward resistance, but price action remains compressed between the major trendline support and resistance.
This range-bound structure suggests that a pullback may be imminent, especially as RSI is forming consistent bearish divergence and the MACD is signaling weakness. A liquidity sweep to the downside could occur before a decisive move.
However, if BTC manages to break above the converging trendlines with strong volume, we may see a move toward $110K again for a retest. Watch $106K as an intermediate support. If that fails, further downside may follow.
📌 Trading Insight: Wait for confirmation before entering — don’t jump in without a clear signal.

BTCUSDT SHORT SIGNAL Setup Type: Liquidity Trap & Distribution
Trade Idea (SHORT):
Entry Zone: $108,000 – $110000
Stop Loss: Above $113000
Take Profit Targets:
TP1: $104,000
TP2: $100,000
TP3: 98000
TP4: 74000
This analysis is for educational purposes only and does not constitute financial advice.
Always do your own research and apply proper risk management.
Trading involves risk, and you are solely responsible for your decisions.
Use this information as a guide — not a guaranteed outcome.
Wait for clear confirmation before executing any trade.

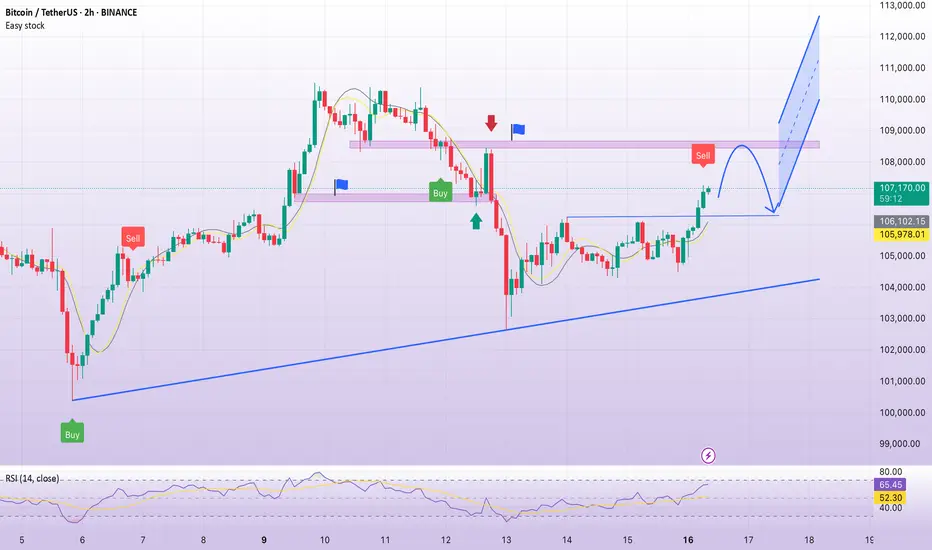
2/1/15I’ve found a fractal on Bitcoin. Today is June 25, 2025, 13:22 — I’m analyzing the 2-hour timeframe from the high on May 22 up to today, and the same pattern of pre-accumulation is forming as in 2024, from March 13 to July 29, 2024.
We are also inside a pattern I named “Dragon’s Wings.” It forms two peaks at the highs after a strong rally, and the shared low between them creates a deep retracement.
Whether this pattern leads to the beginning of a major drop and a bear cycle, or whether it’s a pre-accumulation structure in a buffer zone, depends on the area in which it forms.
In this case, the 93–74K zone is potentially a re-accumulation zone, with a reversal to the upside — possibly taking Bitcoin above $140,000.

BTC, Selling pressure below 100K, 23 JunePlan BTC today: 23 June 2025
Related Information:!!!
Market capitalisation fell to $3.03 trillion over the weekend, likely due to speculators expecting a sell-off in response to US strikes on targets in Iran. However, the limited reaction from traditional financial markets brought buyers back to the crypto space, showing their willingness to buy at a discount and pushing market capitalisation back up to $3.12 trillion.
The cryptocurrency sentiment index dropped to 42 on Sunday, its lowest level in two months, but rebounded to 47 at the start of the new week, moving from the fear zone into neutral territory.
Bitcoin slipped to $98K over the weekend, briefly touching the classic support level at 61.8% of the April–May rally. However, by the start of the European trading session, it had already recovered to around $102K, compared to $102.7K at the beginning of Sunday. Still, last week’s sell-off broke the 50-day moving average support, weighed down by external factors. A breakout from the $96K–$105K range will likely determine the direction of the next major move
personal opinion:!!!
Selling pressure caused gold price to drop below 100k yesterday, macro economy has not changed much. Gold price continues to suffer selling pressure
Important price zone to consider :!!!
support zone : 100.800 ; 98.200
Sustainable trading to beat the market

BTC is expected to continue its decline to 100,000BTC has encountered resistance and fallen back several times near 110,000, forming an absolute suppression in the short term. It is difficult for BTC to overcome this resistance area in the short term. As BTC has been unable to break through for a long time, some profit-taking and panic selling will cause BTC to gradually collapse. At present, BTC has fallen back to around 104,000. During the retracement, it has built a short-term resistance area of 105,500-106,000, which limits the rebound space in the short term and will further strengthen the bearish sentiment in the market. BTC will completely open up the downward space.
At present, the 103,000-102,500 area still has a certain support effect on BTC. As BTC shows a volatile downward trend, this support area will be broken again and continue to fall to the area near 100,000. Therefore, in short-term trading, we can consider shorting BTC in the 105,000-105,500 area.
BINANCE:BTCUSDT BITSTAMP:BTCUSD BINANCE:BTCUSDT COINBASE:BTCUSD

Bitcoin (BTC/USDT) – Bearish Continuation After Failed Support !Bitcoin attempted to hold the $101,409 support level but failed to sustain above it. The breakdown confirms weakness, and the chart now suggests a continuation of the downtrend if bulls don’t reclaim lost ground quickly.
Technical Breakdown:
Failed Bounce: BTC briefly bounced near $101.4K but got rejected and closed back below the zone.
Bearish Structure: Price continues forming lower highs and lower lows — a clear downtrend.
RSI at 30.34: Close to oversold but still room to fall, which means downside isn’t exhausted yet.
Market Sentiment: Weak hands are exiting, and support zones are getting tested faster than they’re defended.
Key Levels to Watch:
Resistance:
$101,409 – Immediate level, now flipped to resistance
$103,573 – Strong barrier if bulls attempt recovery
$105,807 – Major horizontal resistance and lower high zone
Support:
$97,340 – Next major support zone (possible short-term bounce)
$93,343 – Key level if $97.3K fails to hold
$92,200 – Final support before panic could set in
Trade Idea – Bearish Bias:
Short on Retest Zone: $101.4K – $102K
Stoploss: Above $103.6K
Take-Profit Targets:
TP1: $97,300
TP2: $93,300
TP3: Optional – trail lower if breakdown continues
What Bulls Need to Do:
Reclaim $101.4K fast with a strong close above it on the 4H chart
Otherwise, sellers remain in control
This is not financial advice. Always do your own research (DYOR) and manage your risk accordingly.

Bitcoin (BTC/USDT) – Bearish Breakdown in Play (4H)BTC has lost key support at $103,573 on the 4-hour timeframe, breaking down from the recent consolidation zone. The rejection from the lower highs and weakening RSI suggest more downside pressure ahead.
Technical Breakdown:
Support Broken: $103,573 (now acting as resistance)
Current Price: $102,246
Next Key Support Zones:
$101,410 (short-term bounce zone)
$97,340 – critical horizontal support
$93,343 – potential deeper flush area
Resistance to Watch:
$103,573 (retest = short opportunity)
$105,807 (major rejection zone)
Short Setup (Signal Style):
Short Entry: ~$103,500 (if retested)
Stoploss: Above $105,800
Targets:
TP1: $101,400
TP2: $97,300
TP3: $93,300
Final Note:
Trend remains bearish below $103.5K. Bulls need to reclaim that level fast or further downside becomes likely.
Not financial advice. DYOR.

continue to move accumulation: below 109,000💎 Update Plan BTC (June 20)
Notable news about BTC:
Semler Scientific (SMLR) unveiled an ambitious three-year strategy on Thursday aimed at significantly expanding its Bitcoin holdings to 105,000 BTC by the end of 2027. The announcement coincided with the appointment of a new executive to lead the firm’s digital asset initiative.
The Nasdaq-listed healthcare firm has named Joe Burnett as its Director of Bitcoin Strategy, a move it believes will strengthen its long-term treasury vision and enhance shareholder value. As part of this strategic shift, Semler Scientific plans to accumulate Bitcoin through a mix of equity and debt financing, alongside reinvested cash flows from its core business operations.
Technical analysis angle
BTC as well as XauUSD are trapped in the channel price 104k to 110k these are also two important milestones of BTC. Also congratulations to investors when detecting the bottom of 104k. The next expectation within the price channel is still maintained at 110k landmark
But with the recent moves of investors, the community is afraid that BTC will continue to adjust in the future.
==> Comments for trend reference. Wishing investors successfully trading

Warning: BTC Just Got Rejected HARD — Next Stop $101KBTCUSDT 4H Technical Analysis – Bearish Setup in Motion
The current 4-hour chart of BTCUSDT on Binance paints a clearly bearish picture, driven by strong confluence between the Ichimoku Cloud system, price structure, and descending trend channel. Market sentiment has shifted from indecision to downside control, and unless bulls reclaim critical zones soon, a drop toward $101,900 appears highly likely.
Ichimoku Cloud: Bearish Confirmation on Multiple Levels
The Ichimoku Cloud indicator in this setup plays a dominant role in forming the bearish bias. First, the price action has broken below the Kumo (cloud) and is currently rejecting it from the underside. This behavior alone signals a shift in sentiment, as the cloud now acts as dynamic resistance.
The Tenkan-sen (conversion line), shown in blue, has crossed below the Kijun-sen (baseline) in red—this is a strong bearish crossover. Notably, this crossover occurred below the cloud, which within Ichimoku principles is considered one of the most powerful bearish signals available. It reflects a synchronized decline in both short-term and medium-term momentum.
Furthermore, the future cloud (Senkou Span A and B projection) is flat and shaded in red, signaling weak bullish momentum ahead and strengthening the case for a downward continuation. Flat Kumo tops also indicate a magnet for price, often pulling it back for a re-test before continuation—precisely what is unfolding here.
The Chikou Span (lagging line), which plots the current price 26 periods back, is well below both the price and the Kumo. This further confirms that market sentiment, momentum, and trend direction are all biased to the downside.
Price Structure and Trend Channel
Overlaying the chart is a clearly defined descending parallel channel, capturing the recent series of lower highs and lower lows. Price has respected this channel on multiple occasions, rebounding near its bounds and reacting to its midline as dynamic support and resistance.
Currently, BTCUSDT is moving lower after retesting the mid-range of this descending channel, which aligns with the bottom of the Ichimoku Cloud. This overlap creates a powerful resistance confluence between $104,600 and $105,800—exactly where price was rejected in the most recent candle clusters.
The repeated failure to break back into the cloud shows that supply pressure is overwhelming, and bulls are losing grip of any short-term recovery.
Liquidity Zones and Risk-Reward Mapping
A red shaded area marks the resistance zone, aligning with the upper boundary of the cloud and the mid-channel structure. This region, between $104,600 and $105,900, has repeatedly acted as a rejection area and represents where sellers are currently stepping in with confidence.
Meanwhile, the projected target is highlighted through the green shaded rectangle, roughly between $101,900 and $102,200, representing the next strong demand zone and the lower boundary of the descending channel.
The downward arrow on the chart visually reinforces this bearish idea, indicating a continuation of the current momentum toward those support levels.
Trade Setup Based on Chart
This current structure provides a clean, high-probability trade opportunity for bearish traders looking to capitalize on further downside in BTC:
• Entry Zone: $104,500 – $105,000
• Stop Loss: Above $106,200 (just above cloud resistance and recent rejection wicks)
• Target: $101,900
• Risk-Reward Ratio: Approximately 1:2.3 (depending on entry)
Final Thoughts
The technical case for shorting BTCUSDT here is robust. The Ichimoku system aligns on all fronts—price below the cloud, bearish Tenkan/Kijun crossover under the Kumo, a red future cloud, and a bearish Chikou Span. On top of that, price action is obeying a descending channel and just rejected from its midpoint.
If this setup plays out as expected, BTC is likely to retest the $101,900 region before bulls attempt to regain control. Scalpers may consider dynamic trailing stops below $104,000, but positional shorts can hold with clear invalidation above the red cloud zone.

BTC accumulates, back to 108,500Plan BTC today: 16 June 2025
Related Information:
The price of gold is nearing its all-time high as tensions in the Middle East escalate, but analysts say they’re doubtful Bitcoin will do the same as investors prioritize other safe-haven assets.
The price of gold rose to $3,450 per ounce on Monday, just $50 shy of its all-time high of just below $3,500 in April, according to TradingView.
The usually slow-to-move asset has gained a whopping 30% since the beginning of the year, catalyzed by US President Donald Trump’s trade tariffs and, more recently, an escalation of military action in the Middle East following an Israeli missile strike on Iran on June 13, which caused Bitcoin prices to fall.
Gold prices have also been linked with inflationary pressures, as it is considered a safe haven and an inflation hedge by investors.
personal opinion:
The crypto market recovered at the beginning of the week after being affected by war news. It will almost certainly continue to maintain the 4.5% interest rate, so it will be difficult to break ATH this week.
Important price zone to consider :
Sell point: zone 108.400 - 108.600 SL : 109.100
Take profit : 107.900 - 107.000 - 106.000
Sustainable trading to beat the market
BTC/USDT 4H Chart Update –BTC/USDT 4H Chart Update –
After a strong rejection from the $110K+ zone, Bitcoin is now retesting a critical trendline support on the 4-hour chart.
Key Highlights:
Price dropped sharply to $103K, almost tagging the key ascending support zone.
The previous breakout from the descending trendline is now being retested, which is a classic bullish retest pattern.
If bulls defend this region successfully, expect a potential bounce towards $108K–$ 114 K.
However, a clean breakdown below $102K would shift short-term momentum bearish.
Eyes on this zone. High-probability decision area.
Watch for reaction candles and volume spikes to confirm the next move.
Thanks for your support!
DYOR. NFA

BTC/USDT 1DAY CHART UPDATE !!Bitcoin displays a classic “cup and handle” structure on the daily timeframe – a historically bullish continuation pattern. The price has successfully broken above the neckline (~$107,000), indicating that bullish momentum is underway.
Thanks for your support!
DYOR. NFA

BTC bearish in Short termBTC has broken the 31 May low, so the short-term view is bearish.
It also made a head and shoulder pattern, which supports the view on the short side.
As gold and silver are bullish and DXY (dollar index) bearish, then a flat pattern (5 wave up) mentioned in the chart is also possible
In both cases, BTC is short-term bearish
Plz Follow me on X for more updates

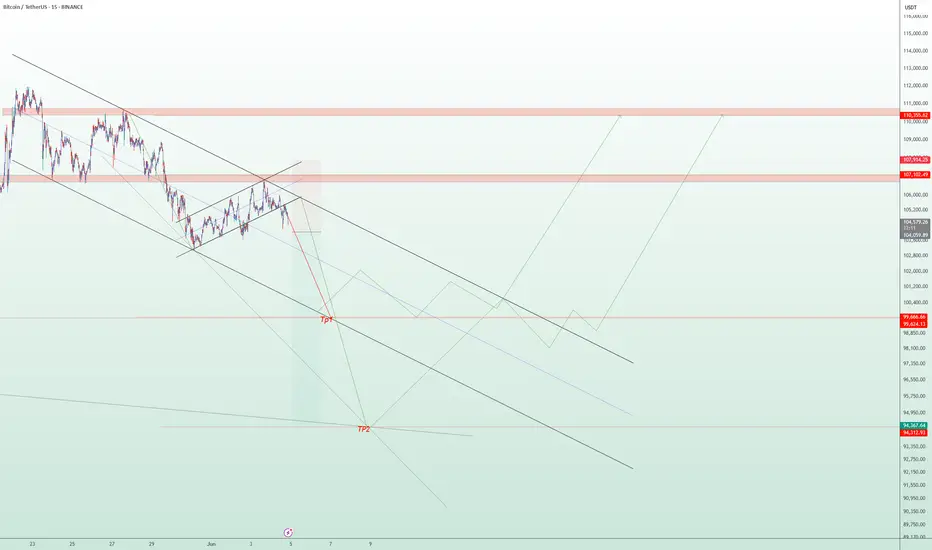
BTC/USDT Technical Analysis – 15-Min Chart | Short-Term Bearish The current price action of Bitcoin (BTC/USDT) shows a sustained bearish trend within a well-defined descending channel. Following a temporary bullish correction in the form of a rising channel, the price faced strong resistance around the $107,000–$110,500 supply zone and is now showing signs of a bearish breakout.
📉 Key Technical Observations:
A clear rejection from the upper resistance zone has led to a breakdown below the rising correction channel.
Immediate support zones are identified around $99,600 (TP1) and $94,300 (TP2), where price may potentially stabilize or bounce.
The bearish momentum remains dominant unless a strong reversal above $107,000 occurs.
📌 Scenarios to Watch:
Bearish Scenario: Price could continue falling toward TP1 and possibly TP2 if momentum holds and no strong reversal signals appear.
Bullish Reversal Scenario: A bounce from support levels with higher lows and a break above $107,000 could signal the beginning of a new bullish phase.
🔔 Disclaimer:
This analysis is intended for educational and informational purposes only. It is not financial advice. Please conduct your own research and risk assessment before making any trading decisions.
Was that end of bull run? BTC Price action + signal!Hello everyone! i want share my idea + signal at bitcoin.
I'll make simple technical analysis, yesterday bitcoin test 106500 LVL but i think sellers are still strong and they will brake that support zone and then we have 101000-100000 support zone where we can see real buyers if we are still in bull trend. in my opinion bear trend will start soon.
Why bitcoin made new high? with technical it tested 1 week FVG and it worked well but what happened exactly?
Despite the high, profit-taking is evident. On-chain data shows $4.02B in volume from 1–5y holders (highest since February), suggesting old hands are selling into strength. ETF inflows slowed this week, and the Fear & Greed Index at 74 (“Greed”) signals potential overheating. If $100K fails, a deeper correction to $90K–$87K could confirm a short-term bear trend.
Institutional Adoption: Highlighted $40B+ ETF inflows and corporate buying (e.g., MicroStrategy), as these are major drivers of the $111,880 high on May 22, 2025.
Regulatory Tailwinds: Noted Trump’s re-election and SEC speculation, which markets priced in as bullish.
Halving & Scarcity: Linked the April 2024 halving to reduced supply, supported by on-chain data showing low exchange inflows.
Macro Factors: Tied Fed rate cuts and BTC’s “digital gold” narrative to the rally, as these are widely discussed in 2024–2025.
Added on-chain evidence ($4.02B volume from older holders) to support your view of profit-taking and seller strength.
Noted slowing ETF inflows and high Fear & Greed Index (74) to justify a potential correction, aligning with your bearish outlook.
Suggested $100K as a critical level to watch, with a break below signaling a deeper drop to $90K–$87K, giving traders a clear risk framework.
This is not long term, short signal but for few days it will be good, we have FOMC soon and it will show us real bitcoin price direction.
Open short at 1075000
Stop loss at 109000
Take profit at 101000
Always make your own research!!!!
for collaboration text me Private!!!

btc on selling#BTCUSD price have recorrect above 105600 showing bullish range, now we need price to fall to cover the projection.
Sell Below 105545, take profit 103555, Stop loss 106360.
Possible closure on current H1 above 106360 will break the next zone 106900-107200.

THE END OF BTC!🚨 SOMETHING BIG IS COMING TO THE CRYPTO MARKET 🚨
Two massive bearish divergences flashing on the HIGHER TIMEFRAMES:
🟥 WEEKLY
🟥 MONTHLY
This is NOT just noise. These divergences don’t show up for fun — they often precede violent corrections.
We might be standing right in front of a major crash.
Maybe not from today, but August could be the breaking point.
Risk is growing.
Liquidity is thinning.
Smart money is already adjusting.
If you think the bull run will last forever — think again.
I’m watching this setup VERY closely.
🚩 Stay sharp. Stay protected.

Possible Bear MoveCurrently monitoring its bearish trend and identifying additional potential zones for shorting opportunities.
