BTC/USDT 1DAY CHART UPDATE !!Bitcoin displays a classic “cup and handle” structure on the daily timeframe – a historically bullish continuation pattern. The price has successfully broken above the neckline (~$107,000), indicating that bullish momentum is underway.
Thanks for your support!
DYOR. NFA
Btcshort

BTC bearish in Short termBTC has broken the 31 May low, so the short-term view is bearish.
It also made a head and shoulder pattern, which supports the view on the short side.
As gold and silver are bullish and DXY (dollar index) bearish, then a flat pattern (5 wave up) mentioned in the chart is also possible
In both cases, BTC is short-term bearish
Plz Follow me on X for more updates

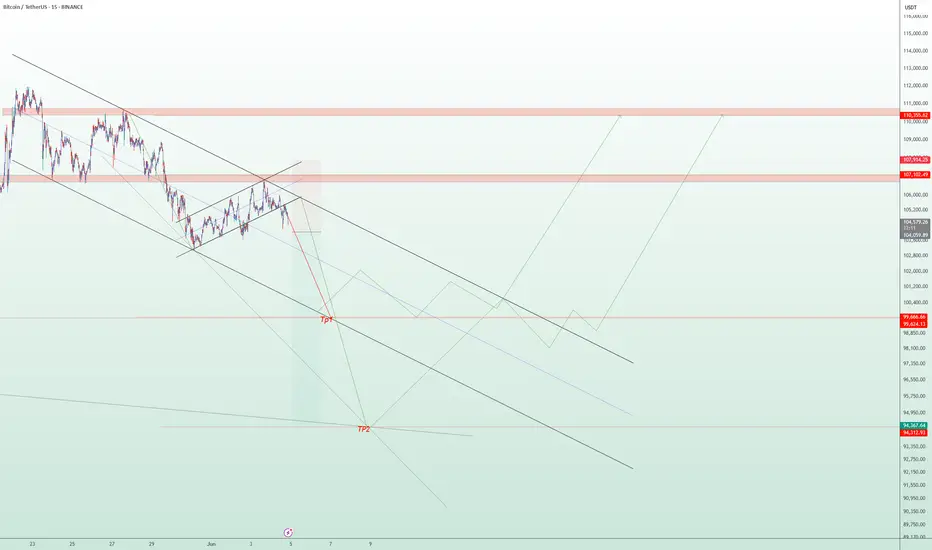
BTC/USDT Technical Analysis – 15-Min Chart | Short-Term Bearish The current price action of Bitcoin (BTC/USDT) shows a sustained bearish trend within a well-defined descending channel. Following a temporary bullish correction in the form of a rising channel, the price faced strong resistance around the $107,000–$110,500 supply zone and is now showing signs of a bearish breakout.
📉 Key Technical Observations:
A clear rejection from the upper resistance zone has led to a breakdown below the rising correction channel.
Immediate support zones are identified around $99,600 (TP1) and $94,300 (TP2), where price may potentially stabilize or bounce.
The bearish momentum remains dominant unless a strong reversal above $107,000 occurs.
📌 Scenarios to Watch:
Bearish Scenario: Price could continue falling toward TP1 and possibly TP2 if momentum holds and no strong reversal signals appear.
Bullish Reversal Scenario: A bounce from support levels with higher lows and a break above $107,000 could signal the beginning of a new bullish phase.
🔔 Disclaimer:
This analysis is intended for educational and informational purposes only. It is not financial advice. Please conduct your own research and risk assessment before making any trading decisions.
Was that end of bull run? BTC Price action + signal!Hello everyone! i want share my idea + signal at bitcoin.
I'll make simple technical analysis, yesterday bitcoin test 106500 LVL but i think sellers are still strong and they will brake that support zone and then we have 101000-100000 support zone where we can see real buyers if we are still in bull trend. in my opinion bear trend will start soon.
Why bitcoin made new high? with technical it tested 1 week FVG and it worked well but what happened exactly?
Despite the high, profit-taking is evident. On-chain data shows $4.02B in volume from 1–5y holders (highest since February), suggesting old hands are selling into strength. ETF inflows slowed this week, and the Fear & Greed Index at 74 (“Greed”) signals potential overheating. If $100K fails, a deeper correction to $90K–$87K could confirm a short-term bear trend.
Institutional Adoption: Highlighted $40B+ ETF inflows and corporate buying (e.g., MicroStrategy), as these are major drivers of the $111,880 high on May 22, 2025.
Regulatory Tailwinds: Noted Trump’s re-election and SEC speculation, which markets priced in as bullish.
Halving & Scarcity: Linked the April 2024 halving to reduced supply, supported by on-chain data showing low exchange inflows.
Macro Factors: Tied Fed rate cuts and BTC’s “digital gold” narrative to the rally, as these are widely discussed in 2024–2025.
Added on-chain evidence ($4.02B volume from older holders) to support your view of profit-taking and seller strength.
Noted slowing ETF inflows and high Fear & Greed Index (74) to justify a potential correction, aligning with your bearish outlook.
Suggested $100K as a critical level to watch, with a break below signaling a deeper drop to $90K–$87K, giving traders a clear risk framework.
This is not long term, short signal but for few days it will be good, we have FOMC soon and it will show us real bitcoin price direction.
Open short at 1075000
Stop loss at 109000
Take profit at 101000
Always make your own research!!!!
for collaboration text me Private!!!

btc on selling#BTCUSD price have recorrect above 105600 showing bullish range, now we need price to fall to cover the projection.
Sell Below 105545, take profit 103555, Stop loss 106360.
Possible closure on current H1 above 106360 will break the next zone 106900-107200.

THE END OF BTC!🚨 SOMETHING BIG IS COMING TO THE CRYPTO MARKET 🚨
Two massive bearish divergences flashing on the HIGHER TIMEFRAMES:
🟥 WEEKLY
🟥 MONTHLY
This is NOT just noise. These divergences don’t show up for fun — they often precede violent corrections.
We might be standing right in front of a major crash.
Maybe not from today, but August could be the breaking point.
Risk is growing.
Liquidity is thinning.
Smart money is already adjusting.
If you think the bull run will last forever — think again.
I’m watching this setup VERY closely.
🚩 Stay sharp. Stay protected.

Possible Bear MoveCurrently monitoring its bearish trend and identifying additional potential zones for shorting opportunities.

BTC/USDT CHART UPDATE !!Chart Pattern: Inverted Head and Shoulders (iH&S)
The chart shows a classic reversal pattern of the head and shoulders formation.
Left Shoulder: Late January 2025
Head: April 2025
Right Shoulder: Potentially forming near current levels (~$100K–$102K)
This bullish reversal pattern often leads to a strong bounce if the neckline is respected.
Support Zones:
$98,000 – $100,000: 50 EMA (red) and retest of the area near the neckline
$94,500 – $95,000: 200 EMA (green), last resort support
Resistance Levels:
$108,000 (horizontal neckline resistance)
$112,000 and $125,000 (bullish breakout targets)
Scenario Outlook
Bullish Case: If BTC maintains the $100K area and breaks above $108K with volume → rally towards $115K–$125 K.
Bearish Case: Breakdown below $94K invalidates the iH&S structure.
Thanks for your support!
DYOR. NFA

BTC/USDT – Retest in Play After Breakdown!Bitcoin broke below its 4H ascending trendline and is now showing signs of a retest at the broken trendline zone.
It tried to break the immediate resistance of $105,100 but couldn't sustain it.
📉 Breakdown confirmed
Key Levels:
Resistance: $105,968 | $108,941
Support: $101,539 | $97,205
Bearish Target remains near $97K if rejection holds
Watch how the price reacts here — rejection could lead to further downside. A break back above $105K may invalidate the move.
#Bitcoin #BTCUSDT #CryptoTrading #TechnicalAnalysis #TrendlineBreak #Retest #BearishSetup #PriceAction

BTC short term correction: zone 100k💎 BTC PLAN UPDATE (June 2)
NOTABLE NEWS ABOUT BTC:
Meta shareholders have decisively voted down a proposal to explore adding Bitcoin to the company’s balance sheet, signaling limited appetite for crypto exposure at the tech giant.
According to a regulatory filing dated May 28, the “Bitcoin treasury assessment” proposal garnered just 3.92 million votes in favor — representing a mere 0.08% of total shares — while nearly 5 billion votes against it.
Given that CEO Mark Zuckerberg holds 61% of Meta's voting power, as disclosed in an April filing, it is likely he played a pivotal role in rejecting the measure.
TECHNICAL ANALYSIS PERSPECTIVE
Bitcoin closed below the daily support level of $106,406 on Thursday and fell another 1.50% the following day. However, prices saw a slight recovery over the weekend. As of Monday's writing, BTC is trading below $105,500.
Assuming BTC faces resistance around the $106,406 daily level and continues correcting, it could extend the decline to retest the psychologically important $100,000 mark.
The Relative Strength Index (RSI) on the daily chart is at 53, trending down toward the neutral level of 50, indicating weakening bullish momentum. The Moving Average Convergence Divergence (MACD) also showed a bearish crossover last week. The increasing red histogram bars below the baseline further signal a potential correction ahead.
At this point, whether you are new or experienced, it’s advised to spend more time practicing and enhancing your knowledge of technical analysis. Consider exploring educational posts on the channel (…) to strengthen your foundation and avoid losses during this period.
==> This is a trend-based analysis for reference only. Wishing all investors successful trades!

Bitcoin (BTC) Market Analysis1. Previous Analysis Validation
Our previous week's analysis played out perfectly, aligning well with the market movement.
2. Current Market Sentiment
The market remains bearish overall. However, we are seeing a short-term price pump, likely due to late short positions entering the market. This is resulting in a price move to trigger short liquidations. The recent 4H swing highs are acting as key stop-loss zones.
3. Imbalance & Rebalancing
The price is moving upward toward a daily imbalance area (highlighted in orange). We expect the market to rebalance in this zone, potentially leading to a price rejection and continuation of the downward trend.
4. Liquidity Zone
Our primary liquidity zone lies between \$100K and \$98K. We anticipate this area to be a key region for price reaction.
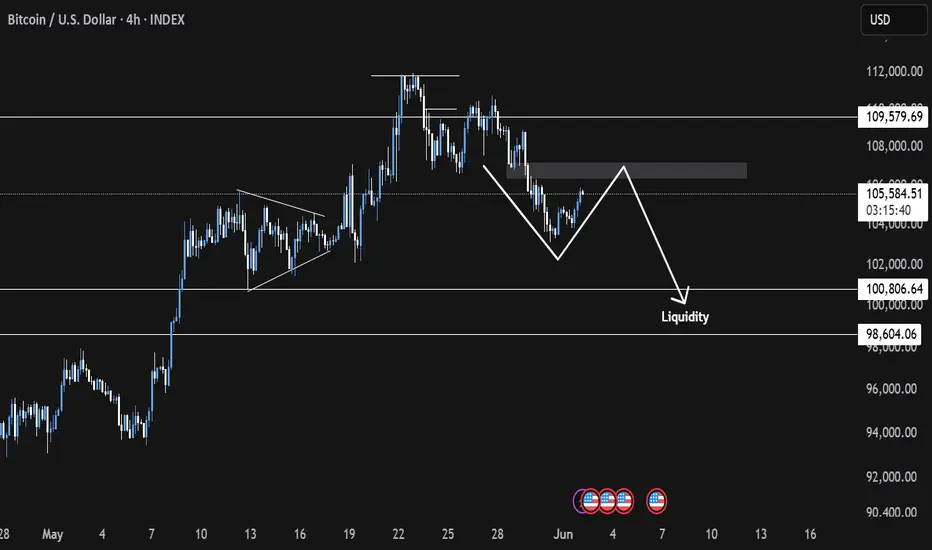
Daily BTC/USD Analysis - Smart Money PerspectivePrice recently swept liquidity above the previous weekly high, indicating a classic liquidity grab. After this move, we observed a market structure shift (MSS) to the downside, followed by a break and a mitigation of a bearish imbalance (BAG).
Currently, price is reacting from a small fair value gap (FVG), but this is likely just a retracement. I'm expecting the market to drop further and target the larger FVG zone that aligns on both the weekly and daily timeframes (highlighted in blue). This zone also aligns with a potential POI (point of interest) for smart money accumulation.
📌 Short-term bias: Bearish
🎯 Target: 99,000–97,000 zone
🔍 Watch for rejection at current FVG or possible internal liquidity grab before the drop.
Smart money is likely to seek deeper liquidity before any meaningful bullish continuation. Stay patient and let price come to the premium zone.

BTC/USDT Chart Analysis.
BTC has been in an uptrend since early April 2025, breaking above a strong horizontal resistance line (visible in the chart).
However, we can now observe a descending channel (falling wedge) after the peak, indicating a potential pullback.
Support Levels:
The price has tested the 50-day SMA (red) and is approaching the 200-day SMA (green), which is a strong dynamic support (around $94,740–$98,000).
Horizontal support lines are around the $103,000 and $100,000 levels, acting as immediate support.
Price Pattern:
The pattern resembles a bullish flag or descending wedge, suggesting a possible continuation of the previous upward move if a breakout occurs.
Before a bullish reversal, a retest of support levels (highlighted in the blue circle) near the moving averages is possible.
Future Path (as drawn on the chart):
Possible pullback to around $100,000–$98,000 levels.
Reversal and breakout are expected to be between $112,000 and $115,000 initially, and possibly higher to $125,000–$130,000.
Volume & Momentum:
No volume data is shown, but the price action indicates a correction with weakening momentum.
Trend lines are sloping upwards, indicating underlying strength despite the correction.
Trade Setup Based on This Analysis
Entry Zone: Around $100,000–$98,000 (if price tests support and forms reversal patterns like a bullish engulfing or hammer).
Stop-Loss: Below $94,000 (below the 200 SMA and the trendline support).
Short-Term Target: $112,000–$115,000.
Mid-Term Target: $125,000–$130,000.
Risk Considerations
If BTC breaks below the 200 SMA and horizontal support near $94,000, the trend may weaken.
Thanks for your support!
DYOR. NFA

Bitcoin (BTC/USDT) – Daily Chart Analysis. Bitcoin (BTC/USDT) – Daily Chart Analysis
Bitcoin has tested the overhead resistance and is currently retracing towards the $104k–$105k support area.
Moving Average (MA 25):
The price is slightly above the moving average, indicating that the medium-term trend is still bullish but faces resistance.
Pattern Formation:
There is a clear breakout from the inverted “V” pattern, and now the price appears to be retesting the breakout zone.
Scenario:
If BTC maintains support at ~$105k and bounces off again, a potential push towards $112k—$115k can be seen.
If the support fails, a deeper pullback towards $100k or below could occur.
Thanks for your support!
DYOR. NFA

BTC/USDT 1DAY CHART UPDATE !!BTC/USDT Chart Analysis
The price has broken above a key resistance area (~$104,000–$105,000) and is now retesting it as support.
The 50-day (red) and 200-day (green) moving averages slope upward, indicating bullish momentum.
Price activity consolidates just above the key resistance-to-support area, indicating accumulation ahead of a potential breakout.
If the price sustains above $104,000, we could see continuation towards $120,000–$125,000.
A break below $104,000 could see the price retest lower support areas near $100,000 or even $97,000–$98,000.
Conclusion:
Bullish bias above $104,000.
If support fails, a bearish move is possible, but momentum is in the bulls’ favor right now.
Stay tuned for updates and key levels to watch!
Thanks for your support!
DYOR. NFA

Bitcoin (BTCUSDT) - Consolidation Above Support Trendline -DailyBitcoin (BTCUSDT) price is currently consolidating above a trendline support level (between $107,000 and $109,000).
Bitcoin price has been in an uptrend throughout May 2025.
If Bitcoin price closes below $106,000 a pullback could occur down to $104,000 and $100,000.
Support Levels: $107K, $105K, $103K, $100K, $95K, $90K.
Resistance Levels: $110K, $112K, $120K, $130, $136K, $150.
Stock market correlations and corporate earnings could affect short-term price action for Bitcoin (e.g. S&P500, Nasdaq, Dow Jones, Nvidia, Dell, Marvell, etc).
Breaking News, corporate earnings and announcements, presidential and government law changes, and consumer sentiment can all affect the price of Bitcoin.

Is the BTC Bull Tired ? A Healthy Pullback May Be on the Horizon🚨 Market Watch Update 🚨
Hey fam while the macro trend is still bullish overall, I'm noticing signs that this current uptrend might be running out of steam. There’s a good chance we’re nearing a breakdown from the rising channel, which could open the door for a healthy correction down toward that ~$90K area.
Last week’s breakout really shook things up a ton of short positions got liquidated, which helped push the price higher in the short term. Classic squeeze move. 👀
But here’s what I’m watching next
🔻 In the near term, I’m leaning slightly bearish. I wouldn’t be surprised if price pulls back into the $102K–$99K zone sometime this week. That range could offer a decent reset before the next major move.
🧠 Remember, when green candles start popping, retail FOMO tends to kick in hard — folks jump in late, thinking the rally will never end.
That’s exactly where market makers step in, taking profits and reloading at better levels. Don’t be the exit liquidity.
Stay patient. Stay sharp. And as always I’ll keep you posted with a deeper dive soon. 🎯

Bitcoin (BTC) Market Update – May 19, 2025📅 Bitcoin (BTC) Market Update – May 19, 2025
BTC is trading at $105,488 with a slight +0.0115% 24h uptick.
📊 Technical Snapshot:
• Price Range: $102,381 – $106,540 (Moderate volatility)
• Support: GETTEX:97K – $98.5K | Resistance: $110K – $115K
• Trend: Consolidation Phase – Awaiting breakout
🔗 On-Chain Highlights:
• 87% of supply in profit = Potential for sell pressure
• Accumulation increasing across wallet cohorts
• Improved investor sentiment
🧭 Fundamentals to Watch:
• Sharpe Ratio: 1.72 – High risk-adjusted returns
• ETF inflows rising = Institutional demand
• Macro Index flashing Buy signal
📈 BTC Price Outlook:
• Short-Term: $100K – $110K
• Mid-Term: $110K – $129K
• Long-Term: $174K – $462K 🚀
✅ Summary:
Bitcoin remains range-bound but shows strength in accumulation and fundamentals. Keep an eye on $110K resistance for a possible breakout.
#Bitcoin #BTC #CryptoAnalysis #SorooshX

Can BTC touch 110k today?Well if it closes 107.1k then stances change, as of now, 102.5k is what it looks delicious as per chart drawn ~~ Thank you!!

BTC SHORT TP:101,500 16-10-2024🚨 SHORT setup active
Looking to enter between 104,000 and 104,500, targeting 100,800–101,300 based on the 2H–4H charts.
Estimated duration: 20 to 30 hours ⏳
We’re seeing signs of a manipulated pump followed by bearish formation in higher timeframes.
This setup has potential — just remember to manage your stop according to your strategy and stay alert for updates.
If the move doesn’t happen within the expected window, the setup is invalid.
We don’t use indicators, we’re not out here drawing lines or cute little shapes — I just give you a clean trade.
#BTC #PriceAction #Reydragon21

BTCUSDT - 4H - GAP 92K - Chicago Futures - SHSBTCUSDT - 4H - POSSIBLE SHS
TRADEX BOT NEWS:
In addition to the automated execution of individual trading strategies, we are working on enabling the bot to perform COPY TRADING STRATEGIES.
We want Trading View developers to be able to monetize their INDICATORS and STRATEGIES by allowing COPY TRADING STRATEGIES.
If the indicator generates profits, the developer will collect a percentage of the profits generated.
We will soon have the first version of the TradeX BOT, which will function as a second-layer Order Book on CEX markets, hiding our greed (TP) and fear (SL) from exchanges.
More news soon!
Thank you!
_______________________________________________________
BTCUSDT - 4H - POSSIBLE SHS
LEVELS:
Resistance: 105k
DYNAMIC SL: 101k
2nd SHOULDER: 91k - 92k
Why could BTC make a SHS breakout?
It seems BTC is again topping out at 105k (coinciding with the horizontal shoulder line).
We have a SELL signal at these levels.
And third, we have a GAP at 92k in the Chicago FUTURES.
If BTC makes this correction, we would have a bullish SHS pattern that could take BTC to 140k.
To be successful in trading, it is essential to be faithful to our strategy. Be clear about where we are, where we want to go, and when it is best to be liquid. __________________________________________________
Automated cryptocurrency trading bots: All of these strategic alternatives can be configured with TradeX BoT, as it allows you to position in both directions without having to lock any amount per position. All that's required is for the conditions, either up or down, to be met for the orders to be executed in either direction, withdrawing the necessary deposits from the portfolio.
TradeX BoT (in development): Tool for automating trading strategies designed in TradingView. It works with indicators and technical drawing tools: parallel channels, trend lines, supports, resistances, etc. It allows you to easily set SL (%), TP (%), Trailing SL, multiple strategies on different securities, simultaneous buy and sell orders, and conditional orders.
This tool is in development, and the beta version will be available soon for testing.
FOLLOW ME and I'll keep you informed of our progress.
I share with you my technical analysis assessments on certain securities that I follow as part of the strategies I design for my portfolio, but I do not recommend trading with these indicators. Get informed, educate yourself, and create your own investment strategies. I hope my comments help you on your journey :)


BTCUSD ChoCh + FVG Rejection = Drop Incoming🧠 Smart Money Concepts | BTCUSD 1H Breakdown
Here’s a crystal-clear Smart Money setup on Bitcoin that screams bearish intent. The wedge was a trap, the ChoCh confirmed the flip, and now price is reaching back into a Fair Value Gap that’s likely to reject hard.
Let’s dissect the setup:
🧱 1. Structure: Rising Wedge + ChoCh
Bitcoin climbed with a grinding structure inside a rising wedge — classic liquidity trap.
Smart Money lured in longs, then snapped structure (ChoCh) at ~102,700 — that’s your reversal confirmation.
📉 2. Fair Value Gap (FVG) Rejection Zone
After the ChoCh, price retraced into a juicy FVG zone around 103,219 – 103,913 —
right below a Strong High at 105,900. Inducement bait for breakout traders.
That’s premium pricing in a bearish environment = high-probability short.
🎯 3. Liquidity Target: Weak Low + Sell Side Sweep
Price is eyeing the Weak Low at 99,114, and below that sits the real magnet:
Sell Side Liquidity at ~98,800. That’s your ultimate draw.
📐 4. Trade Idea (R:R Approx. 3.5:1)
📍 Entry Zone: 103,200–103,900 (FVG zone)
❌ SL: Above Strong High @ 106,000
✅ TP1: Weak Low at 99,114
🏁 TP2: Sell Side Liquidity @ ~98,800
🧩 Confluences Checklist:
✅ Rising Wedge Trap
✅ ChoCh Confirmed
✅ FVG in Premium Zone
✅ Bearish Order Flow
✅ Weak Low + Sell Side as Target
⚠️ Caution:
Don’t short blindly. Wait for reaction in the FVG zone — ideally a rejection wick or lower timeframe BOS.
If price closes above the Strong High — setup is invalidated.
📊 Summary:
This BTCUSD setup is dripping with manipulation. Smart Money engineered a wedge, flipped structure, and is now likely to distribute before the next leg down.
Stay sharp. Trade with the big players, not against them.
💬 Type “🚨 BTC Short Alert” in the comments if you caught this setup too.
📉 Follow @ChartNinjas88 for more SMC alpha and sniper setups.
👀 Tag a fellow trader who thinks wedges always break upward 😂
