BTC/USD 1DAY UPDATE BY CRYPTO SANDERS !!Hello, welcome to this BTC/USDT update by CRYPTO SANDERS.
CHART ANALYSIS:- Bitcoin (BTC) rebounded from recent losses on Tuesday, ahead of the upcoming U.S. consumer confidence report.
The Conference Board expects its index to rise to a reading of 104.0 in June, up from 102.3 the month prior.
BTC/USD rose to an intraday high of 30,751.19 on Tuesday, following a low at 29,955.74 to start the week.
The move appears to have occurred as the 14-day relative strength index (RSI) bounced from a support point of 68.00.
As of writing, the index now sits at a reading of 70.17, which is once again in overbought territory.
A barrier at 73.00 is now the next visible ceiling, and unless bulls break out of this point, BTC will likely move back below 30,000.
I have tried to bring the best possible outcome to this chart.
Hit the like button if you like it and share your charts in the comments section.
Thank you
Btcshort

BTC/USD 1DAY UPDATE BY CRYPTO SANDERS !!Hello, welcome to this BTC/USDT update by CRYPTO SANDERS.
CHART ANALYSIS:- Bitcoin (BTC) moved marginally lower to start the week, as its price fell below the 31,000 mark on Monday.
BTC/USD dropped to an intraday low of 30,042.38 earlier in the day, which comes after the price peaked above 31,000 on Sunday.
Today’s slippage sees bitcoin decline for a third straight day and comes as the relative strength index (RSI) moved into overbought territory.
hit a peak of 72.92, which was not only near a ceiling of 73.00 but also its highest point since late January.
This reading prompted bears to enter the market again, pushing the RSI down to a current reading of 68.81.
68.00, and if this support point is broken, there is a good chance that BTC slips below 30,000.
I have tried to bring the best possible outcome to this chart.
Hit the like button if you like it and share your charts in the comments section.
Thank you

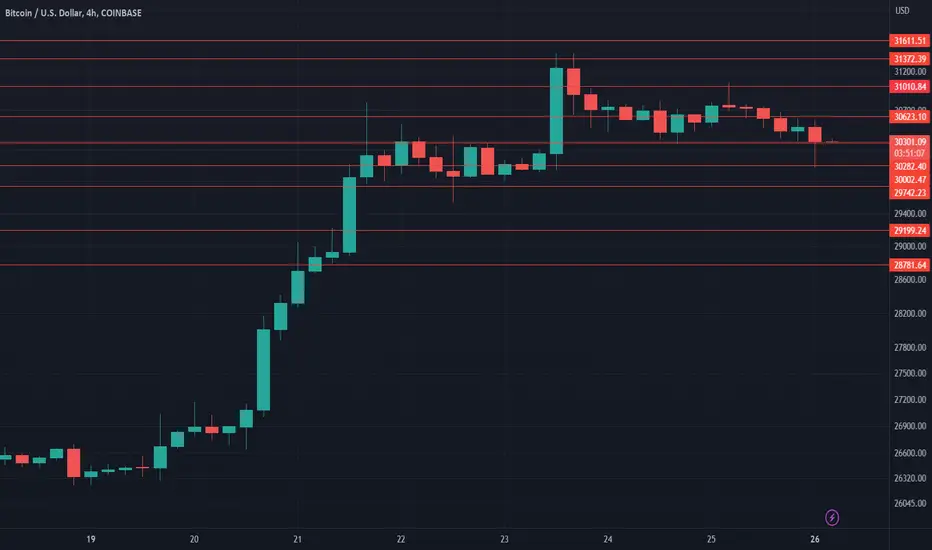
$BTC Daily UpdateCRYPTOCAP:BTC #BTC $30,282 support in effect, reattempted $31,010 yesterday. Last 4H close looks good, 1D closed bearish, $30,002-$30,282 support range testing. $30,623 initial resistance. Needs to take $31,611 support to ensure no fakeouts.
#BITCOIN Swing ShortShort The Resistence Until it's not, keep it simple long from the demand short from the supply.

$BTC Daily updateCRYPTOCAP:BTC #BTC struggle at $30,282 resistance, $29,742 support holding, given key support and resistance remains effective.

BTC/USD 1DAY UPDATE BY CRYPTO SANDERS !!Hello, welcome to this BTC/USDT update by CRYPTO SANDERS.
CHART ANALYSIS:- Bitcoin moved above the 30,000 level in today’s session, ahead of a testimony by the chair of the Federal Reserve, Jerome Powell.
Powell will be speaking today for the first time since the Fed’s decision to keep interest rates unchanged in June.
BTC/USD hit a peak at 30,737.33 earlier in the day.
This is the strongest point that Bitcoin has hit since April 14, when the price reached a top at 31,050.
Another major catalyst for the move was a crossover of moving averages (MA), with the 10-day (red) MA, moving above its 25-day (blue) counterpart. the relative strength index (RSI) has also marginally broken out of a ceiling at 70.00 and is now tracking at 70.88.
I have tried to bring the best possible outcome to this chart.
Hit the like button if you like it and share your charts in the comments section.
Thank you

BTC update...CRYPTOCAP:BTC moves like a b*tch... The structure broke, So I will flip my bias...
Will long if it breaks the structure on the upside...
Be alert

btc setupBitcoin has support levels of $ 28,661, $ 27,262, and the strongest at $ 26,264. Similarly, Bitcoin resistance levels are at $ 31,058, $ 32,057, and $ 33,455..

🌴🌡️ Tropical Heatwave: Is a Market Correction Looming? 🌧️Tropical conditions 🌴 lie ahead for the global crypto market over a one-day horizon, signaling a very bullish trend with an imminent market correction ahead. The crypto rally witnessed this week has been triggered by a series of announcements from major financial players, including the launch of a new crypto exchange for institutionals and the filing of several spot Bitcoin ETF applications to the US regulator. 💥
These recent developments show that financial institutions believe in the crypto assets, despite the US regulator's continuous crackdown on the US crypto market. Over a one-week horizon, sunny trading conditions prevail ☀️, indicating a slightly bullish market with upside potential for the cryptosphere. 📈💰
Stay ahead of the game and follow us to explore deeper insights in ATTMO Times! 📰✨

Bitcoin 29K Trap Or Bull Market Is BackBitcoin pumping to 29K.Can it hold this or it will collapse today ?
Thanks for watchnig

BTCShowing a clear break of major support and resistance. Take out the highs of $31,000 and we likely going straight rocket to $40K

BTC/USD 1DAY UPDATE BY CRYPTO SANDERS !!Hello, welcome to this BTC/USDT update by CRYPTO SANDERS.
CHART ANALYSIS:- Bitcoin rose to a two-week high on Tuesday, as bullish sentiment made a gradual return to the marketplace.
Following a low of 26,338.54 to start the week, BTC/USD rose to an intraday high of 27,147.47 on Tuesday.
bitcoin rose to its strongest point since June 7, when it peaked at 27,402.
it appears that today’s rally coincided with the relative strength index (RSI) also breaking out of a ceiling of its own at the 50.00 mark.
Price strength now stands at 51.71 with the next visible resistance level at 57.00.
In the event bulls are able to send the index to this point, there is a good chance that BTC will be above 28,500.
I have tried to bring the best possible outcome to this chart.
Hit the like button if you like it and share your charts in the comments section.
Thank you

Short Term Bitcoin ShortI expect the upper trendline to act as resistance.
Bitcoin is oversold on 4H timeframe.
IMO, we will see a retrace to the lower support trendline and push up from there.
If this trade is successful, I will leave some on the table, just in case my doomsday scenario will materialize.

BTC 20/6/23' 01:00 UTC-4Hello everyone,
I think we are in Great place to Short BTC after recent move.
There is potentional that BTC still can move few hundreds $ upside,
but with sound risk managment, money should be made.
Price range between 1.15-2.3% upwards (in that Green rectangle)
would be my Optimal Open range for this Trade.
To found out when would be the best time open Trade,
I would suggest to follow lower time frames OR position
yourself correctly right now in case you dont have time for following chart.
Joe

btc short long Based on today's classical pivot point (P1) with the value of $ 26,443, Bitcoin has support levels of $ 26,236, $ 26,132, and the strongest at $ 25,924. Similarly, Bitcoin resistance levels are at $ 26,547, $ 26,754, and $ 26,858.


ETH/USD 1DAY UPDATE BY CRYPTO SANDERS !!Hello, welcome to this ETH/USDT update by CRYPTO SANDERS.
CHART ANALYSIS:- Ethereum (ETH) also rebounded strongly to start the weekend, days after falling to a three-month low
Following a low of 1,653.17 on Friday, ETH/USD raced to an intraday peak at the 1,766.76 level earlier today.
ETH fell to a bottom at 1,620 on Thursday, which was the weakest point that the price had hit since March 13.
a breakout of the RSI was one of the triggers of the move, with price strength climbing past a ceiling of 41.00.
The index is currently at a reading of 43.79, with the next resistance level at the 50.00 mark.
I have tried to bring the best possible outcome to this chart.
Hit the like button if you like it and share your charts in the comments section.
Thank you

BTC/USD 1DAY UPDATE BY CRYPTO SANDERS !!Hello, welcome to this BTC/USDT update by CRYPTO SANDERS.
CHART ANALYSIS:- Bitcoin (BTC) surged on Saturday, as bulls of the cryptocurrency moved to buy the recent dip in price.
BTC/USD rose to a high of 26,769.39 to start the weekend, which comes less than a day after trading at a low of 25,245.36.
The move pushed the price to its highest point since May 8, a day when the price was at a peak of 26,820.
Looking at the chart, the rally came when the 14-day relative strength index (RSI) finally broke out of a key ceiling at 43.00.
the index is tracking at 50.55, which is close to a new resistance at the 51.00 level.
Traders are likely targeting the 27,300 level and could hit this if the momentum continues to be bullish this weekend.
I have tried to bring the best possible outcome to this chart.
Hit the like button if you like it and share your charts in the comments section.
Thank you

Bitcoin Could Go Lower To 23.8 OR 26K RetestBitcoin hit our target (24.8) and bounce back most of it.Now its in the mid range.Ive analysed ETHUSDT and BTCETH too. Not Looking Good Bruh!

BTCUSDT AnalystHello everyone, I want share my idea about BTCUSDT.
In my last post I was looking to Bitcoin bullish but today I changed my mind.
With my strategy Bitcoin now looking bearish, it broke 1W support after 2 big and good rejection, I am waiting for retest that broke LVL which is on 25300, then in my opinions we will see down trend but I really don't know where is bottom.
I am still looking careful to Bitcoin because we are at interesting LVL. after big move and big bull trend its coming slowly down.
On USDT.D we have big bullish trend and because of this we can assume Bitcoin bearish trend. (I WILL LINK MY FIRST PRICE PREDICTION ON USDT.D)
BE PATIENT!!!

BTC/USD 1DAY UPDATE BY CRYPTO SANDERS !!Hello, welcome to this BTC/USDT update by CRYPTO SANDERS.
CHART ANALYSIS:- Ahead of the upcoming inflation report in the United States, bitcoin (BTC) moved back above the 26,000 level.
Following a low of 25,686.04 to start the week, BTC/USD raced to a peak of 26,261.14 earlier today.
The move saw Bitcoin near a recent resistance level at 26,300,
one of the last hurdles stopping bulls from moving toward 27,000
In order to get towards this level, a ceiling on the relative strength index (RSI) will also need to be broken.
47.00 level on the indicator, and as of writing, price strength is currently tracking at 44.02.
The 10-day (red) moving average will need also to shift course, and divert away from its current downward path.
I have tried to bring the best possible outcome to this chart.
Hit the like button if you like it and share your charts in the comments section.
Thank you

Bitcoin to breakdown?Bitcoin - 24h expiry - We look to Sell a break of 25298 (stop at 25798)
There is no clear indication that the downward move is coming to an end.
Our short term bias remains negative.
The sequence for trading is lower lows and highs.
A break of the recent low at 25354 should result in a further move lower.
25354 has been pivotal.
Our profit targets will be 24048 and 23848
Resistance: 26200 / 26500 / 26800
Support: 25800 / 25350 / 25000
Please be advised that the information presented on TradingView is provided to Vantage (‘Vantage Global Limited’, ‘we’) by a third-party provider (‘Signal Centre’). Please be reminded that you are solely responsible for the trading decisions on your account. There is a very high degree of risk involved in trading. Any information and/or content is intended entirely for research, educational and informational purposes only and does not constitute investment or consultation advice or investment strategy. The information is not tailored to the investment needs of any specific person and therefore does not involve a consideration of any of the investment objectives, financial situation or needs of any viewer that may receive it. Kindly also note that past performance is not a reliable indicator of future results. Actual results may differ materially from those anticipated in forward-looking or past performance statements. We assume no liability as to the accuracy or completeness of any of the information and/or content provided herein and the Company cannot be held responsible for any omission, mistake nor for any loss or damage including without limitation to any loss of profit which may arise from reliance on any information supplied by Signal Centre.
