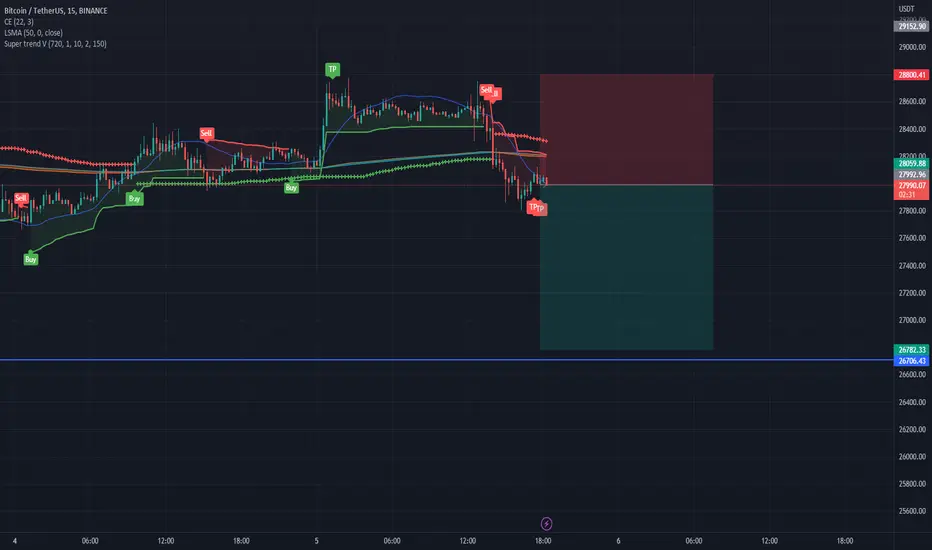
BTC retest of lower demand zonehello traders, lets hope BTC leaves the crab market soon, with my new strategy in play i think BTC needs to retest 26800 demand zone, this is for educational pourposes only, good luck traders no financial advice
Btcshort
Bitcoin vs Bonds.Bitcoin 1D is almost oversold. A first target would be $42,000. Resistance is $45,000 and $47,000. There just doesn't seem to be enough steam for a breakout. Bitcoin's popularity is already maxed out and the investor is struggling according to the economic data. Being that Bitcoin moves with the equity market, we could see bitcoin take a tumble.
Morgan Stanley stated the "Bear market is over". JPMorgan analyst is telling equities investors to take profits. It seems like more economists and analysts are seeing markets taking a tumble. FOMC has been much more hawkish, pushing the 10YR higher. The 1M for Bitcoin is bearish, but short term is looking somewhat better as there have been higher lows and higher highs since January.

BTCUSDT 1D 📊 #BTCUSD
⏱ TIME: 1D
📝 Bitcoin is currently approaching a strong resistance zone ranging from 31700 to 23400 (blue box). It is expected that the price may start a correction from this zone and move towards the following targets.
📌 First target: $29400
📌 Second target: $25400
📌 Third target: $21200
📌 Fourth target: $18400

BTC losing gainHello,
This is how it should be going.
Take some profits if you are in long.
Trade safely.

Bitcoin in a fake rally?Bitcoin - 24h expiry - We look to Sell at 29130 (stop at 29650)
Levels above 28700 continue to attract sellers.
Although the bulls are in control, the stalling positive momentum indicates a turnaround is possible.
We are trading at overbought extremes.
Preferred trade is to sell into rallies.
We look for a temporary move higher.
Our profit targets will be 27700 and 27200
Resistance: 28400 / 28700 / 29100
Support: 28200 / 27800 / 27500
Please be advised that the information presented on TradingView is provided to Vantage (‘Vantage Global Limited’, ‘we’) by a third-party provider (‘Signal Centre’). Please be reminded that you are solely responsible for the trading decisions on your account. There is a very high degree of risk involved in trading. Any information and/or content is intended entirely for research, educational and informational purposes only and does not constitute investment or consultation advice or investment strategy. The information is not tailored to the investment needs of any specific person and therefore does not involve a consideration of any of the investment objectives, financial situation or needs of any viewer that may receive it. Kindly also note that past performance is not a reliable indicator of future results. Actual results may differ materially from those anticipated in forward-looking or past performance statements. We assume no liability as to the accuracy or completeness of any of the information and/or content provided herein and the Company cannot be held responsible for any omission, mistake nor for any loss or damage including without limitation to any loss of profit which may arise from reliance on any information supplied by Signal Centre.

BTC Short25.2k has heavy support. 5x down would be a nice trade, nfa ofc.
TP1-26.6k
TP2-25.255k
If broken TP£_
23.2k
GL.


BTC/USDT🔵🐇 #BTC/USDT
🪄 BTC Scalp Position Based On Fresh Liquidity and Order Blocks and Structures
#eth #btc #bitcoin #ethereum #cryptocurrency #crypto #Trade #trading #Trader #Signal #forex #Scalp #altcoins #chart #RTM #ICT
@aliceinmoneyland

BTC Pattern showing Strong Bearish Sentiment More Than Ever!!Two new BTC bearish pattern (one mentioned at the start that will blow your mind)
Bitcoin Exited the Orange parallel channel and is consolidating below the support of the blue parallel channel
Stoch RSI on weekly is at its peak and needs to come down which will follow by heavy sells & Head and shoulder still in play
Dxy doing a descending wedge which is bullish.Ive talked about it in video cause its very important
SPX is in a big bear flag - could rally up and form bearish divergence
Strongly recommended to watch it untill the end.lots of important information and signals
Please Consider Supporting Me By Boost,Follow,Comment

BTC/USD 1DAY UPDATE BY CRYPTO SANDERSHello, welcome to this BITCOIN /USD update by CRYPTO SANDERS.
CHART ANALYSIS:-Bitcoin ( BTC ) There was a move back above the 28000 level on Saturday as the market continued to react to the latest NFP report.
Payrolls came in at 236,000, marginally lower than the 240,000 many were expecting.
After trading at a low of 27814.00 BTC/USD rose to a high of 28159.86 in today's session.
An increase in price comes when the Relative Strength Index (RSI) bounces off its low at 58.00.
The index is tracking at 59.07, which has helped delay the inevitable downward cross with the 10-day (red) moving average and its 25-day (blue) counterpart.
BTC is trading at 28,059.28.
I have tried to bring the best possible outcome to this chart.
Hit the like button if you like it and share your charts in the comments section.
Thank you.

BTC/USDa simple take on BTC/USD. It has the potential to go either way but we are expecting a temporary decline to the "break&retest" area. From there it could possibly continue pushing for another higher high or give us a double or triple top to continue its loss of value. Will Bitcoin recover?

BTC Breaking OUT..?Price is already trapped inside ascending triangle
and consolidation but converging for almost a month
now. We can expect Breakout on upcoming NFP or before
new week starts.
Once breakout of this zone we'll enter
SHORTS or LONGS accordingly.

$btc short | $25.2 tpstill looking for $25.2 or potentially lower. not the best RR box to rid to $25.2, but it's great RR if it dumps much further.
think we'll see a heavy reaction at $25.2, but could see this running all the way to $19.

BTC/USD 1DAY UPDATE BY CRYPTO SANDERS !!Hello, welcome to this BITCOIN /USD update by CRYPTO SANDERS.
CHART ANALYSIS:-Bitcoin ( BTC ) was once again trading under $28,000 on Thursday, as markets began to prepare for tomorrow’s non-farm payrolls report.
BTC/USD dropped to an intraday low of $27,831.56 in today’s session, which comes less than 24 hours after trading at a high of $28,714.22.
The move came as bitcoin bulls were unable to sustain a breakout of a key resistance level of $28,500.
Looking at the chart, this latest drop in price came as the 14-day relative strength index (RSI) dropped below a floor of 58.00.
As of writing this, the index is now tracking at 57.80, with the 10-day (red) moving average nearing a downward cross with its 25-day (blue) counterpart.
Should sentiment remain bearish, there is a strong possibility that BTC will fall to a floor at $27,000.
I have tried to bring the best possible outcome to this chart.
Hit the like button if you like it and share your charts in the comments section.
Thank you.

BTC/USD 1DAY UPDATE BY CRYPTO SANDERS !!Hello, welcome to this BITCOIN /USD update by CRYPTO SANDERS.
CHART ANALYSIS:-Bitcoin ( BTC ) broke out of a key resistance level on Wednesday, with traders now targeting a move beyond the $29,000 mark.
Following a low of $27,979.75 on Tuesday, BTC/USD moved to an intraday high of $28,739.24 earlier in today’s session.
The move saw Bitcoin climb above a recent ceiling of $28,500, hitting a four-day high in the process.
Overall, it appears that the move occurred once the relative strength index (RSI) bounced from a recent floor at 58.
As of writing, the index is tracking at 62.48, with the next visible ceiling of 65.00 as a possible target for bulls.
There is a strong possibility that BTC will be above $29,000 if and when this resistance point is hit.
I have tried to bring the best possible outcome to this chart.
Hit the like button if you like it and share your charts in the comments section.
Thank you.

BTC updateAs you can see, price run buy side liquidity, with 12h close below. This is means a lot of breakouts traders trapped. For me is obvious short scenario with equal lows target. Also lower we have unfilled imbalanced, this is a good confluence to see price lower.
Not a financial recommendation.
Thank you for like this idea, have a good profit!

BTC/USD 1DAY UPDATE BY CRYPTO SANDERS !!Hello, welcome to this BITCOIN /USD update by CRYPTO SANDERS.
CHART ANALYSIS:-Bitcoin ( BTC ) continued to trade close to a key resistance level on Tuesday, as volatility in the market remained high.
BTC/USD rose to a peak of $28,433.74 earlier in today’s session, which follows up from a low of $27,276.72 on Monday.
As a result of today’s surge, bitcoin moved near its recent price ceiling of $28,500, however, bulls were not able to reach this point.
Looking at the chart, this seems to be because the relative strength index (RSI) continued to hover near a floor of 60.
As of writing, the index is tracking at 61.00, with the next visible ceiling of 65.00 as a possible target for buyers.
Should this level be reached, there is a strong possibility that BTC will be trading above $28,500.
I have tried to bring the best possible outcome to this chart.
Hit the like button if you like it and share your charts in the comments section.
Thank you.

BTC/USD 1DAY UPDATE BY CRYPTO SANDERS !!Hello, welcome to this BITCOIN /USD update by CRYPTO SANDERS.
CHART ANALYSIS:-Bitcoin ( BTC ) started the week consolidating around the $28,000 level, as volatility in crypto markets remained high.
Following a low of $27,607.67 earlier in today’s session, BTC/USD rose to a peak at $28,475.62 as the day progressed.
The move saw bitcoin move closer to a recent resistance level of $28,500, which was broken over the weekend.
The recent price consolidation comes as the 14-day relative strength index (RSI) failed to move beyond a ceiling of 65.00.
As of writing, the index is tracking at 62.00, which is also a key point of support for traders.
Overall, the world’s largest cryptocurrency is now trading 1.46% higher than at the same time last week.
I have tried to bring the best possible outcome to this chart.
Hit the like button if you like it and share your charts in the comments section.
Thank you.

BTC 5Minute Short Analysis I have an active short trade, and I'm tracking it so far... I feel it will go down till the area of support marked but anything can happen... it's crypto, if anything I'll move SL to break even if it goes down a bit more.

There are 2 shorting positions on BTC(FYI MY POSITIONS ARE AT $23.9K)
If I miss it I miss it, oh well
Positions
Potential positions; $18.2k & $23.9k
18.2k broke a few weekly candles, this isn't good at all but with a good position everything will be fine right?
well we will see
If we get into a position at 23.9k and the weekly stays under 18.2k I can promise we can make profit but if it closes above 18.2k then that's when I get confused with a miner bullish thesis. Once bulls close weekly/weekly's above $24k then ill have a major bullish thesis but I highly doubt till happen.
We need weekly's to close under $18.2k and when the last weekly closes under 16.1k then that's when we see a +20% fall
[i ]Take Profit
T1: $9,699
T2: $6,999
T3: (aka sell your soul): $1,000 - $2,500
glhf, be safe leverage is no joke

BTC Short Term SellsBINANCE:BTCUSD
Looking for a pullback to enter a short-term sell to the 25k possibly 22k level

BTC weekly chartBTC weekly chart facing biggest resistance! if BTC rejects things will not be good in the coming weeks! it's just an observation! 12k still possible

