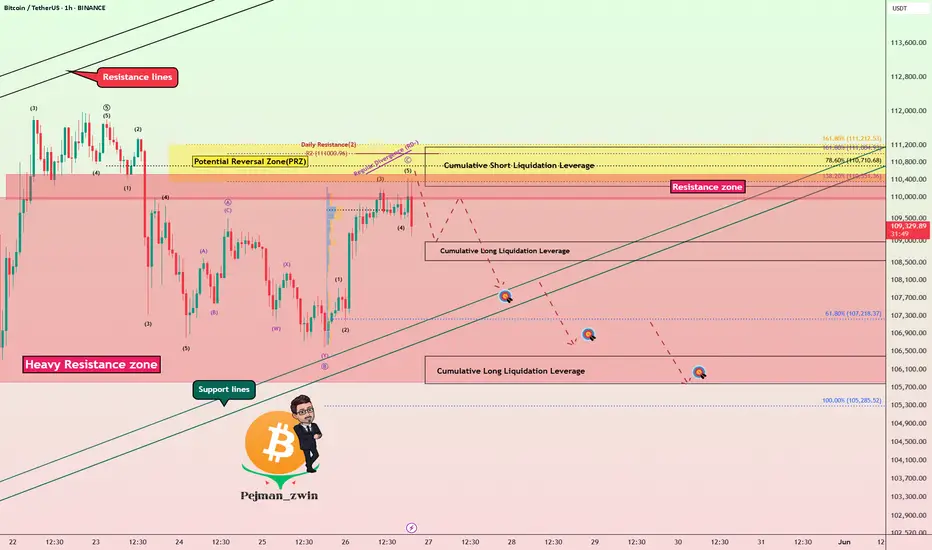
Bitcoin’s Rally Fades Below Resistances — Bearish Wave Setup!Bitcoin ( BINANCE:BTCUSDT ) started to fall as I expected in the previous idea , but failed to break the Heavy Resistance zone($110,000-$105,820) .
Bitcoin is trading near the Resistance zone($107,520-$105,940) , Cumulative Short Liquidation Leverage($106,720-$105,948) , and the Resistance lines .
From the perspective of Elliott Wave theory , Bitcoin appears to have completed a main wave 4 near the Resistance lines. The structure of the main wave 4 was a Double Three Correction(WXY) . One of the signs of the completion of the main wave 4 could be the Evening Star Candlestick Pattern .
I expect Bitcoin to decline to at least Cumulative Long Liquidation Leverage($103,666-$102,800) AFTER breaking the Support line , and the next target is the Support zone($102,000-$107,120) .
Note: Rising tensions between Russia and Ukraine could help drive down Bitcoin.
Note: If Bitcoin touches $107,600, we can expect more pumps.
Please respect each other's ideas and express them politely if you agree or disagree.
Bitcoin Analyze (BTCUSDT), 1-hour time frame.
Be sure to follow the updated ideas.
Do not forget to put a Stop loss for your positions (For every position you want to open).
Please follow your strategy and updates; this is just my Idea, and I will gladly see your ideas in this post.
Please do not forget the ✅' like '✅ button 🙏😊 & Share it with your friends; thanks, and Trade safe.
Btcsignal

Bitcoin Bounce on Trump Tariff Delay – Short Setup Still Valid!Bitcoin ( BINANCE:BTCUSDT ) started to fall as I expected in the previous idea , and declined near the Support lines .
Bitcoin started pumping after the news that " US President Trump agreed to postpone 50% EU tariffs until July 9th ." Do you think this pumping of Bitcoin will continue?
Bitcoin is trading in a Heavy Resistance zone($110,000-$105,800) near the Potential Reversal Zone(PRZ) .
From the Elliott Wave theory perspective , Bitcoin appears to be in corrective waves , which is why I am labeling this idea as a ''Short''. The corrective waves structure is of the Expanding Flat(ABC/3-3-5) type.
I expect Bitcoin to attack the Support lines once again, and if these lines are broken, it will decline to the Targets I have indicated on the chart.
Notes :
MicroStrategy bought another 4,020 Bitcoins, but it didn't have much of an impact on the market.
If the Bitcoin price falls back below $109,000, about $185 million in long Bitcoin positions will be liquidated . = Attractive for exchanges
Bitcoin 2025 Conference to be Held in Las Vegas, Tuesday-Thursday = Could Cause Market Excitement .
Note: If Bitcoin touches $112,080, we should expect more pumping.
Please respect each other's ideas and express them politely if you agree or disagree.
Bitcoin Analyze (BTCUSDT), 1-hour time frame.
Be sure to follow the updated ideas.
Do not forget to put a Stop loss for your positions (For every position you want to open).
Please follow your strategy and updates; this is just my Idea, and I will gladly see your ideas in this post.
Please do not forget the ✅' like '✅ button 🙏😊 & Share it with your friends; thanks, and Trade safe.
Bitcoin Be Setting Bull Trap?_Breakout Without High VolumeBitcoin ( BINANCE:BTCUSDT ) started to fall yesterday after forming a new All-Time High(ATH) with high volume , but started to rise again. One of the reasons for Bitcoin’s sudden drop yesterday was the sharp drop in the S&P 500 ( SP:SPX ) index .
First of all, I must say that Bitcoin’s situation is a bit complicated and difficult to analyze , so pay more attention to money management. Be prepared for any scenario.
Bitcoin is trading above the Resistance zone($109,588-$105,820) and near the Resistance lines and Cumulative Short Liquidation Leverage($113,020-$111,833) . What is worrying is that the break of the Resistance zone($109,588-$105,820) was NOT accompanied by high volume , suggesting a bull trap is possible .
I see a correction to at least Cumulative Long Liquidation Leverage($109,972-$108,609) given the low breakout volume for Bitcoin and the large sell orders in the upper prices for Bitcoin .
--------------------------------------------
Today, the Flash PMI data from the U.S . came in stronger than expected:
Flash Manufacturing PMI: 52.3 (vs. forecast 49.9, previous 50.2)
Flash Services PMI: 52.3 (vs. forecast 51.0, previous 50.8)
Analysis :
Both numbers exceeded expectations, signaling stronger economic activity in the U.S. This is bullish for the USD( TVC:DXY ) and could put short-term downward pressure on Bitcoin, as it lowers the chances of near-term Fed rate cuts.
--------------------------------------------
Do you think Bitcoin is completing a Bull Trap or should we expect Bitcoin to increase further?
Note: If Bitcoin breaks above $114,500 with high momentum, we can expect Bitcoin to rise to near $119,000.
Please respect each other's ideas and express them politely if you agree or disagree.
Bitcoin Analyze (BTCUSDT), 1-hour time frame.
Be sure to follow the updated ideas.
Do not forget to put a Stop loss for your positions (For every position you want to open).
Please follow your strategy and updates; this is just my Idea, and I will gladly see your ideas in this post.
Please do not forget the ✅' like '✅ button 🙏😊 & Share it with your friends; thanks, and Trade safe.

Bitcoin’s Pump to NEW ATH($109,845) Ends in High-Volume ReversalBitcoin ( BINANCE:BTCUSDT ) moved towards the targets as I expected in my previous idea , although it faced pump and dump moves in reaching the targets .
Bitcoin managed to create a new New All-Time High(ATH=$109,845) but immediately began to decline on high volume .
Bitcoin is trading in the Resistance zone($109,588-$105,860) and near the Resistance lines , Monthly Resistance(2) .
In terms of Elliott Wave theory , Bitcoin was able to complete main wave 5 .
I expect Bitcoin to fall to at least $102,200 AFTER breaking the Support zone($105,100-$104,140) , and the possibility of further declines is very high .
Also, on the 1-hour timeframe of the USDT.D% ( CRYPTOCAP:USDT.D ) chart, a bullish and regressive Falling Wedge pattern is visible , with its upper line broken.
Do you think Bitcoin can finally create a NEW All-Time High(ATH) Again!?
Note: If Bitcoin touches $110,100, we should expect a pump.
Please respect each other's ideas and express them politely if you agree or disagree.
Bitcoin Analyze (BTCUSDT), 1-hour time frame.
Be sure to follow the updated ideas.
Do not forget to put a Stop loss for your positions (For every position you want to open).
Please follow your strategy and updates; this is just my Idea, and I will gladly see your ideas in this post.
Please do not forget the ✅' like '✅ button 🙏😊 & Share it with your friends; thanks, and Trade safe.

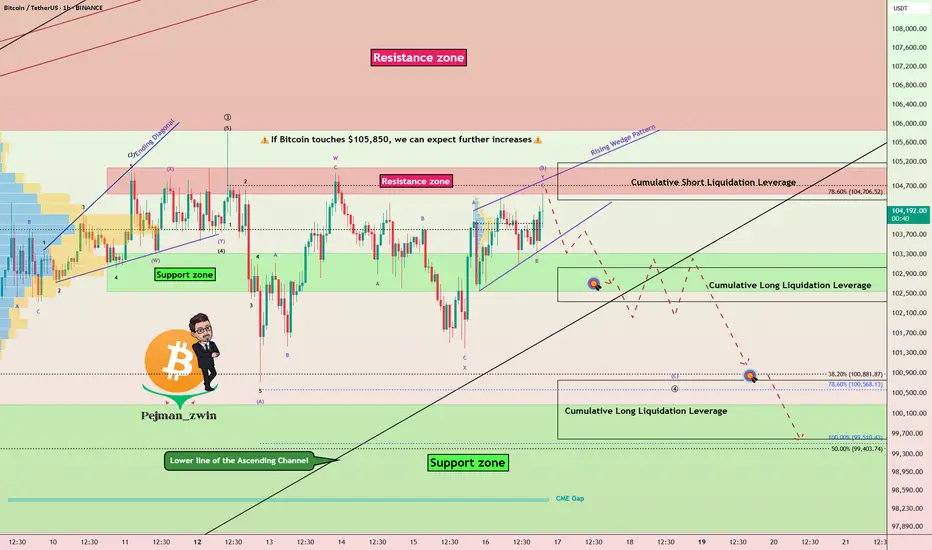
Bitcoin at Resistance With Weak Momentum-Bearish SetupBitcoin ( BINANCE:BTCUSDT ) finally reached the Resistance zone($105,100-$104,520) as I expected yesterday. Of course, the way Bitcoin reached the resistance zone was NOT with high momentum , so I decided to share this analysis with you.
In terms of Classic Technical Analysis , Bitcoin appears to have formed a Rising Wedge Reversal Pattern between Support zone($103,320-$102,600) and Resistance zone($105,100-$104,520) over the past few hours .
In terms of Elliott Wave theory , given Bitcoin’s low momentum and the Heavy Cumulative Short Liquidation Leverage($105,180-$104,412) ahead of Bitcoin, it appears that Bitcoin has completed microwave B of the main wave 4 with a Double Three Correction(WXY) .
I expect Bitcoin to decline to at least $102,800 at the first target AFTER breaking the lower line of the Rising Wedge Pattern, and if the Support zone($103,320-$102,600) and lower line of the ascending channel(Major) are broken, we should expect a drop to Cumulative Short Liquidation Leverage($100,763-$99,600) .
Note: If Bitcoin touches $105,850, we can expect further increases.
Please respect each other's ideas and express them politely if you agree or disagree.
Bitcoin Analyze (BTCUSDT), 1-hour time frame.
Be sure to follow the updated ideas.
Do not forget to put a Stop loss for your positions (For every position you want to open).
Please follow your strategy and updates; this is just my Idea, and I will gladly see your ideas in this post.
Please do not forget the ✅' like '✅ button 🙏😊 & Share it with your friends; thanks, and Trade safe.
Bitcoin Breakout Loading: Resistance Zone Under Pressure!!!Bitcoin ( BINANCE:BTCUSDT ) made the correction I expected , as I predicted in my previous idea .
Bitcoin is trading in the Resistance zone($103,320-$102,600) and near the Resistance lines . Given the momentum of the previous hour's candle and the fact that the previous three candles together formed a Morning Star Candlestick Reversal pattern , it is expected that the Resistance lines will be broken soon.
In terms of Elliott Wave theory , it looks like Bitcoin has completed the main wave 4 as I expected with a Zigzag Correction(ABC/5-3-5) . A break of the Resistance lines by Bitcoin could confirm the end of the main wave 4 .
Also, given Bitcoin's higher correlation with the S&P500 Index ( SP:SPX ) and the fact that I expect the S&P500 Index to increase , the increase in the S&P500 Index could help Bitcoin increase further .
I expect Bitcoin to break the Resistance zone($103,320-$102,600) and Resistance lines soon and attack towards the Resistance zone($105,100-$104,520) .
Cumulative Long Liquidation Leverage: $101,360-$100,600
Note: If Bitcoin falls below $101,280, we should expect further declines.
Please respect each other's ideas and express them politely if you agree or disagree.
Bitcoin Analyze (BTCUSDT), 1-hour time frame.
Be sure to follow the updated ideas.
Do not forget to put a Stop loss for your positions (For every position you want to open).
Please follow your strategy and updates; this is just my Idea, and I will gladly see your ideas in this post.
Please do not forget the ✅' like '✅ button 🙏😊 & Share it with your friends; thanks, and Trade safe.

Bitcoin at PRZ! Is This the Calm Before a Drop?As I expected in yesterday's idea , Bitcoin ( BINANCE:BTCUSDT ) started to rise from near the Support line and hit the Target .
Bitcoin is trading near the Potential Reversal Zone(PRZ) , the upper line of the ascending channel(minor) , and the Resistance line .
In terms of Elliott Wave theory , it seems that Bitcoin has successfully completed the microwave B of the main wave 4 in the ascending channel(minor). A break of the lower line of the ascending channel(minor) could be a sign of the completion of this wave. The corrective structure of the main wave 4 so far could be a Zigzag(ABC/5-3-5) .
I expect Bitcoin to drop to at least $100,923 AFTER breaking the lower line of the ascending channel(minor) and breaking the Support line, the next target could be the lower line of the ascending channel(major) .
Cumulative Short Liquidation Leverage: $106,943-$105,913
Cumulative Short Liquidation Leverage: $105,525-$104,500
Cumulative Long Liquidation Leverage: $100,763-$99,774
Note: If Bitcoin goes above $105,300, we can expect more pumps.
Note: If Bitcoin touches $99,400, we should expect further declines.
Please respect each other's ideas and express them politely if you agree or disagree.
Bitcoin Analyze (BTCUSDT), 1-hour time frame.
Be sure to follow the updated ideas.
Do not forget to put a Stop loss for your positions (For every position you want to open).
Please follow your strategy and updates; this is just my Idea, and I will gladly see your ideas in this post.
Please do not forget the ✅' like'✅ button 🙏😊 & Share it with your friends; thanks, and Trade safe.

Bitcoin’s Path to ATH: Final Wave or Just a Pause? Bitcoin ( BINANCE:BTCUSDT ) pumped about +2% after the " The United States has dropped its tariffs on Chinese goods to 30%, down from a brutal 145%, while China is slashing its own duties on US imports to just 10%, temporarily, for the next 90 days. " news, but then started to decline again. Do you think Bitcoin can see the new All-Time High(ATH)?
Bitcoin is moving near the Support zone($102,200-$101,680) and Support line .
In terms of Elliott wave theory , Bitcoin appears to have completed microwave 3 of the main wave 5 and is currently completing microwave 4 of the main wave 5 .
Given the momentum of the decline a few hours ago , I expect Bitcoin to either touch the previous low or create a new low in the 1-hour timeframe .
I expect Bitcoin to attack the Support zone($102,200-$101,680) once again and possibly touch the Support line and then attack towards the Resistance zone($109,588-$105,865) with the two scenarios I outlined on the chart .
Cumulative Short Liquidation Leverage: $106,943-$105,913
Cumulative Short Liquidation Leverage: $105,313-$104,787
Cumulative Long Liquidation Leverage: $102,198-$101,697
Note: If Bitcoin can move above $104,500 without correction, we can expect more pumping.
Note: If Bitcoin falls below $101,500, we can expect more declines.
Please respect each other's ideas and express them politely if you agree or disagree.
Bitcoin Analyze (BTCUSDT), 1-hour time frame.
Be sure to follow the updated ideas.
Do not forget to put a Stop loss for your positions (For every position you want to open).
Please follow your strategy and updates; this is just my Idea, and I will gladly see your ideas in this post.
Please do not forget the ✅' like '✅ button 🙏😊 & Share it with your friends; thanks, and Trade safe.

Bitcoin Breaks Wedge! Correction Coming Before Next Leg? After Trump said in the press conference, " Better go out and buy stocks now ." The SPX500 index started pumping , and as I said in the ideas of the last few days, Bitcoin ( BINANCE:BTCUSDT )'s correlation with this index has increased. Bitcoin also started pumping.
Yesterday's Bitcoin pump succeeded in failing the Ascending Broadening Wedge Pattern , generally, if the reversal pattern fails, it will play a continuation role .
Bitcoin is moving between the Support zone($100,270-$97,700) and the Resistance zone($109,588-$105,865) . The question is whether Bitcoin will touch the Support zone($100,270-$97,700) again and move towards the Resistance zone($109,588-$105,865) or will it continue its upward trend.
In terms of Elliott Wave theory , it seems that Bitcoin has completed microwave 3 of the main wave 5 . We can expect an even Time Correction on Saturday and Sunday when trading volume is low . There is also a possibility that microwave 4 of the main wave 5 in Cumulative Long Liquidation Leverage($101,838-$101,432) will be completed.
One of the reasons I think we should wait for a correction is the USDT.D% ( CRYPTOCAP:USDT.D ) chart, which we used as a guide in previous ideas .
USDT.D% has reached Monthly Support(1) and a Heavy Support zone(4.73%-4.50%) , which I believe is unlikely to be broken within in first attack , and I expect an increase to the Fibonacci lines on the chart.
I expect Bitcoin to start rising again after a correction .
Cumulative Short Liquidation Leverage: $105,114-$104,100
Note: If Bitcoin touches $97,500, we should expect further declines.
Please respect each other's ideas and express them politely if you agree or disagree.
Bitcoin Analyze (BTCUSDT), 2-hour time frame.
Be sure to follow the updated ideas.
Do not forget to put a Stop loss for your positions (For every position you want to open).
Please follow your strategy and updates; this is just my Idea, and I will gladly see your ideas in this post.
Please do not forget the ✅' like'✅ button 🙏😊 & Share it with your friends; thanks, and Trade safe.

Bitcoin Btc usdt Daily analysis
Time frame daily
As you can see byc is moving up and down in the green tunnel
My last target (yellow rectangle) is touched and byc couldn't break the upper side of tunnel
Now, my target is 120.000 $ ( red rectangle)
If this time , btc can break the green uptrend line as resistance line , my next target is 145.000$,
👉👉Important notice 👈👈
Here is not suitable Time for entry the long or short position because btc is in the middle of the tunnel

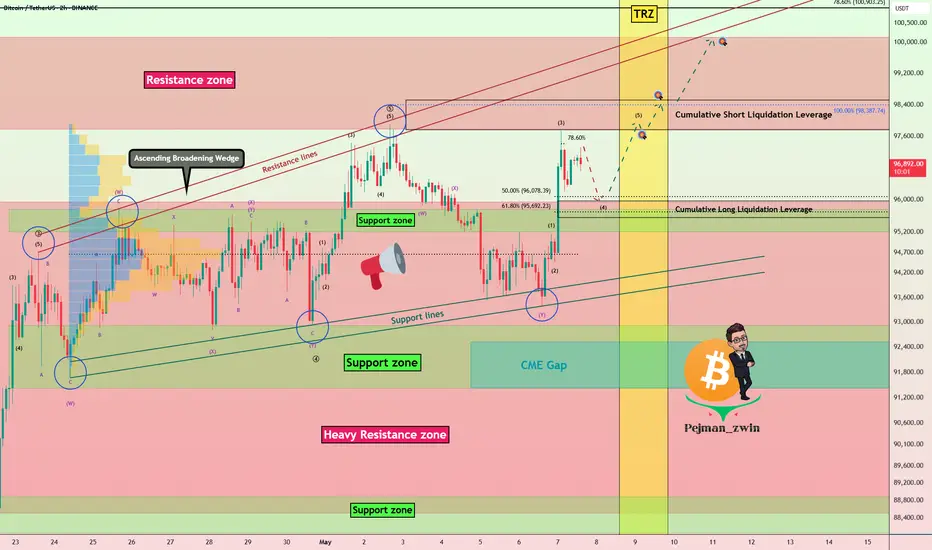
Bitcoin Hits PRZ — Reversal or Breakout?As I expected in my previous idea , Bitcoin ( BINANCE:BTCUSDT ) started to rise from the Support zone($95,760-$95,200) . One of the news that pumped Bitcoin was " Arizona Becomes Second U.S. State to Adopt Bitcoin for State Treasury "
Bitcoin is trading in the Resistance zone($100,200-$97,700) and near the upper lines of the Ascending Broadening Wedge Pattern , Time Reversal Zone(TRZ) and Potential Reversal Zone(PRZ) .
Also, we can see a Regular Divergence(RD-) between Consecutive Peaks.
From an Elliott wave theory , it seems we should wait for corrective waves because the Cumulative Short Liquidation Leverage($100,888-$99,826) is very important and I DO NOT expect it to be broken by a single attack .
Another point we can pay attention to is the existence of two small CME Gaps , the first CME Gap($98,430-$98,380) is likely to be filled.
I expect Bitcoin to drop to at least $98,100 in the coming hours, and if the Support zone($97,900-$97,240 ) is broken, we should expect further declines, so I will label this idea as ''Short' '.
Cumulative Long Liquidation Leverage: $98,500-$97,514
Note: If Bitcoin can break the Potential Reversal Zone(PRZ) with the good volume, we can expect a new All-Time High(ATH).
Do you think Bitcoin is on track for a new All-Time High(ATH)?
Please respect each other's ideas and express them politely if you agree or disagree.
Bitcoin Analyze (BTCUSDT), 2-hour time frame.
Be sure to follow the updated ideas.
Do not forget to put a Stop loss for your positions (For every position you want to open).
Please follow your strategy and updates; this is just my Idea, and I will gladly see your ideas in this post.
Please do not forget the ✅' like '✅ button 🙏😊 & Share it with your friends; thanks, and Trade safe.

Bitcoin Breaks Heavy Resistance Zone— But Can It Hold?Bitcoin ( BINANCE:BTCUSDT ) started to rise yesterday as the S&P 500 Index ( FOREXCOM:SPX500 ) opened and it seems like it can break the Heavy Resistance zone($95,950-$88,500 ) this time, but there are still concerns from a technical analysis , so please stay tuned for this analysis .
Bitcoin is moving near the Resistance zone($100,200-$97,700) and has broken through the Heavy Resistance zone($95,950-$88,500) with good momentum .
In terms of Elliott wave theory , it seems that Bitcoin has completed microwave 3 near the Resistance zone($100,200-$97,700) and we should wait for the completion of microwave 4 . The microwave 4 can be considered a pullback to the Heavy Resistance zone($95,950-$88,500 ).
I expect Bitcoin to drop to at least $96,000 and is likely to touch the Support zone($95,760-$95,200) and start rising again, since microwave 3 was with high momentum , it is possible that microwave 5 will even be truncated . The targets I have indicated on the chart can be the target of a long position .
If you are looking for a Bitcoin reversal, you can focus on the Time Reversal Zone(TRZ) . The next major pivot will likely be within this time zone .
It seems reasonable to open a Long position near the Support zone($95,760-$95,200) , and it can give us a good Risk-To-Reward . What do you think?
----------------------------------------------------
My concerns for Bitcoin's continued bullish trend:
Because Bitcoin's correlation with US stock market indices , especially the SPX500 , is higher than in previous weeks, my analysis is that there is a re-correction in the SPX500 index , which could prevent Bitcoin from continuing its upward trend .
The Ascending Broadening Wedge pattern is likely to complete, which could cause Bitcoin to fall further if the lower lines of this pattern are broken.
If tensions between Pakistan and India increase, it could prevent Bitcoin from growing further.
----------------------------------------------------
Also, Today, the Federal Funds Rate is scheduled to be announced.
Let’s take a look at how this decision — along with Powell’s speech — might impact Bitcoin . Be cautious with your positions during the announcement and Powell’s remarks, as markets may become volatile.
Holding the rate steady is a signal of monetary policy stability, which could give risk assets like Bitcoin some breathing room in the short term.
Given recent U.S. economic data, markets are mainly focused on Powell’s tone during the press conference. If he adopts a dovish stance (hinting at potential rate cuts), this could support Bitcoin’s upward momentum.
However, if Powell emphasizes that rates will remain elevated for an extended period, we might see a temporary wave of selling pressure in the market.
Stay alert and manage your risk wisely — high-impact events like this can lead to sharp moves in crypto.
----------------------------------------------------
Cumulative Short Liquidation Leverage: $98,511-$97,774
Cumulative Long Liquidation Leverage: $95,966-$95,550
Note: If Bitcoin falls below $94,400, we can expect further declines.
Please respect each other's ideas and express them politely if you agree or disagree.
Bitcoin Analyze (BTCUSDT), 2-hour time frame.
Be sure to follow the updated ideas.
Do not forget to put a Stop loss for your positions (For every position you want to open).
Please follow your strategy and updates; this is just my Idea, and I will gladly see your ideas in this post.
Please do not forget the ✅' like '✅ button 🙏😊 & Share it with your friends; thanks, and Trade safe.
Bitcoin Still Stuck in Resistance – Eyes on CME Gaps & USDT.D%Bitcoin ( BINANCE:BTCUSDT ) touched $92,830(first target) and started to rise as I expected in the previous idea . Overall, Bitcoin has been moving in a range for about 12 days .
Note : In general, trading in a range market is more difficult than in a trending market . If your performance in a range market is not good, it is better not to trade until the trend is clear (this is just a suggestion).
Bitcoin is currently trading at a Heavy Resistance zone($95,950-$88,500) and has failed to break through it, and it seems like Bitcoin needs more momentum to break through this zone. Do you think Bitcoin will finally break through the Heavy Resistance zone($95,950-$88,500)?
In terms of Elliott Wave theory , it appears that Bitcoin has completed a five-wave impulsive and we should expect Corrective waves .
The analytical conditions of the Bitcoin chart have been a bit ambiguous in the past few days, so it's better to take a look at the USDT.D% ( CRYPTOCAP:USDT.D ) chart to increase the accuracy of Bitcoin analysis .
USDT.D% failed to break the Support zone(5.13%-4.95%) after several attacks. It currently appears to be forming an Ascending Broadening Wedge Pattern . It appears that USDT.D% needs to complete this pattern to break the support zone, and if this pattern fails , we should expect further increases =Bitcoin crash .
I expect Bitcoin to decline to the Support zone($92,910-$91,414) , 21_SMA(Weekly) and Cumulative Long Liquidation Leverage($93,359-$92,296) and probably fill the CME Gap($92,525-$91,415) this time and then start to rise and prepare to break the Heavy Resistance zone($95,950-$88,500) and fill the CME Gap($97,680-$96,455) .
Cumulative Short Liquidation Leverage: $98,989-$97,924
Note: If Bitcoin breaks below the Support zone($92,910-$91,414), we should expect further declines.
Please respect each other's ideas and express them politely if you agree or disagree.
Bitcoin Analyze (BTCUSDT), 1-hour time frame.
Be sure to follow the updated ideas.
Do not forget to put a Stop loss for your positions (For every position you want to open).
Please follow your strategy and updates; this is just my Idea, and I will gladly see your ideas in this post.
Please do not forget the ✅' like '✅ button 🙏😊 & Share it with your friends; thanks, and Trade safe.

BTCUSD Possible Move May 6th 2025🔻 BTC/USD – SHORT SIGNAL & ANALYSIS
📉 Signal:
Sell BTC/USD below 94,000 after a confirmed break and retest of the ascending trendline.
Target: 93,000 liquidity zone
Stop Loss: Above 94,400 (or structure high after retest)
Risk/Reward: Approx. 1:2+
📊 Analysis:
Price has been in a descending channel, followed by a corrective structure forming higher lows.
Currently testing a rising trendline, suggesting weakening bullish momentum.
Clean liquidity pool rests around 93,000, likely to be targeted if structure breaks.
Expected flow:
Break below 94,000 trendline
Retest the trendline as resistance
Continuation to 93,000 demand/imbalance area
🧠 Trade Idea Summary:
This setup aligns with bearish market structure and liquidity concepts. A breakdown from the trendline would confirm bearish intent, with 93,000 as the next logical draw on price.

Will BTC Correct Before Breaking $96K? CME Gap Still Open!Bitcoin ( BINANCE:BTCUSDT ) moved as it did in the previous post , I hope it was useful for everyone.
Bitcoin is still moving in the upper areas of the Heavy Resistance zone ($95,000-$88,500) , this type of movement does NOT seem to be enough to break Heavy Resistance zone ($95,000-$88,500) , so I still expect a correction .
The volume of Bitcoin's price rebound to the previous high does NOT seem to be sufficient, and even Regular Divergence(RD-) is evident.
According to Elliott Wave theory , it seems that Bitcoin has completed its 5 impulse waves and we should expect another decline . Of course, there is still a possibility that the main wave 4 will be an Expanding Flat(ABC/3-3-5) . But both scenarios can bring us a decline in Bitcoin price .
I expect Bitcoin will NOT be able to break the Heavy Resistance zone ($95,000-$88,500) before the CME Gap($92,525-$91,415) is filled, This is just my analysis of course, considering the above explanation. What do you think?
Cumulative Short Liquidation Leverage: $96,000-$95,095
Cumulative Long Liquidation Leverage: $93,350-$92,551
Cumulative Long Liquidation Leverage: $90,276-$89,160
Note: If Bitcoin goes over $96,100, we can expect more pumps.
Please respect each other's ideas and express them politely if you agree or disagree.
Bitcoin Analyze (BTCUSDT), 1-hour time frame.
Be sure to follow the updated ideas.
Do not forget to put a Stop loss for your positions (For every position you want to open).
Please follow your strategy and updates; this is just my Idea, and I will gladly see your ideas in this post.
Please do not forget the ✅' like'✅ button 🙏😊 & Share it with your friends; thanks, and Trade safe.

BTC Pumped Hard – Is It Time for a Pullback to Fill CME GAP!?Bitcoin ( BINANCE:BTCUSDT ) started pumping after the pullback, as I expected in my previous post , I hope you were able to take profits.
Bitcoin is trading in the upper areas of the Heavy Resistance zone ($95,000-$88,500) , near the Resistance lines and the upper line of the ascending channel .
Also, we can see the Regular Divergence(RD-) between Consecutive Peaks .
From the Elliott Wave theory perspective , it seems that Bitcoin has completed the main wave 3 and we can expect the completion of the main wave 4 today .
I expect Bitcoin to correct in the next few hours and drop to the targets I have specified on the chart and fill the CME Gap($93,465-$91,415) .
Cumulative Short Liquidation Leverage: $95,700-$94,542
Cumulative Long Liquidation Leverage: $92,666-$91,415
Cumulative Long Liquidation Leverage: $90,276-$89,160
Note: If Bitcoin can break the upper line of the ascending channel, we should wait for the next pump.
Please respect each other's ideas and express them politely if you agree or disagree.
Bitcoin Analyze (BTCUSDT), 1-hour time frame.
Be sure to follow the updated ideas.
Do not forget to put a Stop loss for your positions (For every position you want to open).
Please follow your strategy and updates; this is just my Idea, and I will gladly see your ideas in this post.
Please do not forget the ✅' like '✅ button 🙏😊 & Share it with your friends; thanks, and Trade safe.

BTC NEXT MOVE ANALYSIS Bitcoin is showing strong bullish momentum, with a potential pullback setup forming. We are currently watching the $93,300 zone for short term reaction, but our primary interest lies lower.
A buy limit is planned at $90,500, aligning with a high-probability demand zone and market structure support. This area could provide an optimal entry for a continued push toward the draw of liquidity near $96,500.
Stay patient any dip toward this zone is a buying opportunity.
Setup is valid unless price closes below $90,000.
Stay Tuned For More 🤝🎖️🫡

BTC Breaks Key Resistance –Pullback Your Last Chance to Enter!?To start today's analysis, it's best to look at the Bitcoin ( BINANCE:BTCUSDT ) analysis I shared with you on April 10 , which can give us good insight and has performed well so far .👇
Bitcoin seems to have finally managed to break through Important Resistance lines as well as the Resistance zone ($86,500-$85,150) . The break volume is also high and could be a good sign for the continuation of the upward trend .
According to Elliott Wave theory , with the breaking of important resistance lines , we should wait for the next 5 impulsive waves , which I will try to analyze step by step in this idea and future ideas.
I expect Bitcoin to attack the Heavy Resistance zone ($95,000-$88,500) for the first time after the pullback to the broken Resistance zone ($86,500-$85,150) (it is better to enter a long position on the pullback ). Basically, assets can NOT break such heavy zones for the first time . ( With very good news, it may break for the first time ).
Cumulative Long Liquidation Leverage: $86,022-$85,539
Cumulative Short Liquidation Leverage: $89,340-$88,000 = Important
Do you think the main uptrend has resumed or will Bitcoin correct again?
Note: The pullback is likely to start from the third point of contact with the Resistance lines.
Note: If Bitcoin falls below $85,100, it seems we should expect further declines.
Please respect each other's ideas and express them politely if you agree or disagree.
Bitcoin Analyze (BTCUSDT), 1-hour time frame.
Be sure to follow the updated ideas.
Do not forget to put a Stop loss for your positions (For every position you want to open).
Please follow your strategy and updates; this is just my Idea, and I will gladly see your ideas in this post.
Please do not forget the ✅' like '✅ button 🙏😊 & Share it with your friends; thanks, and Trade safe.

Failed Breakout + Rising Wedge = Bearish Signal for Bitcoin!?Bitcoin ( BINANCE:BTCUSDT ) attacked the Resistance zone ($87,520-$85,840) and the important Resistance line as I expected in yesterday's idea , but it seems that it failed to break .
Bitcoin is moving between two Support and Resistance zones .
From a Classic Technical Analysis , Bitcoin appears to have formed a Rising Wedge Pattern .
From an Elliott Wave theory , Bitcoin appears to have completed a main wave 5 on the 1-hour time frame .
Also, we can see the Regular Divergence(RD-) between Consecutive Peaks .
If we look at the Bitcoin chart in the 4-hour timeframe , a Shooting Star Candlestick Pattern with high volume is clearly visible near the Resistance zone ($87,520-$85,840 ), which could signal a reversal and decline in Bitcoin .
I expect Bitcoin to start declining again after an upward correction and break the lower line of the rising wedge pattern , and reach the targets I have indicated on the chart.
Cumulative Short Liquidation Leverage: $87,708-$86,487
Cumulative Long Liquidation Leverage: $84,520-$83,687
Do you think Bitcoin can finally break the important resistance line? I would like to hear your thoughts.
Note: If Bitcoin breaks above the Resistance zone ($87,520-$85,840), we can expect a pump.
Note: If Bitcoin falls below $81,000, we can expect further declines.
Please respect each other's ideas and express them politely if you agree or disagree.
Bitcoin Analyze (BTCUSDT), 1-hour time frame.
Be sure to follow the updated ideas.
Do not forget to put a Stop loss for your positions (For every position you want to open).
Please follow your strategy and updates; this is just my Idea, and I will gladly see your ideas in this post.
Please do not forget the ✅' like '✅ button 🙏😊 & Share it with your friends; thanks, and Trade safe.

Bitcoin Bullish Bat Harmonic Forming – Breakout Imminent!?Bitcoin ( BINANCE:BTCUSDT ) then reached $85,500 , as I expected in my previous post .
Today, I want to share with you a short-term analysis of Bitcoin , and Bitcoin can break the Important Resistance line !
Bitcoin is trading near the Support zone($83,880-$82,380) and Support lines .
Bitcoin is likely to start rising again with the help of the Bullish Bat Harmonic Pattern .
I expect Bitcoin to start rising again either with the help of the Bullish Bat Harmonic Pattern or near the Support lines and Cumulative Long Liquidation Leverage($82,426-$81,439) . The first target could be the important resistance line , and if it breaks, it looks like Bitcoin could break the resistance zone ($87,520-$85,840 ) as well.
Cumulative Short Liquidation Leverage: $86,624-$85,486
Note: To break the Important Resistance line , we need a candle with high volume at least on the 4-hour time frame , like the Bullish Marubozu candle ; otherwise, it is probably we will see fake break . Since this line is of great importance, it is better to look for a confirming candle on the 4-hour time frame as well ( even a Doji candle with a small green body ).
Note: If Bitcoin falls below $81,000, we can expect further declines.
Do you think Bitcoin can break the Important Resistance line!?
Please respect each other's ideas and express them politely if you agree or disagree.
Bitcoin Analyze (BTCUSDT), 15-minute time frame.
Be sure to follow the updated ideas.
Do not forget to put a Stop loss for your positions (For every position you want to open).
Please follow your strategy and updates; this is just my Idea, and I will gladly see your ideas in this post.
Please do not forget the ✅' like '✅ button 🙏😊 & Share it with your friends; thanks, and Trade safe.

Bitcoin’s 80-Day Correction Ending!?(Signs)Today, I want to share with you a mid-term analysis of Bitcoin( BINANCE:BTCUSDT ), I hope it will be useful for you.
Please stay with me.
Bitcoin started to fall last week due to the tariffs that Donald Trump imposed on countries around the world. In general, since last week, Bitcoin has become more correlated with US stock market indices (such as FOREXCOM:SPX500 ) than before.
But yesterday, Donald Trump postponed the implementation of tariffs for 90 days , except for China , which caused the US stock market indices to grow rapidly, and Bitcoin did not miss out on this growth. So, for the next 90 days , we should wait for news of bilateral tariffs between China and the US , which is likely to make an agreement between the two countries. What do you think!?
Also, just minutes ago, key U.S. inflation data was released — and it came in softer than expected.
The CPI m/m dropped to -0.1%, and Core CPI m/m slowed to 0.1% , both missing forecasts. This drop in inflation significantly reduces immediate pressure on the Fed to maintain a hawkish stance . With inflation cooling off, the market is now pricing in a more dovish Fed , which has historically been a bullish catalyst for Bitcoin .
Also, in the last 24 hours , another positive news came for Bitcoin: " China and Russia are using Bitcoin to settle energy trades ," which could be effective in increasing the price of Bitcoin .
--------------------------------------------
Now, based on the above explanation, let's focus on analyzing the Bitcoin chart on the 12-hour time frame .
Bitcoin started to rise quickly after touching the Heavy Support zone($73,780-$59,000) , Potential Reversal Zone(PRZ) , and 50_SMA(Weekly) . It seems that the Important Uptrend line breakout has NOT been successfully completed. One sign of a return could be the formation of a Morningstar Candlestick Pattern , which has also been accompanied by good volume .
Bitcoin has been moving in a descending channel for the past 80 days since its All-Time High(ATH=$109,588) , so a break of the upper line of this descending channel could be a significant sign of a rebound for Bitcoin .
Bitcoin is trying to break the Resistance zone($84,000-$81,130) . The price that is important for Bitcoin right now is $84,000 ; if Bitcoin can close a candle on the 4-hour time frame above the Resistance zone($84,000-$81,130) and $84,000 , we can hope for a breakout of the descending channel.
In terms of the Elliott Wave theory , Bitcoin appears to have been in a Double Three Correction(WXY) for the past 80 days. A break of the descending channel could reconfirm the end of this correction.
I expect Bitcoin to fill the CME Gap($85,940-$85,240) after breaking the Resistance zone($84,000-$81,130) in the first step and make the first attack on 50_SMA(Daily) . If the descending channel breaks, the second target could be around $88,000 , where there is an important Cumulative Short Liquidation Leverage($89,319-$88,375) .
Also, if Bitcoin moves in a range between $90,000 and $85,000 , we can expect an Altseason , given the conditions of BTC.D% ( CRYPTOCAP:BTC.D ). What do you think?
Note: If Bitcoin falls below $77,200, we should expect further declines.
Note: If Bitcoin can break the Heavy Resistance zone($95,000-$88,500), we should expect a new All-Time High(ATH).
Please respect each other's ideas and express them politely if you agree or disagree.
Bitcoin Analyze (BTCUSDT), 12-hour time frame.
Be sure to follow the updated ideas.
Do not forget to put a Stop loss for your positions (For every position you want to open).
Please follow your strategy and updates; this is just my Idea, and I will gladly see your ideas in this post.
Please do not forget the ✅' like '✅ button 🙏😊 & Share it with your friends; thanks, and Trade safe.

Bitcoin Short-Term Setup: Watch $79K Resistance!!!Bitcoin ( BINANCE:BTCUSDT ) started to fall again ,as I expected in the previous post .
This post is also a short-term analysis and is on the 15-minute time frame .
Bitcoin is moving near the Potential Reversal Zone(PRZ) .
In terms of Elliott Wave theory , Bitcoin appears to have completed a 5-wave downtrend on the 15-minute timeframe.
I expect Bitcoin to continue its upward trend in the coming hours , at least to the Resistance zone($79,350-$78,540) .
Note: If Bitcoin falls below $75,470, we can expect further declines.
Please respect each other's ideas and express them politely if you agree or disagree.
Bitcoin Analyze (BTCUSDT), 15-minute time frame.
Be sure to follow the updated ideas.
Do not forget to put a Stop loss for your positions (For every position you want to open).
Please follow your strategy and updates; this is just my Idea, and I will gladly see your ideas in this post.
Please do not forget the ✅' like '✅ button 🙏😊 & Share it with your friends; thanks, and Trade safe.

Bitcoin Pullback Complete – Bears Gearing Up for Round Two!!!First of all, let me say that the market has been very excited these past few days, so be more careful with your capital management.
Also, these days, Bitcoin ( BINANCE:BTCUSDT ) has a high correlation with the US stock market indices , and one of the most important of them is the S&P 500 Index ( FOREXCOM:SPX500 ).
Today, I published the following analysis for the S&P 500 Index , which I used as a result of that analysis for Bitcoin .
Bitcoin is trading near the Resistance zone($81,610-$79,800) , the Yearly Pivot Point , the Daily Pivot Point , the important uptrend line (broken) , and the Cumulative Short Liquidation Leverage($81,500-$79,677).
Overall, it seems that this uptrend in Bitcoin over the past few hours was a pullback to the broken Important uptrend line and the liquidation of short position s. Do you agree with me?
In terms of Elliott Wave theory , it seems that the uptrend of the last few hours has been in the form of a Zigzag Correction(ABC/5-3-5) and we should expect another decline .
Based on the above explanation , I expect Bitcoin to resume its downtrend and approach the Potential Reversal Zone(PRZ) again ( after breaking the support lines ).
Cumulative Long Liquidation Leverage: $74,520-$73,244
If you want to see my overall view of Bitcoin on the weekly timeframe and further understand the significance of the Uptrend line(broken) , you can refer to the following idea:
Note: If Bitcoin can completely fill the CME Gap($84,475-$81,450), we should expect further increases.
Please respect each other's ideas and express them politely if you agree or disagree.
Bitcoin Analyze (BTCUSDT), 15-minute time frame.
Be sure to follow the updated ideas.
Do not forget to put a Stop loss for your positions (For every position you want to open).
Please follow your strategy and updates; this is just my Idea, and I will gladly see your ideas in this post.
Please do not forget the ✅' like '✅ button 🙏😊 & Share it with your friends; thanks, and Trade safe.
