$OGN Performing Falling wedge in 4h Breakout doneNYSE:OGN Performing Falling wedge in 4h Breakout done
Falling Wedge
The falling wedge can either be a reversal or continuation signal.
As a reversal signal, it is formed at a bottom of a downtrend, indicating that an uptrend would come next.
As a continuation signal, it is formed during an uptrend, implying that the upward price action would resume. Unlike the rising wedge, the falling wedge is a bullish chart pattern.
In this example, the falling wedge serves as a reversal signal. After a downtrend, the price made lower highs and lower lows.
Notice how the falling trend line connecting the highs is steeper than the trend line connecting the lows.
If we placed an entry order above that falling trend line connecting the pair’s highs, we would’ve been able to jump in on the strong uptrend and caught some pips!
A good upside target would be the height of the wedge formation.
If you want to go for more pips, you can lock in some profits at the target by closing down a portion of your position, then letting the rest of your position ride.
Btcsignals

$FLOKI performing Descending $FLOKI performing Descending Triangle in 1d Yes I am interested to buy here
What Is a Descending Triangle Chart Pattern?
A descending triangle is a powerful technical analysis pattern with a predictive accuracy of 87%. The pattern is flexible and can break out up or down, and is a continuation or a reversal pattern.
A descending triangle has one declining trendline that connects a series of lower highs and a second horizontal trendline that connects a series of lows. A descending triangle can be bearish or bullish or a reversal or continuation pattern, depending on the direction of the price breakout.
A descending triangle occurring during a price uptrend, with a price breakout above the resistance line, is considered a bullish continuation pattern. (See chart below)
Conversely, a descending triangle occurring during a price downtrend, with the price breaking out above the resistance line, is considered a reversal pattern.
KEY POINTS
The descending triangle has a horizontal support line and a declining slope resistance line.
If the price breaks out of the triangle in the direction of the previous trend, it is a continuation pattern.
If the price breaks out of the triangle in the opposite direction of the previous trend, it is a reversal pattern.

$BTC Daily UpdateCRYPTOCAP:BTC #BTC $29,483 support testing as expected, Last 4h closed bearish, $29,199 support could come in effect, Weak volume, will see some struggle at $29,199-$29,483 support range.
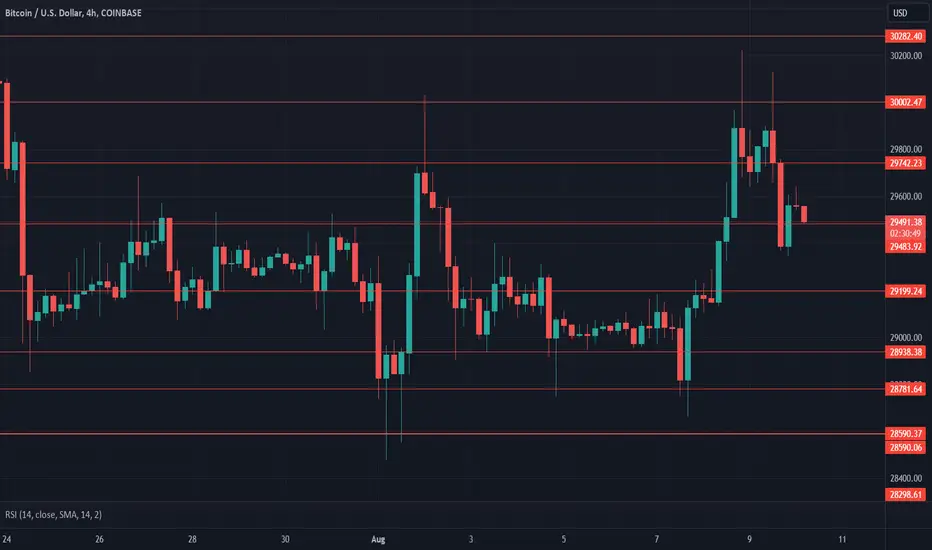
$BTC Daily UpdateCRYPTOCAP:BTC #BTC beautifully done! As expected tested $29,483 and attempted at $30,002, currently moving to test $29,483 support, previous 4h closed bearish expecting support test $29,483 which should hold. Beautiful follow up close on 1d. Watch given S/R

$BTC Daily UpdateCRYPTOCAP:BTC #BTC attempting $29,199 test, possible bullish engulfing on 4h, Beautiful previous daily close with bullish pin bar, if followed thru expected $29,483 test. Watch given S/R, current support $28,938

$BTC Daily UpdateCRYPTOCAP:BTC struggle gaining $29,199 support, $29,483 resisting, Current support at $28,938. Weak volume, average RSI on 4h and 1d, will continue sideway for short term.

$BTC Daily UpdateCRYPTOCAP:BTC #BTC $29,742 resistance in effect and testing, $29,483 support yet to be tested. Last 4h closed bearish, Bullish engulfing with bullish hammer on previous 1d close, Follow thru can help take $30,002 support.

Bitcoin the closing monthly options worth 2 billion, July 28I closed a short position on Bitcoin, a high chance of a rebound to 30,500 - 31,000, after which we will continue to decline to the levels of 0.618, I indicated a wide area on the chart. Now the volume indicator indicates strong buyer pressure at all time frames.

$BTC Daily UpdateCRYPTOCAP:BTC Back on $29,199 support with bullish engulfing signaling reversal on 4h Yesterday. Avoided dump following bearish pin bar on 4h, looks good on $29,199 key support area. 1D closed with bearish pin bar, required $29,742 support.
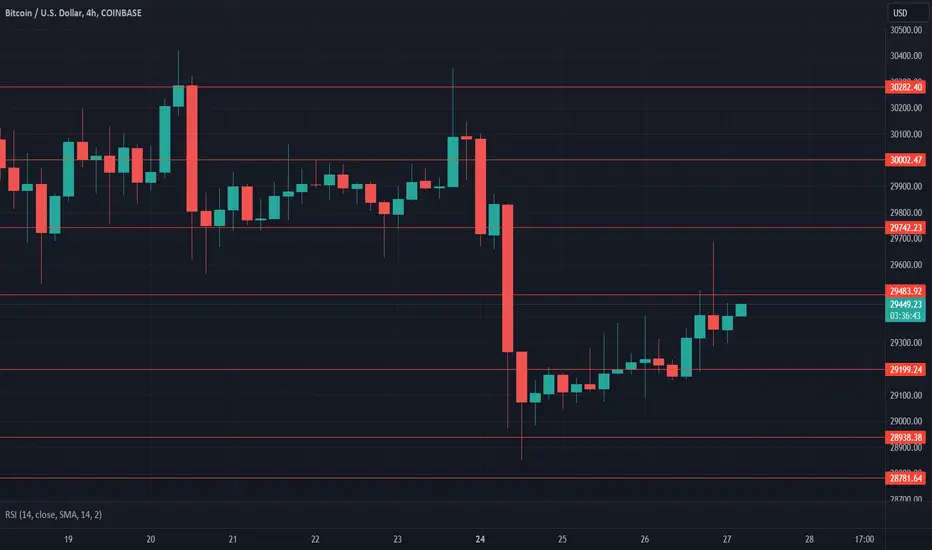
$BTC Daily UpdateCRYPTOCAP:BTC #BTC broke below $29,199, struggling to regain $29,199, expect resistance here. Put bearish engulfing on 1D as warned yesterday. Current support at $28,938, if continues to drop next key support to watch at $28,590. Watch given S/R

$BTC Daily UpdateCRYPTOCAP:BTC #BTC $29,742 retested following bearish 4h close as expected, 1D closed with bearish pin bar. Daily volume dropping, RSI looks fine on 4h and 1d, expecting sideways movement little bit more here, $30,282-$29,483 range.

BITCOIN Near the 1D MA50, ready for a pump to $34000Bitcoin (BTCUSD) has been consolidating for nearly a full month (since the June 23rd High) and the 1D MA50 (blue trend-line) is only 1000 points away. Since the bullish break-out exactly at the start of the year, BTC has used the 1D MA50 as the short-term Support and more specifically the bounce level before each Higher High.
As you see on this chart, the movement since the start of 2023 has been fairly Cyclical, a Higher Highs rejection starts a correction, which when the 1D MA50 breaks (1D candle closes below it), extends towards the 1D MA200 (orange trend-line). This sequence current has the last Higher High to give and we expect to start any time. Our target is $34000.
Do you think the 1D MA50 will hold or break? Feel free to let us know in the comments section below!
-------------------------------------------------------------------------------
** Please LIKE 👍, FOLLOW ✅, SHARE 🙌 and COMMENT ✍ if you enjoy this idea! Also share your ideas and charts in the comments section below! **
-------------------------------------------------------------------------------
💸💸💸💸💸💸
👇 👇 👇 👇 👇 👇

$BTC Daily UpdateCRYPTOCAP:BTC #BTC $30,282 resisting, support at $30,002 to be tested, current 4h looking ugly, could put bullish engulfing on 1D if followed thru previous 1d close, $31,010 support is must. Watch given S/R

$BTC Daily UpdateCRYPTOCAP:BTC #BTC $30,282 support testing, been struggling here for more than 48 hours, $30,002-$30,282 current support range. Previous daily closed neutral, could put bearish or bullish engulfing today, watch given key support areas.
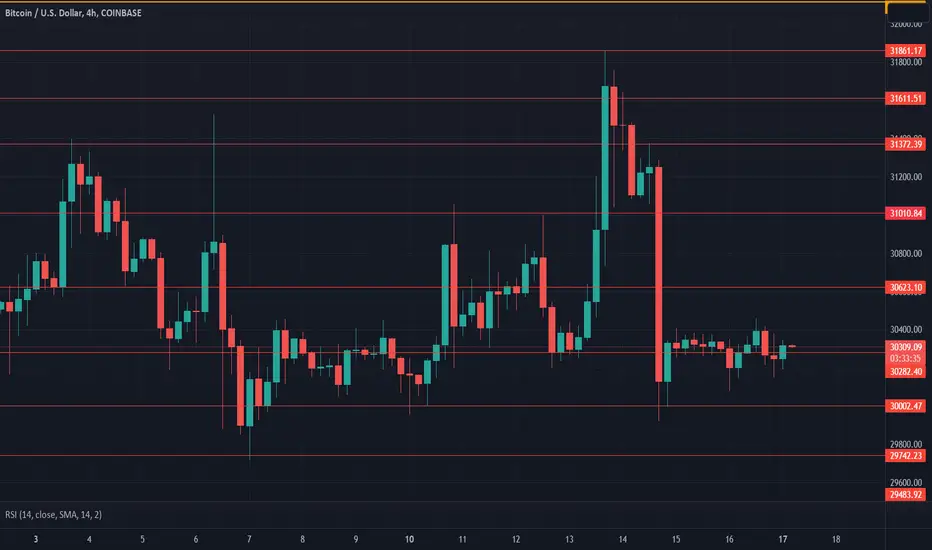
$BTC Daily UpdateCRYPTOCAP:BTC #BTC $31,372 support in effect, CRYPTOCAP:XRP news gave the required push thru $31,372 yesterday, $31,861 resistance rejected, doji on last 4H, bullish engulfing 1D close requires follow up today. Next resistance $31,113. Support $31,372 looks fine, $31,010 could be key support.

BTC looks Good For Next MOVE Bullish Rectangle
After an uptrend, the price paused to consolidate for a bit. Can you guess where the price is headed next?
If you answered up, then you’re right! Check out that nice upside breakout right there!

$BTC Daily UpdateCRYPTOCAP:BTC #BTC Nice attempt yesterday to gain $31,010 but failed with rejection, Last 4H closed bearish, current 4h with very low volume. 1D closed bearish, current support $30,282 at risk. $30,623 initial resistance, RSI looks fine on 1D and 4H.

BTClooks like a text book 5 up channel extended wave 3 pattern with the target for wave 3 between the 786% of 2021 highs and as the 1.618 of the wave 1 fib extension.

$BTC Daily UpdateCRYPTOCAP:BTC #BTC resistance at $30,282 as expected, unable to gain support $30,282. Too weak volume, RSI looks fine on 1D and 4H. Avoided follow thru to bearish close from Thursday on 1D.

$BTC Daily UpdateCRYPTOCAP:BTC #BTC Back to $29,742 support following $31,372 test rejection. Ugly bearish wick on 4h yesterday with follow thru. $29,742-$31,372 range maintained with $29,742 being key support, 1D closed poorly bearish, expect resistance from $30,282. Watch given S/R
$BTC Daily UpdateCRYPTOCAP:BTC #BTC Current 4h looking mighty good, approaching $31,010 resistance. Previous 4h closed good, 1D close also looking good. RSI at 54 on 4h, and 64 on 1d. Current 4h with good volume, expecting test. $30,623 awaiting test for support.

BTCUSD AnalysisBitcoin on weekly supply zone resistance, after rejecting from it the first time, obviously bitcoin is at the zone the second time, seeing the momentum weekly candle, Bitcoin might retrace 50% of the momentum candle.
the possibility for bitcoin to take out the weekly supply zone(sell zone) is 50% compare to possibility for Bitcoin to retrace 50% of the momentum candle is 75%.
the best location to trade Bitcoin is at the 50% of the momentum candle to go Bullish in to the weekly supply zone.
Also note that the weekly bias for Bitcoin is bullish (on ascending trend line)

$BTC Daily UpdateMIL:BTC #BTC as warned broke $31,010 support, back on $30,623 support with $31,010 resisting. 1d closed fine avoiding bearish engulfing. 1D and 4H RSI looks good, $31,372 needed as support to avoid fakeout.
