BTC #Trade timeHello guys Im here with another Trade time
I see Wave (-C-) so it can move down lets wait to see if green side breaks
Btcsignals

BITCOIN If the low volume worries you, see this chart!Bitcoin (BTCUSD) has been on a strong recovery since late November, following the FTX crash but is doing so on Decreasing Volume. This is something that has gotten many market participants worry as decreasing volume during rallies make the trend fragile.
A simple look however at past Cycle bottoms is enough to provide a good understanding of the current situation. As this chart (4D time-frame) shows, there was Decreasing Volume on all previous major market bottoms, especially in times of extreme capitulation such as the March 2020 COVID crash, or the August 2015 Bitfinex crash. With the FTX crash in early November 2022 being such a capitulation even, there should be no surprise that the volume has been decreasing ever since. With BTC almost doubled since then, we can strongly claim that this is a standard Cycle bottom rally.
If we start seeing the volume rising, then it means that the market is most likely headed for the mid Cycle peak, typically before the next Halving.
In any case are you worried about this decreasing volume while the price has been rising or agree that this is common after Cycle bottoms? Feel free to let us know in the comments section below!
-------------------------------------------------------------------------------
** Please LIKE 👍, FOLLOW ✅, SHARE 🙌 and COMMENT ✍ if you enjoy this idea! Also share your ideas and charts in the comments section below! **
-------------------------------------------------------------------------------
💸💸💸💸💸💸
👇 👇 👇 👇 👇 👇

btcusdt long short on 15 TFThe close above the sma will be the targets as shown to you above, and if it could not then the targets will be below shown
Here we have support and resistance as well. Watch them all and make decisions to enter and exit

BITCOIN When you see this, it will already be TOO LATE!This is an interesting analysis on the 1W time-frame of Bitcoin (BTCUSD) against the GOLD/SPX ratio(blue trend-line). The conclusion that this comparison offers can be very valuable.
As you see, when the GOLD/SPX ratio peaks and starts pulling back, Bitcoin starts the Parabolic Rally of its Bull Cycle. At the moment the GOLD/SPX ratio is on a Channel Up similar to 2018 - 2019. When the ratio broke that Channel to the upside, it peaked as in February 2016 and started to decline. At the same time Bitcoin kick started its Parabolic Rally.
Will you be on the look-out for such a spike or when it happens it will already be too late? Feel free to let us know in the comments section below!
-------------------------------------------------------------------------------
** Please LIKE 👍, FOLLOW ✅, SHARE 🙌 and COMMENT ✍ if you enjoy this idea! Also share your ideas and charts in the comments section below! **
-------------------------------------------------------------------------------
💸💸💸💸💸💸
👇 👇 👇 👇 👇 👇

BITCOIN Never looked back after breaking this level!Bitcoin (BTCUSD) is above the Multiple 3 (black trend-line) of the Fibonacci MAs for the third straight 3W candle. Every time it did so, the price always hit Multiple 4 (yellow trend-line). This level is now at $43300 and rising. Do you think this is BTC's next target within a 6 month time-frame? Feel free to let us know in the comments section below!
-------------------------------------------------------------------------------
** Please LIKE 👍, FOLLOW ✅, SHARE 🙌 and COMMENT ✍ if you enjoy this idea! Also share your ideas and charts in the comments section below! **
-------------------------------------------------------------------------------
💸💸💸💸💸💸
👇 👇 👇 👇 👇 👇

$BTC Daily UpdateCRYPTOCAP:BTC #BTC HKEX:28 ,298 support in effect, HKEX:28 ,781 resisting as expected. Last 4H closed bearish. HKEX:29 ,199 support must be regained, Watch given S/R

$BTC Daily UpdateCRYPTOCAP:BTC #BTC Dived to HKEX:28 ,298 breaking HKEX:29 ,199 support. Should be able to hold HKEX:28 ,298 support. Today's daily candle following up gravestone doji from last 1D close. Initial resistance HKEX:28 ,781.

$BTC Daily UpdateCRYPTOCAP:BTC #BTC Struggling to hold HKEX:29 ,483 support, HKEX:29 ,199 support holding. 1D closed very good, a good follow thru can send to test HKEX:30 ,002.

$BTC Daily UpdateCRYPTOCAP:BTC #BTC Not looking good on current 4H, HKEX:29 ,483 resisting, Current support at HKEX:28 ,781. Saved on last 1D close. HKEX:29 ,483 support needed to retest HKEX:30 ,002.

BITCOIN Held key Cycle Support, preparing a mega break-out!Bitcoin (BTCUSD) is rebounding off the 0.5 Fibonnaci Lower Lows trend-line that provided Support numerous times during the previous Cycle but when it finally closed a 1W candle below it (June 06 2022) it started the final bearish sequence.
Currently this is very positive for the upside's chances and if BTC manages to close a 1W candle above the 0 Fib, we can see the final two bullish waes to 36000 and 43000. At the same time, the Higher Lows trend-line since the market bottom is holding, while the 1W MA50 (blue trend-line) hasn't been re-tested in a month and a half.
Do you think that hold on the 0.5 Fib was the key and we are off to the races again? Feel free to let us know in the comments section below!
-------------------------------------------------------------------------------
** Please LIKE 👍, FOLLOW ✅, SHARE 🙌 and COMMENT ✍ if you enjoy this idea! Also share your ideas and charts in the comments section below! **
-------------------------------------------------------------------------------
💸💸💸💸💸💸
👇 👇 👇 👇 👇 👇

$BTC Daily UpdateCRYPTOCAP:BTC #BTC HKEX:27 ,994 resisting as of now, support at HKEX:27 ,478. Bullish engulfing on last 4H close, current 4H looks fine with 28 mins left to close, HKEX:26 ,650- HKEX:26 ,333 test possible if breaks HKEX:26 ,963. HKEX:28 ,298- HKEX:28 ,590 next resistance area to watch

SHORT ON BITCOIN : DO YOU AGREELooking at it the price of bitcoin has grown to our daily order block and has reached the equilibrium of the order block jumping to a one-hour timeframe we can see a weakness that the price what to reverse in the short term to efficiently deliver the price to 28600 level this is my low handing fruit objective to take a trade to, from there we can see a further weakness or strength in the price of bitcoin that will be for later analysis... Pay close attention to the area I marked bearish and bullish for trade entry or exit respectively......
Follow me for more analysis and feel free to ask any questions you have I'm here to help.
remember this is not a trade signal DYOR before investment.
Oluwadahunsi Eyenla
@oluwadahunsieyenla
14th April 2023
Please do like and comment if you like my work even though I just started :) motivate me to do better...

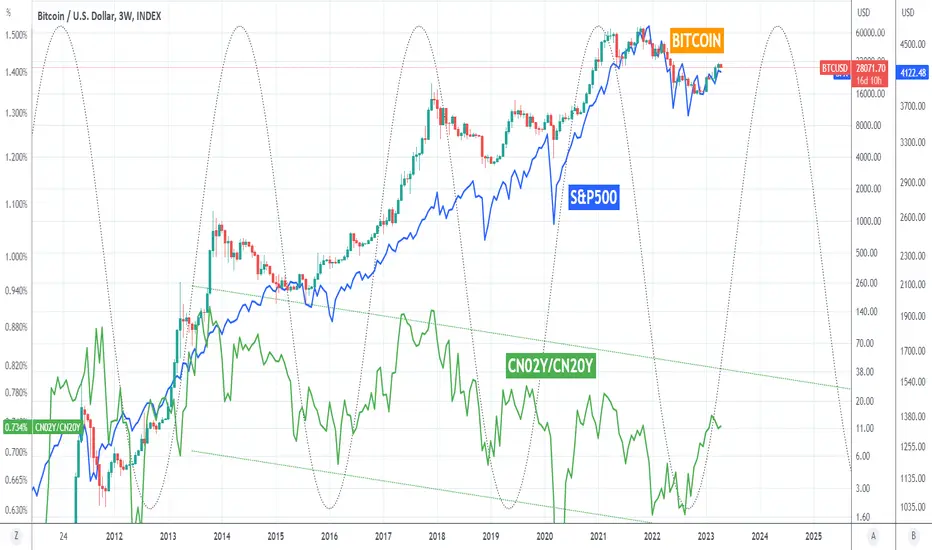
BITCOIN being pumped after China bonds macro cycle bottomIt is not the first time we look into how the Chinese bonds (with our unique CN02Y/CN20Y ratio displayed by the green trend-line) affect Bitcoin's (BTCUSD) Cycles:
It is however the first time we add stocks (S&P500 with the blue trend-line) in the mix. We can see the Cyclical behavior of the bond yields ratio as illustrated by the Sine Waves. Every time it bottoms, BTC and stocks bottom as well and start a cyclical rally. Additionally, you can see how the ratio has been on a Channel Down for the past 10 years, supporting the bullish expansion on both Bitcoin and the stock market.
Since the bond yields ratio is already rallying hard with BTC/ stocks following, do you think that this is just the beginning? Feel free to let us know in the comments section below!
-------------------------------------------------------------------------------
** Please LIKE 👍, FOLLOW ✅, SHARE 🙌 and COMMENT ✍ if you enjoy this idea! Also share your ideas and charts in the comments section below! **
-------------------------------------------------------------------------------
💸💸💸💸💸💸
👇 👇 👇 👇 👇 👇
$BTC Daily UpdateCRYPTOCAP:BTC #BTC HKEX:28 ,298 resisting, on HKEX:27 ,994 support. Daily closed following up to bearish engulfing from Wednesday, Must regain HKEX:29 ,199 as support to resume previous climb.

btc(based on NEo wave) updateits like the ETH analysis. at least I think it will touch 24 zone. make yourself ready for short positions and from here( G wave) as I said I will sell my bitcoins.

$BTC Daily UpdateCRYPTOCAP:BTC #BTC Regained from HKEX:29 ,199 support helping most alts to gain key support. Current 4H struggling to follow thru bullish engulfing from last 4H close, 1D closed good with bullish engulfing, time to see if it will follow up. HKEX:30 ,623 resistance holding.

$BTC Daily UpdateCRYPTOCAP:BTC #BTC Last daily closed bearish, current 4H looking very good with bullish pin bar has 5 mins to close. HKEX:29 ,199 support in effect as of now, HKEX:29 ,483 initial resistance, HKEX:29 ,742 support needed to reattempt at HKEX:31 ,010.

BITCOIN Keep it simple. 1W RSI above 70 = rally!Bitcoin (BTCUSD) on the 1W time-frame is about to see its RSI break above the 70.00 overbought barrier. A simplistic yet reliable historical way of viewing the current situation is that every time the RSI broke above this level, BTC was either starting a mega Parabolic Rally or was in the middle of a smaller rally. On five occasions the rallies were very aggressive, on four there were less, the kind of rallies we see at the start of a Bull Cycle.
What is it going to be this time? Feel free to let us know in the comments section below!
-------------------------------------------------------------------------------
** Please LIKE 👍, FOLLOW ✅, SHARE 🙌 and COMMENT ✍ if you enjoy this idea! Also share your ideas and charts in the comments section below! **
-------------------------------------------------------------------------------
💸💸💸💸💸💸
👇 👇 👇 👇 👇 👇

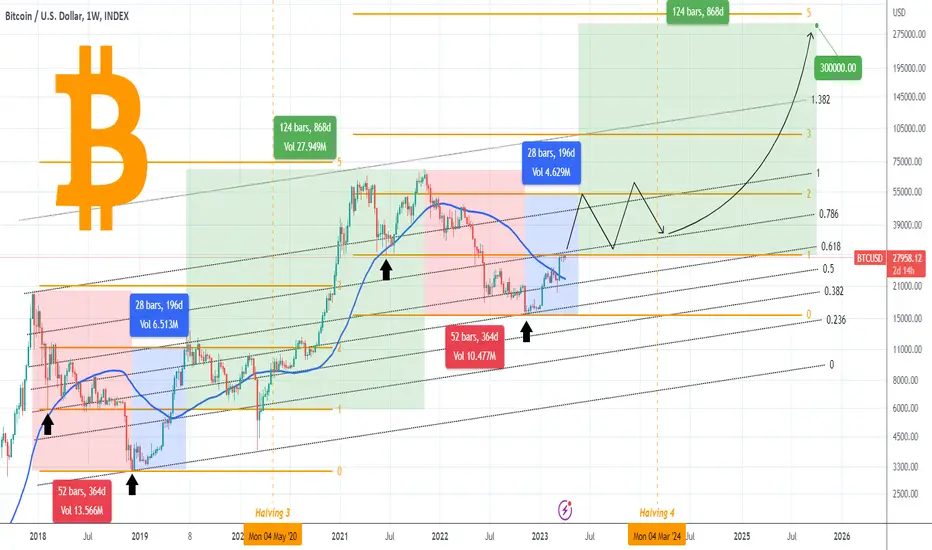
BITCOIN Is 300k the true potential of this Cycle?Bitcoin (BTCUSD) isn't backing down, withstanding to perfection so far any noise in the stock market, a development that establishes that its new Bull Cycle is well underway. Having broken above the 1W MA50 (blue trend-line) and what will most likely be the 4th straight weekly closing above it, we can see that it is testing (and so far struggling to break) the key former Support of the Bear Cycle (Fibonacci 1.0).
The previous Cycle made an aggressive rally to the 2.0 Fib extension after it broke above the Bear Cycle's Support (Fib 1.0) and peaked 28 weeks after the bottom. In an amazing act of symmetry, we see that these last two Bear Cycles lasted for 52 weeks each. Since so far the moves are proportional, we cannot easily dismiss the probability of this '1st Rally Phase' being also 28 weeks and reaching as high as the 2.0 Fib, which is a little over $53k.
Beyond this, a year of basically ranged trading wouldn't be unrealistic, until the Halving 4 event (which is programmed for March 2024) that will inflict a huge supply shock and as it did in May 2020, initiate the final, mega parabolic rally of the Bull Cycle. That part of the previous Cycle, from the time BTC reached the 0.2 Fib until its November 2021 peak, lasted 124 weeks. The peak was achieved a little under the 5.0 Fibonacci extension.
A repeat of makes $300000 by October 2025 a plausible target. Does this reveal Bitcoin's true potential for this Cycle? Feel free to let us know in the comments section below!
-------------------------------------------------------------------------------
** Please LIKE 👍, FOLLOW ✅, SHARE 🙌 and COMMENT ✍ if you enjoy this idea! Also share your ideas and charts in the comments section below! **
-------------------------------------------------------------------------------
💸💸💸💸💸💸
👇 👇 👇 👇 👇 👇
BITCOIN About to wave goodbye to 30k for good if broken?Bitcoin (BTCUSD) is ahead of a critical breakthrough on the 1W time-frame. The former Support of the first half of the Bear Cycle is around 30k and is currently being tested. History has shown that when this level gets tested as a Resistance and breaks during the start of a new Bull Cycle, it never gets retested (cannot count the irregularity of a once in 100 years event like the COVID pandemic in March 2020.
At the same time time, when it breaks the 9°Lower Highs trend-line, the Parabolic Rally starts and doesn't look back. All this while the 1W LMACD is on perfect symmetry with the previous Support tests.
Are we about to wave 'bye bye' to 30k for good? Feel free to let us know in the comments section below!
-------------------------------------------------------------------------------
** Please LIKE 👍, FOLLOW ✅, SHARE 🙌 and COMMENT ✍ if you enjoy this idea! Also share your ideas and charts in the comments section below! **
-------------------------------------------------------------------------------
💸💸💸💸💸💸
👇 👇 👇 👇 👇 👇

BITCOIN Inverse Head & Shoulders gives historic bull runs!Bitcoin (BTCUSD) is in the process of completing a peculiar Inverse Head and Shoulders (IH&S) pattern on a bullish slope. This has historically been extremely bullish for BTC. For reference, we post the most recent such formation (June - August 2021) and the whole 2017 Parabolic Rise which contained 5 similar patterns. The technical target is the 2.0 Fibonacci extension, currently a little over $38000.
Do you think that's BTC's immediate target? Feel free to let us know in the comments section below!
-------------------------------------------------------------------------------
** Please LIKE 👍, FOLLOW ✅, SHARE 🙌 and COMMENT ✍ if you enjoy this idea! Also share your ideas and charts in the comments section below! **
-------------------------------------------------------------------------------
💸💸💸💸💸💸
👇 👇 👇 👇 👇 👇

BITCOIN So much for Resistances...Bitcoin (BTCUSD) broke yet another Resistance level, this time the Lower Lows Pivot trend-line that started from the Lower Lows of the Bear Cycle. When this happened during the previous Cycle in early May 2019, BTC skyrocketed to the next Pivot trend-line (upper dashed) and consolidated there before the next one (dotted). Of course the fundamentals aren't the same, and Bitcoin doesn't have the Libra euphoria to ride but still this technical symmetry is an indication.
Notice also now correlated the LMACD sequences are. Both bottomed around the same (2D tf) level at -0.18 to -0.16 and faced Resistance above the 0.00 mark on the previous Highs. Do you expect Bitcoin to continue rising and hit the next Pivot trend-line around $39000? Feel free to let us know in the comments section below!
-------------------------------------------------------------------------------
** Please LIKE 👍, FOLLOW ✅, SHARE 🙌 and COMMENT ✍ if you enjoy this idea! Also share your ideas and charts in the comments section below! **
-------------------------------------------------------------------------------
💸💸💸💸💸💸
👇 👇 👇 👇 👇 👇

BTC short soon, probably last highI expect this is the last high price before the summer, maybe I'm wrong maybe not. Trade safely and especially use SL, if someone does not know where to set SL, I recommend always under PSAR based on the time window, leverage and/or risk level.
