BITCOIN, Major BROADENING-WEDGE To APPOINT BREAKOUT!Hello,
Welcome to this analysis about Bitcoin and the 4-hour timeframe perspective. In the recent times, important and crucial changes have occurred within the whole market and we can watch here institutional interest is increasing for Bitcoin, furthermore, there are countries such as Mexico looking to adopt Bitcoin as a legal tender, and institutions such as Micheal Saylor with MacroStrategy buying further Bitcoins. These factors indicate a continued increasing positive sentiment moving on for Bitcoin while adoption is still moving on. Nevertheless, it is also necessary to watch for the technical factors and see where Bitcoin is likely to heat within the upcoming times from a short-, middle-, as well as long-term-perspectives. In this case when watching on my chart we can see there that Bitcoin is building this main broadening-wedge-formation with the coherent wave-count within the formation almost already completed with the waves A to C and now as Bitcoin bounced within the lower boundary this is actually building the setup from where Bitcoin has the ability to build upon and continued to setup finally developing a breakout. Once the breakout happened above the upper boundary as marked in my chart this will be the setup from where Bitcoin has potentials to continue with and this will activate the target-zones within the $47,000 level marked in blue in my chart. Once this target-zone has been reached the situation needs to be elevated again and Bitcoin needs to show how it continues from there on and if a possible further formation can lead to a continuation, it will be an interesting development.
In this manner, thank you for watching the analysis, all the best!
"Good fortune is when opportunity meets preparation."
Information provided is only educational and should not be used to take action in the markets.
Btcsignals

Bitcoin 10days Cheat sheethey everyone hope you all are doing good . i am using oscillator this time to find bottom and and i believe we have already made bottom and we could wait until july-august for another final bottom before making new highs . you can see the bottom was found around -14, -18 , -10 , -21 & -15 but final bottom i expect to be near -25 after it we will see new highs but until then i have made a cheat sheet of btc price action which can help you all for intraday levels as we going to consolidate until july. Good luck

DECRED, MASSIVE Volatility, SILVER LINING To 100% POTENTIAL!Hello,
Welcome to this analysis about Decred on the 2-day timeframe perspectives. In recent times the Cryptocurrency Market moved to the south and many Cryptocurrencies developed critical bearish movements. In such phases where the future of the marker looks increasingly uncertain, it is necessary to spot the Cryptocurrencies within the market that are showing up with potential. Therefore in this case there are the anticyclical movers that are developing important formations which can convert into worthwhile setups to move forward with. In this case, I detected that Decred has recently completed the main Descending-Triangle-Formation with a Massive Breakout above the upper boundary and increasing volatility above the boundary as it is seen in my chart. Now that Decred has shown up with such an extraordinary decisive move this completed the whole formation and Decred is setting up to continue in the breakout direction. Also, Decred has this main Ascending-Trend-Line which is a crucial support and also has broken out above the 50- Moving Average which is great support now. With all these factors Decred has a great setup to continue further with and reach out to the target zones as marked in my chart. When Decred also manages to continue with a new formation in this target zone there is the possibility given that Decred continues in the Bullish-Continuation-Zone marked in green, it will be an interesting development.
In this manner, thank you for watching the analysis, all the best!
"There are many roads to prosperity, but one must be taken."
Information provided is only educational and should not be used to take action in the markets.

BTC New Entries + Exits (Best Reverse Strat Ever)The 1on1 video is currently out, if you would like it in order to understand how to play my analysis FULLY, please let me know privately.
All likes/comments and feedback are very much appreciated!
How to play my chart:
Buy at support, sell at resistance. When you open this chart you'll see a green entry and a red entry. When the candlestick hits the green entry, you place a buy. If however that support buy doesn't go into profit and goes negative -35 or -60 pips (depending if it was a fast break/or if the break landed on a minute 15 zone), if it breaks you would then exit your buy and immediately enter the sell. You would then ride that sell down to green TP1, or you could then repeat and play the buy/break there.
The same exact thing goes for resistance sell/break plays!

BTC IS HOVERING AROUND $42k. WHAT SHOULD BE EXPECTED?BTC is presently hovering around $42K. this current level is also about $500 away from FIB23.6 which is an important level.
However, if the bears are strong enough to break through the support zone (FIB23.6), we may see BTC fall further to $40K once again.
Cryptocurrency trading is volatile and anything is possible, the bove is my opinion from my Technical analysis.
KINDLY like, comment, share your opinion, and FOLLOW to support me.

BITCOIN, MASSIVE Channel, Possible FLAG-FORMATION!Hello,
Welcome to this analysis about Bitcoin and the daily timeframe perspectives. In the recent times, important developments happened within the whole Bitcoin and Cryptocurrency Market Interface such as the Bitcoin Lightning Network is being implemented in several important entities, institutional interest in Bitcoin is growing and Elon Musk is looking to buy out all of Twitter which can have a crucial effect on the Bitcoin and Cryptocurrency Market as well. Taking these considerations into the conclusion it needs to be marked that these show a more Bullish Sentiment on a Middle-To-Long-Term-Basis however when considering the more Short-Term as well as the local perspective of Bitcoin it is necessary to also watch out for the technical factors and in this case I detected an important formational structure that can lead to a major decisive outcome for Bitcoin. Therefore I detected the important levels, formational structures, and upcoming determinations.
When looking at my chart we can watch there how Bitcoin has moved on to form this major Ascending-Channel-Formation in which it several times bounced and continued with developing this Wave-Count within the formation with the waves A to D already completed. Now as Bitcoin approaches the lower boundary again this is likely to set up the wave E for this whole wave-count and when it moves into the upper boundary it will complete the whole Wave-Count and from there on show up with a pullback from where Bitcoin has a higher possibility to increase volatility again. In this case, it will be highly important how Bitcoin continues and especially when settling below the lower boundary of the whole formation this will complete the whole channel as a Bear-Flag-Formation and Bitcoin is likely to firstly increase Bearish Volatilites till the lower target zones have been reached which remain within the Descending-Trend-Line as marked in my chart. If Bitcoin manages to bounce in this area this can lead to a potential reversal however when this does not happen it will lead to a continuation if Bitcoin shows up with another such formation. In any case, it is necessary to not underestimate the bearish sights that can show up here and be prepared on potentially increased volatility, it will be a crucial development ahead.
In this manner, thank you for watching the analysis, all the best!
"The high destiny of the market is to explicate, rather than to speculate."
Information provided is only educational and should not be used to take action in the markets.

ETHEREUM, This FORMATION Can Indicate A CRUCIAL CONTINUATION!Hello,
Welcome to this analysis about Ethereum and the daily timeframe perspectives. Since the Cryptocurrency Market recently has shown up with determining increased bearish volatilities the whole market interface has altered and now it will be decisive on how the market moves on further as a whole and especially in which direction it will move on. Therefore Ethereum is an important symbol as it is the second-largest Cryptocurrency within the market and in this case, I detected the pivotal determinations we need to consider here. As when looking at my chart now we can watch there how Ethereum together with these recent bearish declines and the previous price-action has begun to form this major ascending-channel formation in which it has a coherent wave-count with the waves A to C already completed. Now as Ethereum moves on further with the wave D in the structure there is a high likelihood given that Ethereum approaches the main remaining support-cluster within the lower boundary marked in blue in the next times. From there on Ethereum will basically complete the whole wave-count with the wave E moving into the upper boundary again, if Ethereum then pulls back heavily from there on this will lead to continuations and the whole formation will be completed with a breakout below the lower boundary from where Ethereum will activate the lower target-zones showed in my chart, once these zones have been reached the situation needs to be elevated again and Ethereum needs to show in which direction it heads, it will be an important development.
In this manner, thank you for watching the analysis, all the best!
"Good fortune is when opportunity meets preparation."
Information provided is only educational and should not be used to take action in the markets.

BTCVideo Analysis BTC. Possible W2 bottom has formed. W3 can be starting soon. Or 1 more test to $37K.

Bitcoin Supper Bull Market Is coming So Which is Best BuyingZone#BTCUSDT Exclusive HH & HL TA Update :-
Timeframe :- 3D
- BTC is currently trading at $39600 levels.
- In High Time frame ( 3D )
Price is moving in a Bigger Channel forming Higher highs & Higher Lows ( in yellow color )
- Inside the Bigger channel ...
Price is consolidating in a Smaller Channel.
Making higher Highs and Higher Lows ( in white color ).
- If the price breaks $34322 ( White HL )
Then, there will be the beginning of the Bear cycle and More bearishness will be seen in #BTC
- If BTC holds $35000 levels,
Then a target of $50000 as a New Higher High is expected.
- If BTC breaks Mini Channel on Upside then more Bullishness will be seen and Higher Targets of $82500 can be achieved.
- With the continuation of this Bull cycle,
If BTC Breaks the High Time Frame Bull cycle ( Breaks $82500 levels Upside ) then the Super Bull Cycle is expected with much higher Targets ( $150k-$200k )
For Me which Strategy I am Currently Doing ..?
I am Buying in Spot every Dip.
And holding strong with my confirmations.
If Break below $34322 then I will exit in Loss.

BTC GlobalThis analysis uses time cycles and equal proportions:
-sell zone: 1) 73k 2) 125k 3) 200-200k
-bay zone: 1) 20k-23k 2) 11-13k
All price levels are indicated on the chart.
Currently a growing global trend. Priority remains....
This analysis is not an investment recommendation.

BITCOIN holding critical Support so far! Expect +55k if it holdsThis post is an update to the analysis I made 10 days ago:
** 1D MA200 rejection **
The main focus of that was the price breaking a 3 month consolidation pattern and the importance of the 1D MA200 (orange trend-line) as a Resistance. As you see that Resistance held and Bitcoin (BTCUSD) got rejected back to the 4H MA200 (red trend-line), which it tested yesterday, as the first line of Support on the short-term.
This sequence is fairly similar to the start of the rally after Bitcoin's last bottom fractal in late July 2021 within the long-term Channel Up. On the current idea, I've added a few extra levels/ factors, which are important in their own way. Such as the Higher Highs trend-line of the bottom sequence, being a Resistance level on both fractals.
** The Support levels: 4H MA200, 1D MA500 and 0.236 Fib **
As mentioned, the 4H MA200 is the first from a series of Support levels. The 1D MA50 (blue trend-line) is following closely but a key set of levels are the 0.382 and 0.236 Fibonacci retracement levels. The 0.382 was a rejection point in July 31 2021 but this time it marginally broke before rejection. The 0.236 Fib though is roughly where the 1D MA50 is and in 2021 it held upon contact and delivered a strong rebound.
** The 0.618 Fib as the next Target **
The rebound was just above the 0.618 Fib, which is in our opinion the next medium-term Target (roughly above the $55000 mark). Notice also the 1D RSI sequence. The recent High was made roughly around that of the July rejection. If the indicator follows a Channel Down sequence from now on, it would largely confirm that the 2021 fractal is still in play.
So what do you think will happen now? Will the Support Zone of the 4H MA200 - 0.236 band hold or this time we will see lower levels? Feel free to share your work and let me know in the comments section below!
--------------------------------------------------------------------------------------------------------
Please like, subscribe and share your ideas and charts with the community!
--------------------------------------------------------------------------------------------------------

BTC - Final DipMy forecast for BTC is one final dip below 42.5k before proceeding higher. Here are some intermediate-term targets with possible stoploss. As always, wait for confirmation on lower timeframes.

HOLY GRAIL WMA for BTC$$$$$ HOLY GRAIL WMA for BTC $$$$$
WMA200 has acted as a SUPPORT for BTC in MACRO scale.
2015 : WMA200 got RESPECTED twice in January and August.
2018 : WMA200 got RESPECTED in December.
2020 : WMA200 got RESPECTED in March.
2022 : WMA200 at the time of writing is at $20957.32.
Lets come to JUICY part :
In first BULL phase, we saw a 10053.42% profit, that INSANE seriously.
In second BULL phase, we saw a 343.96% profit.
in third BULL phase, we saw a 1153.47% profit (might be OPEN and COUNTING).
For 4th BULL phase, we might see RETRACE first to $20957.32 level which will mark the beginning of PROFIT.
For more accurate level, check BTC Holy Grail Level at $15914.46 yet to be TESTED for INDEX:BTCUSD by cryptopreet — TradingView

LUNAUSDT has formed Divergence LUNAUSDT on 4 hours time frame has formed a raising wedge and also divergence on RSI. After the last breakdown of the mid-term support the price has potential to go down to 0.5 Fibonacci level . After the breakdown of the support we can see that the price was ranging before it continues to go lower.
💎 LUNAUSDT
🔵 Entry zone 112.54 -106.32
🟢 TP1 98.15
🟢 TP2 89.00
🟢 TP3 70.55
🔴 120.92
Good Luck 🎲

WARNING: BITCOIN Bear-Flag Can Determine Fierce Drop To $42,500!Hello,
Welcome to this crucial analysis about Bitcoin and its 2-hour timeframe perspectives. In the last days Bitcoin managed to breakout the pivotal $45,000 resistance with a solid bounce above this level however as for now Bitcoin did not manage to move above the $48,000 resistance and form a new high above this level which is needed to keep the trend going. From there on Bitcoin pulled back and severely tested the $45,000 level again which means the more often Bitcoin tests this level the weaker it gets. Also coming into the interface here is the 200-EMA marked in red in my chart below which Bitcoin previously determined the bearish extension. What forms now in this whole range here is a decisive channel-formation, this channel-formation can complete as a devastating Bear Flag Formation once Bitcoin has settled below the lower boundary of the formation and below the 200-EMA. Such a breakout is likely to move Bitcoin into the $42,500 level from where a possible reversal can be considered. For now it is better to keep patient rather than rushing into a short position as Bitcoin already dropped mainly from its high at $48,000 and especially as a breakout of the flag formation can also lead to a sharp snap back into the range. Therefore it is better to look on how the market evolves here before moving on to further conclusions, it will be an important development ahead.
In this manner, thank you for watching the analysis, all the best!
"The past, like the future, is indefinite and exists only as a spectrum of possibilities."
Information provided is only educational and should not be used to take action in the markets.

BTC can recive to 57K then Dump!!!IN past idea i told you that BTC can recive to 56-57K but its very very very unstable and after do it , BTC will have great DUMP as yet!!!!
be successfull...

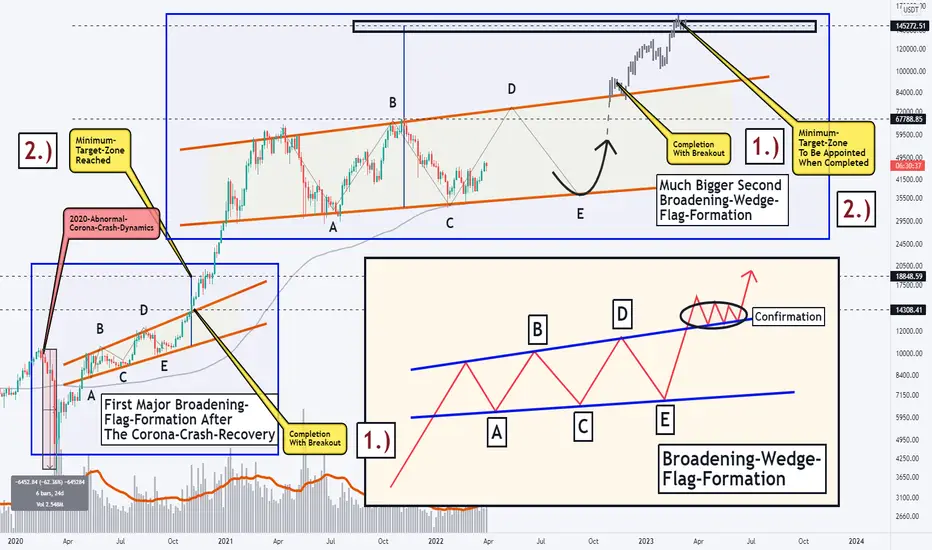
BITCOIN - The FORMATION That Can Lead To A SURGE ABOVE $100,000!Hello,
Welcome to this analysis about Bitcoin on the 4-day timeframe perspective. In recent times Bitcoin is developing crucial determinations from a fundamental as well as technical perspective. As mentioned in my previous analysis of Bitcoin there is a higher possibility given that Bitcoin has the ability to manage to hold above the $35,000 area and to form a reversal formation above this area. In this case now when looking on the more broader global perspective I detected a massive formation that Bitcoin is forming which already formed severely in Bitcoins history. This formation when completed will have a massive impact on Bitcoin's further development. Of course, it is also necessary to consider the fundamental side nevertheless in this case we can also watch positive movements going forward as the technological adoption of Bitcoin is moving forward with Exchanges adopting the Lightning Network, Bitcoin-ETF establishments making progress, and authorities looking to legalize Bitcoin. If there do not come any major disruptions or recession/depression dynamics as we have seen it within the Corona-Crash in 2020 these processes can go further. In this case, I detected the most important structures from a technical view and what to consider in this manner.
As when looking at my chart we can watch there how Bitcoin already once completed this decisive Broadening-Wedge-Flag-Formation which came along after Bitcoin managed to recover from the devastating abnormal Corona-Crash-Dynamics which hit all global markets in May 2020. The Broadening-Wedge-Formation has completed after these critical events and from there on Bitcoin showed up with greatly expanded volatilities. The Broadening-Wedge-Flag-Formation that forms a second time now is having a much bigger scale and completion of this formation will just have a much stronger effect as the formation completed after the Corona-Crash-Dynamics. In this case, there is wave D and E remaining with approaching the upper and lower boundary of the formation before completion can show up. The completion of this paramount formation will activate targets above the $100,000 mark. For now, it will be important how Bitcoin completes this pattern and if it finalizes appropriately Bitcoin is looking into a bright development with the completion of the formation, it will be an interesting development.
In this manner, thank you for watching the analysis, all the best!
"There are many roads to prosperity, but one must be taken."
Information provided is only educational and should not be used to take action in the markets.
BITCOIN, Breakout 200-EMA, MASSIVE Double-Bottom VALIDATED!Hello,
Welcome to this analysis about Bitcoin and the daily timeframe perspectives. In recent times important changes occurred in the whole Cryptocurrency Market Interface and this has been reflected in the Bitcoin Real Price-Action with Bitcoin again establishing a major underlying paradigm-shift to break through key levels within the last establishments. From a Fundamental News Perspective, we have seen important institutional developments such as Exchanges like Binance or Coinbase moving forward with their expansion in the Cryptocurrency field as well as classical economy sectors, we have also seen the CME group launching its Micro-Sized Bitcoin- and Ethereum Options as well as other Countries speculating about the adoption of Bitcoin and Crypto as a legal tender. All these developments showing a fundamental demand still present and in this case I detected the major underlying formational structure to consider now, Bitcoin also showed up with the more likely bullish breakout off the main triangle-formation that I mentioned, if you did not see it already I highly recommend to watch it to have a full-depth-overview.
As when looking at my chart now we can watch there how Bitcoin greatly formed the breakout above the 200-EMA resistance, the 200-EMA in this whole development is a highly crucial EMA because it served as support- and resistance several times in Bitcoins developed price-actions. Now Bitcoin managed to heavily breakout above this EMA also matching with the main $44,300 resistance determined by the neckline of Bitcoins massive double bottom formation. The fact that Bitcoin now exploded above this critical intersection-point has confirmed the completion of the whole double bottom formation as seen in my chart and activated the target zone. In the near future a validation formation above the neckline is likely from where Bitcoin will have the abilities to build upon and continue to the target-zones in the $52,500 level seen in my chart. Once Bitcoin will have reached out to these zones it will be determining on how Bitcoin continues from there and if Bitcoin manages to move forward with a continuation formation or firstly pulls back, if Bitcoin then finally manages to breakout above the $52,500 level this will lead to the continuation within the Bullish-Paradigm-Continuation-Zone, it will be an interesting development ahead.
In this manner, thank you for watching the analysis, all the best!
"Good fortune is when opportunity meets preparation."
Information provided is only educational and should not be used to take action in the markets.

BTCUSDT Can go higher after the retracement 💎 BTCUSDT after breaking above the channel has been consolidating. There is a possibility for a retracement before it continues to go higher.
🎳 Entry zone 46543.00 -47218.00
☕️ TP1 47596.00
🍺 TP2 48655.00
🍻 TP3 49497.00
🚫 SL 45120.00
Good Luck 🎲

BITCOIN puts the conditions of previous market bottoms to testBitcoin is yet again approaching the Resistance under which it's been trading since January 05. Practically the whole year so far has been a consolidation within a Triangle pattern, which technically resembles accumulation phases of the past. More specifically, those accumulation phases are seen in market bottom structures and in this analysis I quickly present the two most recent: the March/ April 2020 (following the COVID meltdown) and the December 2018 - March 2019 (following the bottom of the 2018 Bear Cycle).
As you see, the similarities between the three are so far remarkable. All three Triangles show an ascending 1D RSI reading. The 2020 and 2019 ones both formed a 1D Golden Cross, after the price broke above the Triangle's Resistance and the 1D MA200 (orange trend-line). Before doing the Resistance break-out, the 1D MA50 (blue trend-line) had turned into a Support.
Right now, the 2022 sequence, is very close to its Triangle's Resistance and the 1D MA50 has turned into a Support for the past 10 days. The 1D MA50 and MA200 are again converging and this may be an early sign that the Golden Cross will be formed within 3 - 4 weeks, which as per the previous bottom fractals, will be well above the Triangle. As a result, breaking the Resistance is the ultimate market bottom buy signal.
Do you think that if it breaks, while the 1D MA50 is supporting, we'll have already priced the new market bottom? Feel free to share your work and let me know in the comments section below!
--------------------------------------------------------------------------------------------------------
** Please support this idea with your likes and comments, it is the best way to keep it relevant and support me. **
--------------------------------------------------------------------------------------------------------

Bitcoin Breaking above the Range Zone?Bitcoin has been ranging in the highlighted zone since January this year. Could this break above this to the next target? Should we expect 50K next month?
Read more:
thecryptoread.com
BTC/USDT 4HOUR UPDATE BY CRYPTOSANDERSWelcome to this quick BTC /USDT analysis.
Hello members, welcome to BTC 4 hour update by CRYPTOSANDERS.
If you have gone through with our yesterday's BTC chart then you will remember, in that chart we mentioned that BTC is looking bullish in long term.
In the current scenario, btc bounced from the upper trend line or the green zone.
Till now btc moved up very well and btc.d also showing confirmation that we can see this uptrend for more upcoming days.
Sorry for my English it is not my native language.
This is not a piece of financial advice.
Thank you.

BITCOIN Perhaps the most critical week of allWe are seeing Bitcoin recovering since last week and so far into the current, we sit on the 2nd straight green 1W candle. This is perhaps the most important week that may show if BTC will restart the long-term bullish trend, or will dip and make a new bottom much lower that the 2022 low.
The key here is the 1W MA50 (blue trend-line), which will most likely be tested by the end of this week. The price has failed to close a 1W candle above it, for 12 straight weeks. It is obvious that a break above the 1W MA50 will be a major buy signal.
What may be even more important that this, is the 1W RSI, which is forming a pattern that was previously seen in the bottom sequences of December 2018 - January 2019, November 2019 - December 2019 and May 2021 - July 2021. A common feature on all of those sequences is that the break-out came with the LMACD making a Bullish Cross, while at the same time the price broke above the consolidation's Resistance.
Right now Bitcoin is very close to the LMACD Bullish Cross, while the RSI is on Higher Highs and is starting to break to the upside. The consolidation's (bottom sequence) Resistance is just below the 46k mark. Coincidentally, this is exactly where the 1W MA50 currently is. Has the time finally come for BTC to break above it? Feel free to share your work and let me know in the comments section below!
--------------------------------------------------------------------------------------------------------
Please like, subscribe and share your ideas and charts with the community!
--------------------------------------------------------------------------------------------------------
