BTCJust something I think is pretty cool. I ran a pitch fan from the highs of 2017 to the lows 3/2020 back to the highs in 2021 and the results are interesting. The middle TL has remained strong support after multiple tests over last 1 year. Also the fan seem perfectly symmetrical.
Loose the middle TL and targets shown below. 200 weekly ema $26K and lower green band support shown around $12k.
Maintain the middle support price zone around $34K and we head north to test upper green band around $57K & tops around $85K.
Break out of the fan and go parabolic.
Btcsignals

BTCUSD sell ONCE againHi fellow traders, BTCUSD is still not ready. Try to sell again from this area and target S3. Goodluck!
#BTC/USD LONG TIME FRAME 3DAY UPDATE BY CRYPTOSANDERS Welcome to this quick BTC/USD analysis.
BTC 3Day Update BTC trend line is moving up and the falling wedge pattern creates a current price of $38300k.
#btc/usdt long best entry $32800k $34500k
stoploss is $28600k
BTC trade line is trading and the same is visible in the RSI
BTC 3 day update. We were watching that moment. In RSI also we can see that the trend line is moving up and once it crosses above the trend and the market dumps and then the market falls down but once again market can bounce in btc or if This is going to be bullish so BTC could jump from here.
This is not a piece of financial advice.
Sorry for my English it is not my native language.
Do hit the like button if you like it and share your charts in the comments section.
thank you.

BITCOIN, MASSIVE Triangle-Formation, MAIN POSSIBILITIES!Hello,
Welcome to this analysis about Bitcoin and the daily timeframe perspectives. Bitcoin in recent times has moved into a pivotal determination zone from where further developments will show its upcoming destinies. In this case, we need to see the changing dynamics in Bitcoins fundamental landscape as on the one side technological developments are moving forward while new regulatory movements are set in the such as the U.S. as well as the E.U. implementing a regulatory framework that is looking for several diverging developments to be implemented in Bitcoin and Cryptocurrency as an asset-class. On a more Long-Term-Perspective these establishments are likely to have an increased positive impact as Bitcoin and Cryptocurrency are becoming increasingly mainstream however on the more Middle-Term-Perspectives it is also of high importance to look at the technical factors as well. Therefore I detected the major formation Bitcoin is forming here and what we can derive from it for the upcoming destinies.
Determining Developments:
As when looking at my chart now we can watch there how Bitcoin moved into a huge range between 33.000 and 46.000 USD level, these two levels are the momentous boundaries in this whole range. Besides that Bitcoin is now building this paramount triangle formation where the lower boundary is steeper than the upper boundary. Within this triangle formation Bitcoin has the coherent wave-count with the waves A to C almost completed and now we can see that Bitcoin is setting up to form the wave D and the wave E. In the upcoming times, with the completion of the wave count, it is likely that the wave E finalizes within the main Decision-Zone marked in my chart in orange, from this level the final decisive movements will setup and Bitcoin will either conclude scenario A with breaking out above the Upper-Boundary as seen in my chart or the scenario B with breaking out below the lower boundary and also below the Decision-Zone.
Upcoming Destinies:
Taking all these factors into the consideration now it will be highly pivotal to await the final confirmations before moving to further conclusions. Nevertheless, as the factors are showing us now the bullish scenario A has with 65% a higher possibility to emerge than the bearish scenario with a possibility of 35%. This is given due to the fact that Bitcoin still has substantial support within the Point-Of-Control marked with the red line in my chart and also by past price action. Therefore when the scenario finalizes it will activate the upper Target-Zone as shown in my chart between the 50.700 and the 52.200 USD level. The objected possibilities can also change if Bitcoin shows up with increased bearish pressure and volume while completing the wave-count and in this case when Bitcoin does so and scenario B gets more likely the range between 29.700 and 30.200 USD will be activated as the Target-Zone if Bitcoin should complete the Triangle into this direction.
In this manner, thank you for watching the analysis, all the best!
"There are many roads to prosperity, but one must be taken."
Information provided is only educational and should not be used to take action in the markets.

BITCOIN Ultimate historic Fibonacci extensions cheat-sheetOn this analysis I am taking Bitcoin's price action since it first started trading. I've used the Fibonacci Channel extensions to identify any possible correlations with how its Logarithmic Growth curve (the parabola that fuels BTC's growth on each Cycle) is shaped over the years.
I've made several publications on why the +.382 Fibonacci extension roughly calculates the Highs. I've plotted that on this chart again and as you see so far the 2.382 Fibonacci extension has roughly predicted the December 2013 High while the 3.382 extension, the December 2017 High. The 4.383 Fib extension roughly sits at $350k.
But let's circle back to how the Fibonacci Channel extensions can relate to these patterns. As you see, the first two Cycle Highs have been (naturally for the first) on the 0.0 Fib with bottoms outside of the 0.5 Fib. The High of the next Cycle was on the 0.5 Fib with the Low outside of the 1.0 Fib. The High of April 2021 was outside of Fib 1.0 and the current Low of 2022 exactly on the 1.5 Fibonacci extension of the Channel.
This pattern, though not perfect, it shapes fairly well Bitcoin's parabolic path over the years. Based on that, the next High should be either on or on the left of Fibonacci Channel extension 1.5 and the Low either on or left of extension 2.0. Regarding the High that projection fits well with the 4.382 horizontal Fib extension of $350000 and could be achieved by the end of 2023.
Is this a wild projection to make? What do you think? Can those Fibonacci Channel extension identify the logarithmic path of Bitcoin and if so is $350k a reasonable estimate? Feel free to share your work and let me know in the comments section below!
--------------------------------------------------------------------------------------------------------
Please like, subscribe and share your ideas and charts with the community!
--------------------------------------------------------------------------------------------------------

BITCOIN Is this Triangle a bottom formation?Another fractal analysis on Bitcoin. This time I compare today's price action on the 1D time-frame versus the February - April 2020 price action on the 12H time-frame. The reason for the difference between time-frames is the rate of variability. Due to the COVID flash crash of March 2020 and the equally fast and impressive recovery of the global markets due to the enormous money printing in the form of economic rescue packages, things evolved much faster in 2020.
As you see, both in RSI terms and other indicators (MA50, MA200, Golden and Death Crosses), the two fractals are very similar. If we ignore the irregularity of the 1 week meltdown in mid-March, the 2020 Triangle was a market bottom formation. The market accumulated after the economic reassurances by the Fed and U.S. government in the form of this Triangle and after a break above the MA50 (blue trend-line), BTC broke above the Lower Highs (top) of the pattern. After it re-tested the top and the MA50 as a Support and held, the Ichimoku Cloud turned green and then entered an aggressive multi-month parabolic rally, which never looked back.
Right now Bitcoin is still (accumulating?) within the Triangle, around the 1D MA50, but with the Ichimoku Cloud just turning green. Do you think this is a sign of bottoming? Will a break above the Triangle set in motion a rally similar to April-May 2020? Feel free to share your work and let me know in the comments section below!
--------------------------------------------------------------------------------------------------------
Please like, subscribe and share your ideas and charts with the community!
--------------------------------------------------------------------------------------------------------

BITCOIN Ascending Triangle and break-out targetsBitcoin has completed 2 months of side-ways consolidation and as this chart on the 1D time-frame shows, it has done so within an Ascending Triangle pattern. Its last top came with a rejection on the 1D MA100 (green trend-line), which is quite important but if this manages to break soon on the next Resistance test, then most likely the Triangle will break to the upside. Note that as long as the 1D CCI is within its neutral zone, most likely trading will be sustained within the Triangle.
A break of the Triangle to the upside, still has to overcome the 1D MA200 (orange trend-line) which is the final barrier of turning bullish on the long-term, but technically the Fibonacci extensions will come into play: 1.5 at 50880, 2.0 at 56370 2.5 at 61850 and 3.0 at 67350. Notice that all of them match fairly well with previous Lower Highs during the down-trend. Similarly, a break of the Triangle to the downside, could target the -0.5 Fib at 28900 and -1.0 Fib extensions at 23450.
So which way do you think this Ascending Triangle will break to and how high/ low can it get? Feel free to share your work and let me know in the comments section below!
--------------------------------------------------------------------------------------------------------
Please like, subscribe and share your ideas and charts with the community!
--------------------------------------------------------------------------------------------------------

I Told BTC go to under 35K !!!In past Idea i told that BTC go to under 35K but not recive to 34K ! between 18 to 26 Mar...
After do it BTC has a goooood PUMP to 56K

BITCOIN Consolidation until the 1D MA200 breaks.Weekend fractal fun time for Bitcoin fans. Will keep it as short as possible.
On the left we have BTC on the 1D time-frame today and on the right BTC on the 6H time-frame in July - September 2021. Not exact copies of each other, but with striking similarities nonetheless, especially on the CCI indicator.
In 2021, a break above the MA200 (orange trend-line), was enough to initiate the massive end-of-the-year rally. Can a break above the 1D MA200 this time kick-start a similar one? Feel free to share your work and let me know in the comments section below!
--------------------------------------------------------------------------------------------------------
Please like, subscribe and share your ideas and charts with the community!
--------------------------------------------------------------------------------------------------------

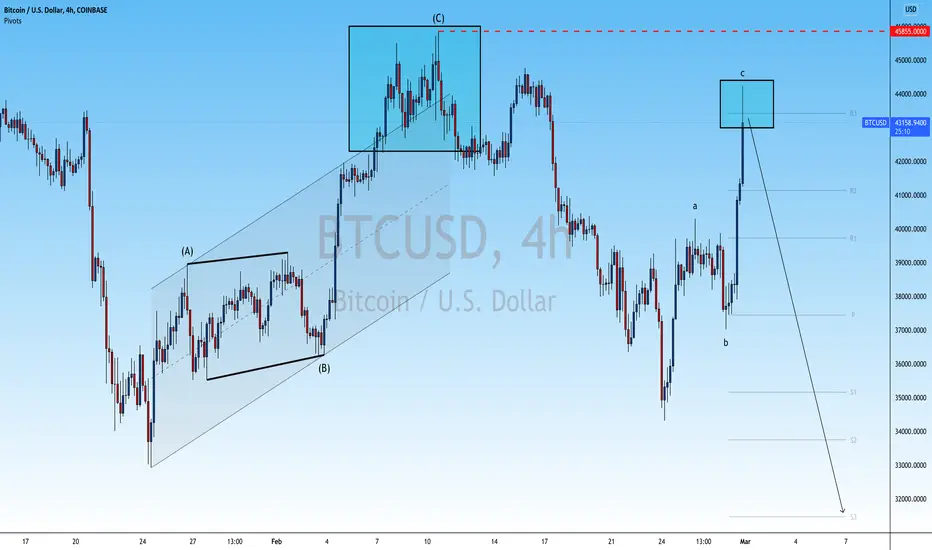
BITCOIN, Ability Present To Complete Pivotal Triangle-Formation!Hi Community,
Since Bitcoin in recent times increased with bullish volatility and initially pulled back to test previous ranges it is forming an interesting formational structure here that is likely to be worthwhile for the incoming price-action-events. Mainly we can watch an increased demand coming into Bitcoin and the whole Cryptocurrency market as geopolitical events paired with Inflation point to people increasing their trust in Bitcoin and Cryptocurrency, we can see this manifested in real volume and trading activity which increased over recent times. Also from a technological-adoption- and mainstream-adoption- perspective there is an acceleration of adoption moving forward, such as Mexico as the second official country after El Salvador considers making Bitcoin a legal tender. Besides that eBay as a main established e-commerce platform is looking to adopt Bitcoin and Cryptocurrency as a payment method. These developments are positive indications for a long-term bullish perspective and are likely to contribute as such if there are no regulatory, restrictionary, economic, technological or environmental events that can alter this bullish long-term sentiment again, as Traders it is necessary to consider these determinations to have a rounded approach to the market.
Looking at my chart now we can watch there how Bitcoin is forming a central formation here which is a descending-triangle-formation, such a descending-triangle-formation is an efficient indication for concluding a reversal when the right price-action settles. Therefore as Bitcoin already completed the coherent wave-count reaching from A to C within the formation and is now approaching the lower boundary of the formation in which it has appropriate support determined by the lower boundary of Bitcoins main ascending-channel together with the 300-EMA marked in blue, there is a solid potential given that Bitcoin has the ability to form the decisive bounce above the upper-boundary of the formation in this range. Once such a bounce has emerged it will be the technical confirmation and completion of the descending-triangle-formation and it will point to the final setup from where Bitcoin has the right fundament to build upon, besides that this will also validate the target-zones seen in my chart. Once the target-zone of 44.500 USD has been reached Bitcoin has to show how it moves into this zone and if Bitcoin manages to form a continuation-formation in this area because when this happens Bitcoin has the potential for forming a wave-C-extension when it manages to breakout into the bullish-continuation-zone.
In this manner, thank you for watching the analysis, all the best!
"The day of fortune is like a harvest day, We must be present when the corn is ripe."
Information provided is only educational and should not be used to take action in the markets.

Will Bitcoin Rise?: Mexico is Going to Accept Bitcoin.Bitcoin is losing its value one more time. Today bitcoin lost its value more than 5% than yesterday, and it has been dropping eight days in a row.
I have said many times that cryptos are not safe-haven at all and won't the safe-haven assets in the future for many reasons. However, BTC mainly follows the USD when a crisis exists.
The total capitalization of the crypto market, according to CoinMarketCap, decreased by 10% over the day, to $1.40 trillion. That isn't good, but there is good news comes also. Mexico is Going to Accept Bitcoin. So, it may find some support from this news.
At the moment, we see that cryptocurrencies are selling stronger than developed world stocks (although not as extreme as Russian ones), confirming the risky nature of these assets and how they are not a replacement for gold.
Now another country besides El Salvador may accept bitcoin as a means of payment. Senator Indira Kempis is developing a bill on cryptocurrencies and intends to convince the Mexican government to follow the "Salvadorian scenario" by recognizing BTC as a means of payment.
So, We have some good reason to invest in BTC, and it may pull back to the upside by this news.
BTC is currently testing its minor trendline support zone of $34500. And BTC s strong support is at $30000.
So, as long as BTC is above $30000, there is hope that BTC has chances to go upside again.
BTC Buy ZOne: 34500/32000 ( Trendline Support Zone)
Stop-loss should be below $30000 ( Strong Support Zone and BTC prices retraced many times from the support zone)
!st target to the upside is $45000.
So, keep watching and always connect with me by liking, commenting, and sharing.

BITCOIN, Massive POTENTIAL For DOUBLE-BOTTOM To VALIDATE!Hello,
Welcome to this analysis about Bitcoin and the 12-hour timeframe perspectives. In recent times Bitcoin managed to complete the main broadening-wedge-bottoming-formation and already reach out the further target-zones, if you did not see this analysis already I highly recommend it to watch and because of this I am linking the analysis in this idea. Besides that Bitcoin now recently managed to setup on the upper boundary of the broadening-wedge-bottoming-formation and bounce from this boundary as also seen in the analysis. Now as Bitcoin moved on with these great volatility determinations I detected further important determinations that Bitcoin is forming here, therefore I am explicating the crucial structural formations, upcoming determinations and what are potentials in the upcoming times.
Bitcoin Major Double-Bottom-Formation And Its Potentials:
As shown in my chart Bitcoin now recently increased with these huge volatility spikes and moved above the main descending-resistance-line marked in black which is now important support, besides that Bitcoin has pivotal supports in this area together with the 20-EMA and 100-EMA marked in my chart. What is important here is to look on where Bitcoin came from and as shown in my chart this is a great initial double bottom formation with the first and second bottom completed from where it showed up with great volatilities. Now Bitcoin moved on to test the main neckline-range again and there is a higher possibility given here that Bitcoin from here on firstly pulls back to approach the remaining main support-zone marked in orange in my chart where several supports are coming together. If this support can be hold it will be the appropriate origin for a final completion of the double bottom formation.
Upcoming Determinations, Completion Of The Formation And Target Projection:
Taking all these factors into consideration it will be highly pivotal how Bitcoin approaches the supports also matching with the point of control where Bitcoin has the most volume by price shown in my chart in the red line. When Bitcoin manages to bounce in these zones and finally mark above the neckline range this will be the completion of this whole double bottom formation and Bitcoin will have the ability to move on further from there as well as activate the target zone which is as marked in my chart within the 54.000 to 56.500 USD. As Bitcoin has also lesser volume on the way to these targets this gives and additional indication that the targets are to be reached. Once these determinations have been fulfilled Bitcoin has to show how it moves on further from there, for now we need to keep patient and await the final validations before considering further conclusions, it will be a interesting development ahead.
In this manner, thank you for watching the analysis, all the best!
"Good fortune is when opportunity meets preparation."
Information provided is only educational and should not be used to take action in the markets.

BITCOIN closed 1st green month after 3straight red! Buy or sell?So Bitcoin closed yesterday its 1st green month after a series of 3 red monthly closings since the November All Time High (ATH). Is this bullish or bearish on the long-term? One way to answer this is to see how the price moved after a similar monthly pattern.
This chart is obviously on the 1M time-frame with the blue trend-line being the 1M MA50 but with the red being the MA50on a different time-frame, the 1W. To have a larger sample, I've included the cases where a green 1M candle appeared after 3 or more straight red. Other than the current, these parameters return 7 other such patterns:
* The most recent being the July 2021 1M green candle, which formed after 3 straight red. The price made a new High after that with the 1W MA50 supporting.
* The October 2019 1M green candle was also formed after 3 straight red. The price made a new Low after that as the 1W MA50 failed to support.
* The February 2019 1M green candle was formed after 6 straight red. This was slightly after the bottom of the 2019 Bear Cycle and the price made a new High, effectively kickstarting the start of the new Bull Cycle with the 1M MA50 (blue trend-line) supporting.
* The June 2015 1M green candle was formed after 3 straight red. This was also slightly after the bottom of the 2014/15 Bear Cycle and the price made a new High, effectively kickstarting next Bull Cycle with the 1M MA50 (blue trend-line) supporting.
* The November 2014 1M green candle was formed after 4 straight red. The price made a new Low after that as it failed to break above the 1W MA50.
* The May 2014 1M green candle was formed after 3 straight red. The price made a new Low after that as the 1W MA50 failed to support.
* Finally, the December 2011 1M green candle was formed after 5 straight red. This was slightly after the bottom of the 2011 Bear Cycle and the price made a new High, effectively kickstarting the start of the new Bull Cycle, which came after BTC broke above the 1W MA50. Check this series on the snapshot below, if you don't want to scroll the main chart to the left:
So as you can calculate based on the sample above, historically when a green 1M candle has formed after 3 or more straight red, BTCUSD moved on to a new High more times (4) than a new Low (3). The key here seems to be the 1W MA50 (red trend-line), which every time it broke to the upside after such a pattern, it always delivered a new High (3 times) relative to when the red streak started. Basically all of those 3 times it did, Bitcoin had just priced the bottom of a Bear Cycle and was at the start of a Bull Cycle. I've included the 1M RSI indicator on this chart to show that, based on this, with it being on Lower Highs and currently below its (RSI based) MA (yellow trend-line), the price action since the April 2021 High looks more like a Bear Cycle. That is a subject I've touched in more detail in previous analyses of mine, one of which you can find below.
So how do you think BTC will trade following this 1st green monthly candle after 3 straight red? Is this buy or sell signal? Feel free to share your work and let me know in the comments section below!
--------------------------------------------------------------------------------------------------------
Please like, subscribe and share your ideas and charts with the community!
--------------------------------------------------------------------------------------------------------

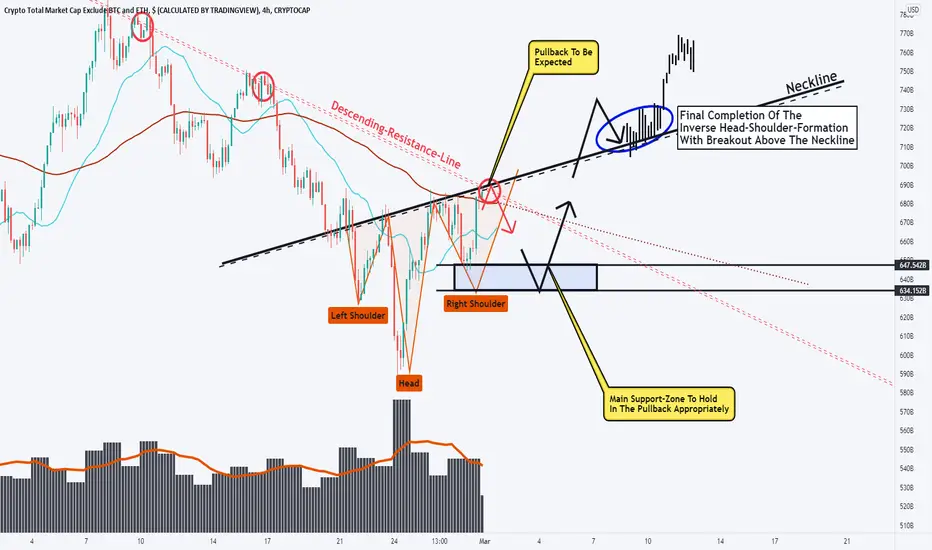
TOTAL CRYPTO-CAP, Major H-S-Formation, Steps To Completion!Hello,
Welcome to this analysis about the Total Cryptocurrency Market-Cap on the 4-hour timeframe perspectives. As I detected the total crypto-cap is forming crucial determinations and as when looking at my chart we can watch there how a main inverse head-shoulder-formation has the ability to complete for the total crypto-cap. Currently the total crypto-cap is testing the neckline which means there is a high possibility given that the total crypto-cap pulls back from the neckline as seen in my chart. When this establishes the pullback will move on till the support zone as shown in my chart is reached, this is a very important support zone because the total crypto-cap needs to hold it and bounce in order to complete the whole inverse head-shoulder-formation. When the total crypto-cap manages to bounce and finally move above the neckline as shown in my chart this will complete the whole formation and the total crypto-cap will move on further, it will be an important determination ahead.
In this manner, thank you for watching the analysis, all the best!
"There are many roads to prosperity, but one must be taken."
Information provided is only educational and should not be used to take action in the markets.
BTC can recive to 56KBtc have good potential for grows and can recive to 56.7K But !!! BTC Whales Ready to shooot BTC to 28K...
Its absolutely...

BTC Updated ZonesThe 1on1 video is currently out, if you would like it in order to understand how to play my analysis FULLY, please let me know privately.
All likes/comments and feedback are very much appreciated!
How to play my chart:
Buy at support, sell at resistance. When you open this chart you'll see a green entry and a red entry. When the candlestick hits the green entry, you place a buy. If however that support buy doesn't go into profit and goes negative -35 or -60 pips (depending if it was a fast break/or if the break landed on a minute 15 zone), if it breaks you would then exit your buy and immediately enter the sell. You would then ride that sell down to green TP1, or you could then repeat and play the buy/break there.
The same exact thing goes for resistance sell/break plays!

ETHEREUM, Massive FORMATION Likely To SHIFT DYNAMICS!Hello,
Welcome to this analysis about Ethereum on the 4-day timeframe perspectives. In recent times the Cryptocurrency Market Space has moved into important watershed moments in which we need to determine the appropriate destinies with the given indications and prospects. There is an increasing regulatory eagerness that is projected onto the Cryptocurrency market while it seems that there are building two parties, those who want stronger regulation of Cryptocurrency and even seize it much more as it is seen till now while there are those who want to support the Bitcoin continuation of technological development and are positively directed towards Bitcoin adoption and legal tender developments as we recently see with for example Mexican senators considering a legal tender adoption like it has been seen in El Salvador while there are other countries considering this fundamental step as well. In this mixed signals environment, it is highly necessary to also consider the technical factors to come up with a realistic perspective on where the market is heading.
As when looking at my chart now we can watch there how Ethereum is building this massive ascending-triangle-formation with the coherent wave-count within the formation and the waves A to D almost already completed. Now as seen in my chart, the fact that Ethereum manages to initially bounce within the lower boundary and mark the 150-EMA together with the lower boundary as an important support zone increases the likelihood that the wave E emerges from this point on which will complete the whole wave-count and move into the upper boundary of the whole ascending triangle formation from where a pullback is highly likely as the wave count will be completed and Ethereum has massive resistance in this zone. Once these pullbacks are settled and Ethereum heavily increases with bearish volatility this will complete the whole formation with a breakout below the lower boundary and a continuation is likely to take place. Taking all these factors into the consideration here it is highly urgent to in any case do not underestimate the bearish scenarios that are set up here, in this determination it is pivotal that we are prepared for these scenarios to do not get overwhelmed when they emerge. It does not mean Ethereum has no bullish potential on more long-term perspectives from a fundamental standpoint however technically we need to appropriately measure the signals in the right manner, therefore it will be an important and decisive development ahead.
In this manner, thank you for watching the analysis, all the best!
"Genius is eternal patience."
Information provided is only educational and should not be used to take action in the markets.

BTC/USDT 1HOUR UPDATE BY CRYPTOSANDERSWelcome to this quick BTC /USDT analysis.
I have tried my best to bring the best possible outcome in this chart
Hello friends
BTC USDT 1 Hour Update BTC Is Doing Inverse Head And Shoulders Pattern And I Think BTC Is Dumped Once More A Power To $36000k Or $36500k
Thanks for connecting with us stay tuned like comment and share to get the latest updates
Sorry for my English it is not my native language.
thank you.

BITCOIN, CRUCIAL FORMATION Can Be Catalyst For NEXT IMPULSE!Hello Cryptocurrency Community,
Welcome to this pivotal crucial Bitcoin analysis about the 12-hour timeframe perspectives, the recent events, the current formational structure, and what we should expect in the upcoming times. The main potential inverse head-shoulder-formation that I mentioned in my previous analysis has now been invalidated to the downside and activated scenario 2 for Bitcoin, if you did not see this analysis already I highly recommend watching it as this analysis is coherently building upon it. Therefore as Bitcoin now invalidated this bearish scenario due to the volatility that recently increased the paradigm has shifted and in this case, I detected important formational factors that are important to take into account right now.
Structural Formation And Incoming Determinations:
Looking at my chart we can watch there how Bitcoin since recently increased with bearish volatilities has moved into the crucial 34.400 USD support marked in my chart in blue and has now tested this support, this support was already tested previously and the more often Bitcoin tests this support the weaker it gets. Nevertheless currently on the more local timeframes Bitcoin is also building this broadening-wedge-formation that I will link here, when this formation completes Bitcoin has the ability to breakout and initially move into the remaining resistances where Bitcoin has strong resistances within the 38.600 to 40.000 USD area that is marked in my chart in red, therefore, when Bitcoin reaches out there it will be a highly likely origin of a bearish pullback to the downside.
Upcoming Destinies To Consider:
Taking all these factors into the consideration now when Bitcoin pulls back off the massive bearish-resistance-cluster as marked in my chart this is just one step forward for completing the huge massive bearish indicated descending-triangle-formation that Bitcoin forms here marked in my chart with the coherent wave-count within which will complete when Bitcoin finalizes the wave-E in the triangle and once this happened with Bitcoin breaking below the lower boundary it will activate the bearish continuations and Bitcoin reaching out lower levels, therefore, the 24.500 USD zone as marked in my chart will be a likely target to be reached once this whole formation has been completed, therefore it is highly necessary that we keep patient and prepare on such increased volatilities upcoming.
Local Broadening-Wedge-Formation With The Resistance-Pullback-Scenario Indicated:
In this manner, thank you for watching the analysis, all the best!
"The high destiny of the market is to explicate, rather than to speculate."
Information provided is only educational and should not be used to take action in the markets.

1:81:8 RR on BTC
.
Black lines are where you can Take Profit
.
This is Not Financial Advice, JUST AN OPINION OF THE ONION.

Almost therelet's catch those onion pips
.
.
This is Not Financial Advice, JUST AN OPINION OF THE ONION.

Bitcoin Prediction: Future Of Bitcoin: Is BTC In Trouble?Bitcoin Prediction: The Future Of Bitcoin:
Is Bitcoin (BTC) In Trouble? No!
Situations across the globe ( rumours of wars, politics, frenemies of crypto) might be taking a toll on BTC but you can be rest assured: he who laugh last, laugh best!
These 3 scenarioos indicated in my chart could play out pretty well - I can almost guarantee it? but Naaah! what do I know? :)
Follow the curves - do your own due diligence, trade safe. Happy trading y'all

BITCOIN, On The Verge To A MASSIVE PARADIGM-SHIFT, 2 SCENARIOS!Hello Cryptocurrency Community,
Welcome to this crucial analysis about Bitcoin, this time on the daily timeframe perspectives. Since Bitcoin, as expected showed up with the completion of the local bear-flag-formation that I mentioned in my previous analysis ideas Bitcoin moved on to reach all our projected target zones and continued to increase bearish volatilities as expected. If you did not see these analysis I highly recommend it to watch to have a full-depth-overview about the current situation as this analysis is building a coherent follow up about the market situation. In recent times there happened pivotal developments not only from a technical but also from a fundamental perspective that are likely to affect the Bitcoin and Cryptocurrency dynamics in the upcoming destinies, therefore I am looking at the pivotal factors and determinations we need to consider here.
Fundamental Determinations And Indications:
From a fundamental perspective, it is necessary to realize that the world and also the economy is in a transition phase, since the global pandemic hit all global markets and the economy back in May 2020 many countries needed to heavily adjust to this changing order and in this case nearly all economies suffered because of the dynamics that went along with the pandemic. Now the world economies slowly regain however there is increased inflation going on which means that there is a higher possibility that fiat money flows into financial markets and investors seeking for a hedge for example with Bitcoin, this can be a bullish sentiment indication on the long term. Nevertheless, if the Inflation heavily accelerates together with the FED actually increasing the interest rates and decreasing their currently approximately 8.9 Trillion USD large balance sheet this will provide a bearish sentiment, these are important indications to consider in next times.
Technical Developments And Two Main Scenarios To Consider:
Taking these fundamentals into the account we can now examine the technicals and as when looking at my chart we can watch there that Bitcoin since completing the local bearish flag formation is contributing to a formation on a broader scale which is actually a potential inverse head-shoulder-formation, the reason why it is a potential h-s-formation yet is that it still can invalidate if Bitcoin does not hold the 36.440 USD level marked in blue in my chart. Therefore there are two main scenarios given here, the first one comes around when Bitcoin manages to complete the inverse head-shoulder-formation with a breakout above the neckline as seen in my chart and the second scenario will show up when Bitcoin actually breaks down the 36.440 USD level, in this case the next target will be the 30.000 USD level and when this level does not hold Bitcoin will likely complete the whole massive double-top formation bearishly to the downside that I already mentioned in my TradingView as well as YouTube.
Bitcoins Upcoming Destinies And Pivotal Confirmations:
Taking all these factors into the consideration now this formation will be a huge factor to decide Bitcoins destinies in the next times, especially with the fundamentals changing more into the bearish direction this can lead to a devastating completion of the double-top otherwise when Bitcoin does hold this structure and actually completes the main inverse head-shoulder-formation this does not mean Bitcoin is completely out of the woods though as Bitcoin needs to firstly show how it can hold the range and build up on it after reaching out the target-zones. Therefore it will be highly important now to keep patient and wait for the appropriate confirmations rather than to rush into the market with over-speculation as it is seen too often these days. The main confirmations for Bitcoin will show up in the near future and they will indicate if Bitcoin has bearish or bullish destinies, it will be an important dynamic ahead.
In this manner, thank you for watching the analysis, all the best!
"There are many roads to prosperity, but one must be taken."
Information provided is only educational and should not be used to take action in the markets.
