GRTUSDT Has Broken Above the Resistance
Welcome back Traders, Investors, and Community!
Hi Traders, GRTUSDT on H4 has broken above the Flag it’s expected to go higher to the Resistance.
⬆️Buy now or Buy at 0.538
⭕️SL @ 0.480
✅TP1 @ 0.68
✅TP2 @ 0.88
✅TP3 @ 1.170
We will have more FREE forecasts in TradingView soon
❤️ Your Support is really appreciated!❤️
Have a Profitable Day
Btcsignals

THETAETH Has Broken Above the Resistance by a Large Candle
Welcome back Traders, Investors, and Community!
Hi Traders, THETAETH has broken above the Resistance by a large green candle. It seems it’s a beginning of a new trend.
⬆️Buy now or Buy at 0.002249
⭕️SL @ 0.00198
✅TP1 @ 0.0026130
✅TP2 @ 0.0031735
✅TP3 @ 0.0037850
We will have more FREE forecasts in TradingView soon
❤️ Your Support is really appreciated!❤️
Have a Profitable Day

TKOUSDT Going up
Welcome back Traders, Investors, and Community!
Hi Traders, TKOUSDT on H4 has been on an uptrend after the rejection from the Support. It might go lower to 1.35 before it goes up.
⬆️Buy now or Buy at 1.35
⭕️SL @ 0.97 or SL at Resistance Breakout
✅TP1 @ 1.80
✅TP2 @ 2.25
✅TP3 @ 3.50
We will have more FREE forecasts in TradingView soon
❤️ Your Support is really appreciated!❤️
Have a Profitable Day

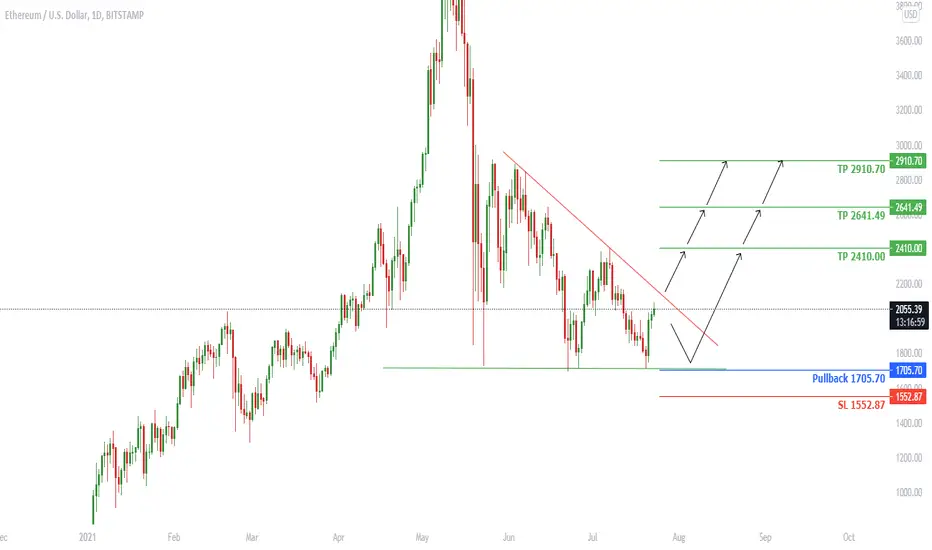
ETHUSD Waiting for Breakout
Welcome back Traders, Investors, and Community!
Hi Traders, ETHUSD on D chart is getting close to the end of Triangle, if we get a breakout on the lower TF we can look for entries. It might go down to 1705.70 before it goes higher.
⬆️Buy at Resistance Breakout or Buy at 1705.70
⭕️SL @ 1552.87
✅TP1 @ 2410.00
✅TP2 @ 2641.49
✅TP3 @ 2910.70
We will have more FREE forecasts in TradingView soon
❤️ Your Support is really appreciated!❤️
Have a Profitable Day
RSRUSDT Will Go Up After the Breakout
Welcome back Traders, Investors, and Community!
Hi Traders, RSRUSDT on D chart the price is getting close to the end of the Triangle, if we get a break above the Resistance on the lower TF we can look for potential entries for long.
⬆️Buy at Resistance Breakout or Buy at 30535.0
⭕️SL @ 0.00720
✅TP1 @ 0.026
✅TP2 @ 0.042
✅TP3 @ 0.058
✅TP4 @ 0.082
We will have more FREE forecasts in TradingView soon
❤️ Your Support is really appreciated!❤️
Have a Profitable Day

Bitcoin goes for 19000 USD !!!believe me I'm foreteller !
As I said at May 19, Bitcoin going down to reaches 19k. There are many evidences confirm this descending trend but we just consider technical analysis here!
.
since May 2020 we saw MA50 above the MA200 and now since June 19 we seeing MA50 under MA200 with a significant slope.
.
We have a strong resistance here at 29k-30k channel and if the price breaks it to downward, reaching 19k is achievable.
.
God bless you

Has BITCOIN seen the top? Halving Cycles and Diminishing returnsThis is not the first time that I have used the Halving-centered approach to my long-term analysis. You may find examples of previous research on the topic at the end of this study. It is however the first time that I will illustrate the data on the linear scale instead of the logarithmic. This allows for an interesting comparison.
As with previous studies, I have classified Bitcoin into four (4) Cycles:
* Cycle 1 starts on BTC's Genesis and ends on Halving 1.
* Cycle 2 starts after Halving 1 and ends on Halving 2.
* Cycle 3 starts after Halving 2 and ends on Halving 3.
* Cycle 4 starts after Halving 3 and ends on Halving 4.
Each Cycle's Top is consistent with the Theory of Diminishing returns. That suggests that each of Bitcoin's Cycle Peak is lower than the previous one, offering diminishing returns (ROI) over time:
* The scale on Cycle 2 is 40x from the previous Cycle (Cycle 1).
* The scale on Cycle 3 is 20x (50% less) from the previous Cycle (Cycle 2).
* The scale on Cycle 4 is 10x (50% less) from the previous Cycle (Cycle 3).
The model suggests that as the current Cycle (Cycle 4) is still on its start, it still off its Diminishing Returns Target by a big margin. Assuming the target is a level lower on the scale, $150000 seems like the model's target on the current Cycle.
Do you agree?
Examples of prior literature on the Halving approach:
** Please support this idea with your likes and comments, it is the best way to keep it relevant and support me. **
--------------------------------------------------------------------------------------------------------
!! Donations via TradingView coins also help me a great deal at posting more free trading content and signals here !!
🎉 👍 Shout-out to TradingShot's 💰 top TradingView Coin donor 💰 this week ==> ProjectSyndicate

Bull Market Restarts November 2021 The general sentiment seems that Bitcoin will be going to 20k and that the bull market is over. I strongly disagree until we start closing daily candles under 30K. On-Chain analysis shows that there are more stable coins on exchanges than ever before ready to buy.
There is a new trendline that is developing right now and so far we have a couple of reaction points on three different occasions.
March 2020 (Trend starts here Covid crash)
October 2020 (The start of the bull run)
June 22 2020 (The current local low for Bitcoin)
Fib Date - 5th November 2021
This is an interesting Fib date because it lined up with my trendline and it could very well be possible that we break the 8/1 Gann ratio around this time.
The two orange dotted lines are potential resistances that so far have had a lot of confluence and finally the red dashed line which lines up with the break down from the head and shoulders formation in May 16th 2021.
If Bitcoin holds the orange support line we could have very well pinpointed a timeframe when the bull market would restart , as I have said many times on on my previous TAs the bull market does not restart till the 8/1 Gann Ratio is broken and retested as support.

Bitcoin Long Position Risk/Reward 1:5Hi friends
bitcoin in H1 Timeframe is near Powerfull Demand Zone and i guess it can touch 32700 (Top Box)
when Near Top Box Risk Free Much Part of Position After Trail Position Swing By Swing in 15 Minutes.
Risk/Reward:1:5

DREPBTC Has Broken Above the Resistance H12
Welcome back Traders, Investors, and Community!
Hi Traders, DREPBTC on H12 has broken above the Resistance by a large green candle, it seems it’s going to retest before it continues higher. On the lower TF we can look for potential entries around 0.00001275
⬆️Buy now or Buy at 0.00001275
⭕️SL @ 0.00000984
✅TP1 @ 0.00001844
✅TP2 @ 0.00002247
✅TP3 @ 0.00002943
We will have more FREE forecasts in TradingView soon
❤️ Your Support is really appreciated!❤️
Have a Profitable Day

BITCOIN Channel Down or declining Head and Shoulders?Bitcoin has entered since the June 22 Low a new tight range, with the 1D MA50 (blue trend-line) acting as the Resistance that keeps the price that low.
Those Lower Highs created by the continuous push of the 1D MA50 are practically the technical characteristic of a Channel Down. And if we ignore the wicks on the candles that made every low since the May 19 crash, as well as the June 13-16 sequence that is outside the formation, then the pattern is indeed a Channel Down.
If we include this sequence though then the pattern can be interpreted as a Head and Shoulders on the decline.
What is absolute though on this 1D chart, is the CCI and the fact that it has been on Higher Lows since the May 19 crash. Every contact with this CCI Higher Lows trend-line has resulted into a relatively strong rebound for BTC.
If that trend-line holds and no Lower Low is made then I see strong probabilities to test the 1D MA50 for the first time since May 12 and if it breaks, go after the 1D MA200 (orange trend-line) which will restore the long-term bullish sentiment. On the other hand, a CCI Lower Low can bring another 2-3 day selling sequence and a wick as low as 25-24k.
So what do you think, do you see a Channel Down or declining Head and Shoulders here? And is the CCI Higher Lows trend-line the barometer for a bullish or bearish break-out?
P.S. If the whole sequence since the May 19 low is symmetrical with the June 22 low, then BTCUSD has roughly another 10 days before making a very strong move.
Feel free to share your work and let me know in the comments section!
Please like, subscribe and share your ideas and charts with the community!
--------------------------------------------------------------------------------------------------------
!! Donations via TradingView coins also help me a great deal at posting more free trading content and signals here !!
🎉 👍 Shout-out to TradingShot's 💰 top TradingView Coin donor 💰 this week ==> Ether2020
--------------------------------------------------------------------------------------------------------

ETHUSDT After the Breakout Could Go Higher
Welcome back Traders, Investors, and Community!
Hi Traders, ETHUSDT on H1 has still in downtrend but if we get a breakout above the Resistance there would be a chance to reach 2165.0
⬆️Buy at Resistance Breakout or Buy at 1900.0
⭕️SL @ 1800.0
✅TP1 @ 2165.0
✅TP2 @ 2405.0
✅TP3 @ 2638.0
We will have more FREE forecasts in TradingView soon
❤️ Your Support is really appreciated!❤️
Have a Profitable Day

BTCBTC remains in this tight correction triangle that keeps faking out Altcoins, this is why many coins break out then NUKE B C the alts are confussed as to what papa bear BTC is planning. I think the structure looks bullish and we start pushing higher, invalidation would be loosing that bottom TL at $31,600. As I said last week when I called the crash and then flipped bearish. I said in our chat that BTC should not break $31k. If bulls keep this level chances are we push up from here.

SANDUSDT Has Broken Above the Bearish Flag
Welcome back Traders, Investors, and Community!
Hi Traders, SANDUSDT on H1 has formed a Bearish Flag in an Uptrend and has broken above the Flag by large green candle, it might go down to 0.45756 before it continues higher.
⬆️Buy now or Buy at 0.45756
⭕️SL @ 0.38533
✅TP1 @ 0.54012
✅TP2 @ 0.58292
We will have more FREE forecasts in TradingView soon
❤️ Your Support is really appreciated!❤️
Have a Profitable Day

HBARUSDT Has Broken Above the Resistance, Still Can Go Higher
Welcome back Traders, Investors, and Community!
Hi Traders, HBARUSDT on H1 has broken above the Resistance and it has the potential to go higher to another major Resistance.
⬆️Buy now or Buy at 0.1658
⭕️SL @ 0.1563
✅TP1 @ 0.197
✅TP2 @ 0.220
✅TP3 @ 0.2448
We will have more FREE forecasts in TradingView soon
❤️ Your Support is really appreciated!❤️
Have a Profitable Day

