BTC/USD Daily Technical Outlook – Approaching Cycle Top?Bitcoin is currently trading around $85,500, maintaining short-term bullish momentum within a well-formed ascending structure on the daily chart. The price is now entering a mid-phase rally, with a clear target of $98,000, a key resistance level that coincides with the upper boundary of a rising wedge formation and historical trend extension zones.
Key Technical Levels:
Immediate Resistance: $88,800 (local supply zone)
Major Target Zone: $97,000–$98,000 (macro resistance + psychological round number)
Short-Term Support: $82,000
Key Breakdown Level: $78,500
While the momentum suggests BTC may continue to push higher in the near term, the $98,000 resistance is likely to act as a distribution zone, where buying may slow and profit-taking increases. This level could falsely signal a breakout, leading to a spike in retail long positions before the market enters a longer-term correction phase.
If rejection occurs at or near $98,000, BTC could begin a multi-month correction, with the primary downside target set at $49,000 by July 2025. This level aligns with previous weekly support, volume profile lows, and would represent a typical deep retracement following a major cycle top.
Outlook:
Near-term bias: Bullish toward $98,000
Macro bias: Bearish reversal expected from resistance zone
Cycle correction target: $49,000 (Q3 2025)
Btctechnicalanalysis

BTC-----Sell around 82100, target 80800-80300 areaTechnical analysis of BTC contract on April 10: Today, the large-cycle daily level closed with a big positive line yesterday. The K-line pattern was single negative and single positive. The price stood above the MA5 daily average line, but the attached indicator was dead cross. A single rise is difficult to become a trend and difficult to continue. In addition, when the large trend is still weak, there is no room for rise, so the current trend can only be regarded as a correction trend; from the four-hour chart, the current K-line pattern is continuous negative, and the pressure high point after the pullback is 83,600 area, and the price has not broken the correction high point position of the previous stage-by-stage decline. This is very obvious. The current K-line in the short-cycle hourly chart is continuous negative, and the attached indicator is dead cross, so whether the European session can continue is the key.
Today's BTC short-term contract trading strategy: sell directly at the current price of 82,100 area, stop loss at 82,600 area, and target 80,800 area and 80,300 area;

$$$ BTCUSD MACRO-BULLISH $$$ 1W CHART $$$BITFINEX:BTCUSD 1W Chart
There are many reasons to look at this weekly chart and see that there's absolutely no reason to be bearish on Bitcoin yet.
Holding strong r/s flip support.
Holding regression trend.
Holding parabolic trend.
Stoch RSI at the bottom.
Weekly bullish divergence.
Assuming this plays out in a way that's similar to the last local bottom, the current target is around $134k-$135k.
It would take a lot to invalidate all of these bullish indicators, but if that does somehow happen, with a CLOSE of the weekly candle that invalidated these, then It's pretty much definitely over for a loooong time.
NFA blah blah blah..

BTC Possible buying opportunity Possible buying opportunity if Weekly 50 SMA and Fib level 61.80% hold the price.

BITCOIN SEEMS TO FOLLOW THIS PATH TOWARDS 120k !!!According to elliott wave count, If BTC has completed it's macro wave (IV), then we can expect it moving to complete it's macro wave (V).
In this case if recently impulse move is counted as micro wave (i), then we can expect reversal from 81-79K region very soon.
Otherwise, if micro count gets Invalid, then reversal can be expected from up to 76-70k .
Important key level is breakout of 95k which would confirm reverse in trend.

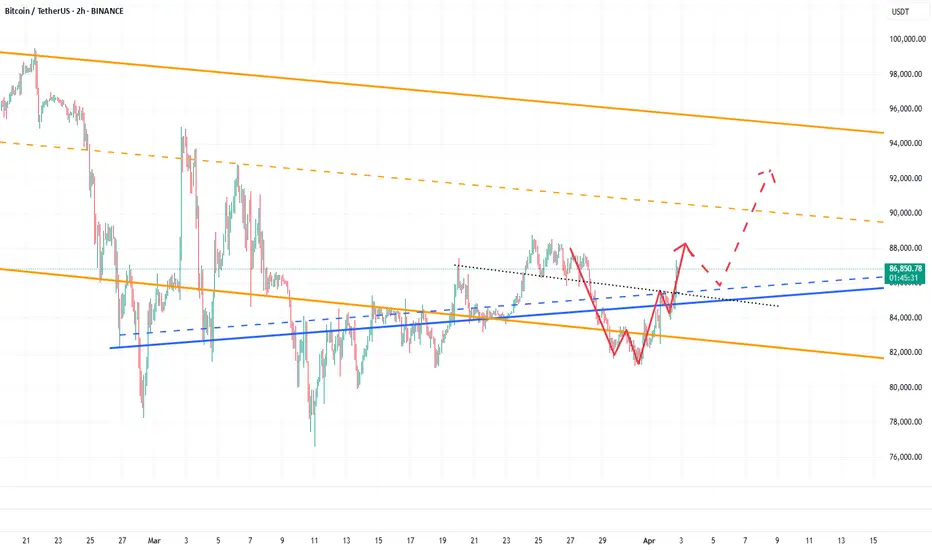
BTC already has the conditions to hit the 90000-95000 zone!A few days ago, I mentioned that BTC had the potential to surge towards the 90000-95000 range. Currently, BTC has already climbed above 87000 during its rebound, effectively opening the door to the 90000-95000 zone.
From a fundamental perspective, with bearish factors becoming clearer, if Trump adopts a more lenient stance on tariffs, BTC could extend its rebound. On the technical side, BTC has successfully broken through the short-term resistance around the 85500 level, turning the 85500-84500 area into a short-term support structure. This transition further supports BTC’s continuation to the upside, potentially testing the 90000-95000 range.
For short-term trading, we can consider waiting for a technical pullback and looking to go long on BTC once it retraces to the 85500-85000 region. The trading strategy verification accuracy rate is more than 90%; one step ahead, exclusive access to trading strategies and real-time trading settings
BITCOIN Update: What We Can Expect Next???According to current price action we can expect 3 scenarios:
Scenario 1: BTC is currently at it mid range resistance. If it breaks above this resistance then we may probably see price approaching range high and even beyond.
Scenario 2: If it fails to break and rejects, then most probably we can expect reversal from range low demand zone, which aligns with cypher harmonic pattern's PRZ.
Scenario 3: In worst case, we may see BTC dumping upto 74-70K region, and from there we will most probably see trend reversal.
Most crucial level to watch in all scenarios is 95k region, if it breaks successfully above it, then we will see BTC slamming new ATH.

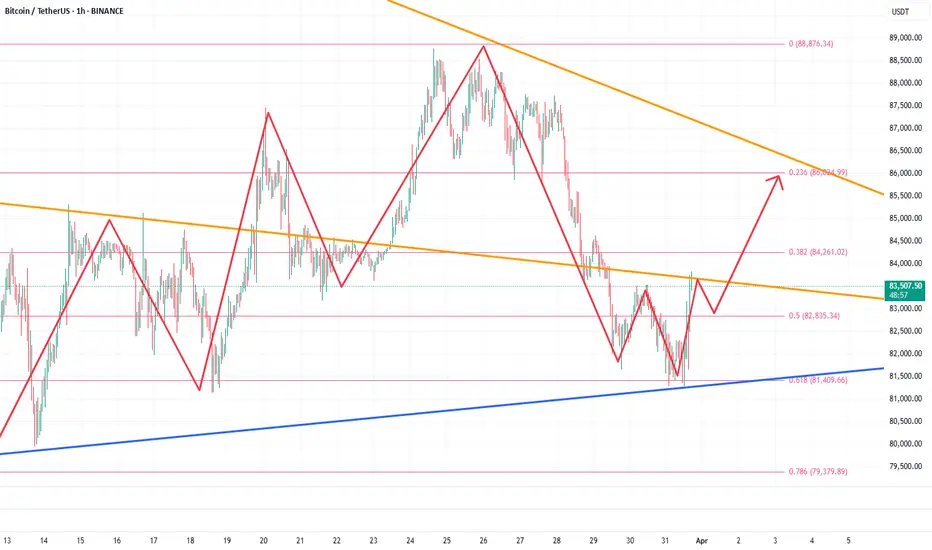
BTC is expected to hit 85000-86000 again, or even higherBTC has once again built a strong double bottom structural support in the 82000-81000 zone. BTC is likely to continue to rise. Once it breaks through the short-term resistance area near 83600, BTC may usher in a wave of accelerated rise and has the potential to continue to the 85000-86000 zone.
So we can still go long on BTC in the 82500-81500 zone. In addition, once BTC rises as expected, it is likely to grab the market share of gold, so it may also accelerate the decline of gold to a certain extent. This is a point we must be careful about next.
The trading strategy verification accuracy rate is more than 90%; one step ahead, exclusive access to trading strategies and real-time trading settings
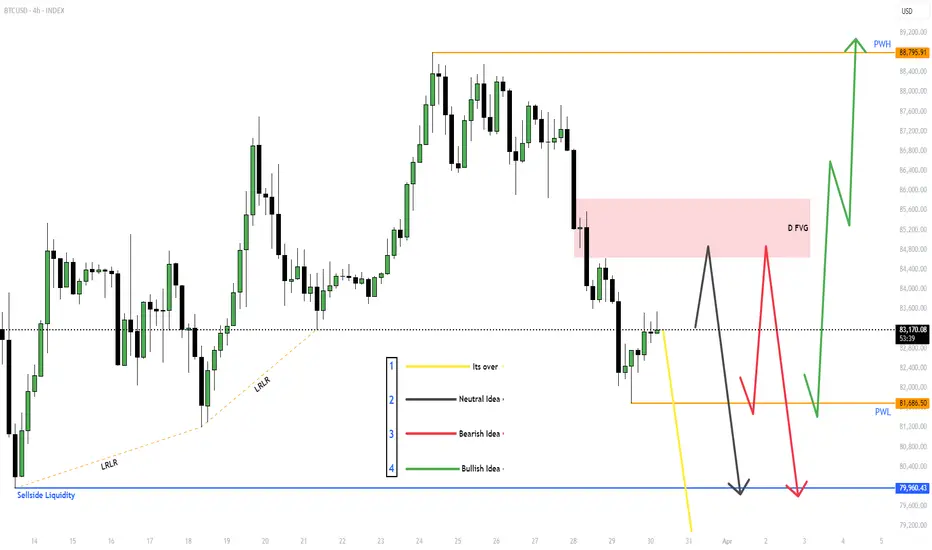
$BTC for Next week (31st March - 4th April)Given out all the ideas, Will react to the market based on which idea presents itself.
If Yellow line - Its better to stay out of the markets.
With the other wait for MSS (Market Structure Shift) and then take the trade and target the other side of the liquidity.
BITSTAMP:BTCUSD , BINANCE:BTCUSDT.P BINANCE:BTCUSDT
Overall I'm neutral on CRYPTOCAP:BTC but SEED_ALEXDRAYM_SHORTINTEREST2:NQ and NYSE:ES look bearish to me, and CRYPTOCAP:BTC could follow.
Buy BTC,it still has the potential to reboundBTC experienced a sharp short-term decline, breaking lower; however, the downward momentum has significantly slowed. Importantly, the recent pullback has not disrupted the broader upward consolidation structure, with the 84500-83500 zone continuing to provide strong support.
Once the bearish sentiment fully subsides, I anticipate a relief rally or a technical rebound. Therefore, this pullback could present an excellent opportunity to go long on BTC.
Consider entering long positions around the 84500-83500 support zone, targeting an initial upside move toward the 86000-86500 range.
The trading strategy verification accuracy rate is more than 90%; one step ahead, exclusive access to trading strategies and real-time trading settings

BTC:BTC is expected to continue to rise to 95000BTC has built a perfect upward structure in an oscillating upward manner, and has continuously strengthened the bottom support during the oscillation process. BTC is expected to continue to rise. However, BTC is facing the 88500-89500 resistance area, so BTC needs to accumulate energy to break through this resistance area, so we should focus on the 86500-85500 area support below. Once BTC touches this area and stops falling and rebounds, BTC is bound to break through the 88500-89500 resistance area and is expected to continue to 95000.
So in terms of short-term trading, if gold pulls back to the 86500-85500 area, we can go long on BTC.I will make more detailed trading plans and trading signals every day according to the real-time market situation, which is also the testimony of every successful transaction and profit of mine; the article has a certain lag, if you want to copy the trading signals to make a profit, or master independent trading skills and thinking, you can choose to join the channel at the bottom of the article

BTC: Accumulate energy for the rise and soar into the sky!📍BTC's volatility has narrowed, with selling pressure showing signs of weakening. Throughout the choppy price action, the 84000-83500 zone has established itself as a critical support area in the short-term structure. This level now serves as a key defensive line.
📍Following this consolidation phase, BTC may stage a rebound from this support region. If the price manages to break through the resistance around 84800 with strength, further upside momentum could drive it towards the 90000 level.
🔎Trade Idea:
BTCUSD:Buy at 83500-83000
TP:84500-85000
SL:Adjust according to risk tolerance.
📩Trading means that everything has results and everything has feedback. I have been committed to market trading and trading strategy sharing, striving to improve the winning rate of trading and maximize profits. If you want to copy trading signals to make a profit, or master independent trading skills and thinking, you can follow the channel at the bottom of the article to copy trading strategies and signals

BTC: Capture buying opportunities accurately📍Fundamentals: From a macro perspective, with increased government endorsement, cryptocurrencies are gaining greater credibility and popularity in the market.
📍Technical Analysis:The downward momentum of BTC is showing signs of exhaustion, with multiple rebounds forming a structural bottom that provides strong support. Overall, the bullish trend remains intact. The key support zone to monitor is 83000-82000.
📌If BTC fails to break below this level in the short term, a rebound is likely, with upside potential targeting the 88000-89000 range.
🔎Trade Idea:
BTCUSD: Buy at 83000-82000
Target (TP):88000-89000
Stop Loss (SL):Adjust according to risk tolerance.
📩Trading means that everything has results and everything has feedback. I have been committed to market trading and trading strategy sharing, striving to improve the winning rate of trading and maximize profits. If you want to copy trading signals to make a profit, or master independent trading skills and thinking, you can follow the channel at the bottom of the article to copy trading strategies and signals

The best investment since Nov 2021 - GOLD or BITCOIN ? - FACTSThe Main Chart is the chart from BITFINEX that trades Bitcoin to Gold DIRECTLY
I look to this often and find it a MUST See to compare the two assets.
This is Not done to try and make BTC like GOLD but that they are both investments with returns,
It is as simple as that
But which one has the higher return ?
I have taken the November 2021 Bitcoin ATH as the Datum point. a Worse case scenario for Bitcoin.
Bitcoin Directly to Gold.
As you can see on the main chart. If you had sold your Gold into Bitcoin and Just Held since Nov 2021, you are currently at a slight loss. Less ounces of Gold to one Bitcoin.
It is as simple as that. But PA has fallen from Above the buy price recently.
But to also mention, if you had bought Bitcoin with your Gold at the Bottom in Jan 2023, that is a 360% Rise in Value DIRECTLY OVER GOLD as opposed to the -75% Losses from ATH to Low.
Nothing else does that
Lets look at a comparison Via 100 USD investments into each asset
GOLD USD CFD
Let us say we invested 100 usd in Nov 2021 at the Bitcoin ATH that year.
Since then, there has been a 62.71 % increase in price; from your buy price, if you simply just held your investment.
This gives you 162.71 usd currently
PA had risen 12% from that date but then dropped 22% to the low. From the Low, PA has risen 89 % and if you had Traded your investment, selling high, buying Low, you would now have 211.68 usd currently
Now to Bitcoin - again, 100 usd invested at the ATH in Nov 2021
100 invested in Nov 2021 currently has a 24.68 % increase from Buy price. if you just HODL, off the 2021 ATH and so you would have 124.68 currently
From that ATH point, we saw a Loss as PA dropped 77.2% to the Low but then Rose up 596% from the Low.
If you traded , Depending on when you sold your bad 100 investment , the gains are different But lets say, you sold what was left of your 100 at the slight rise in PA in March 2022 - that was a loss of 28.5%, leaving you 71.5 usd
Wait till the Low in Jan 203 and then continue Buy Low, Sell high, you currently have 743 usd , having sold the top at 109K and waiting for the next Low
So, in summery, from 100 usd investment in Nov 2021 BTC ATH
GOLD
HODL 162.71 - Traded 211.68
BITCOIN
HODL 124.68 - Traded 743.34
The ONLY REAL Loss currently is with the BTC GOLD pair, where BTC is -20% currently off Buy price, having fallen from HIGHER than Buy price recently,.
However, PA is on the lower trend line, as you can see in the chart, and the expectation is for a Strong Bounce over the next few weeks..This will set BTC off towards that magical 50 ounces of Gold per Bitcoin.
But it has to be said, the journey if you held Bitcoin having sold out from Gold has been painful.
Tthat pain is about to end, very possibly forever.
Trading is not for everyone and Hitting the perfect High or Low point is almost impossible.
But the Gains are there in Bitcoin against Gold if you even do basic trading.
And, inmy opinion, if you have gold....SERIOUSLY think abot Bitcoin now.
Gold is OVERBOUGHT on many timeframes....
Bitcoin is not...................

BTC Buy at this Level - NFP News This Week (Volatility Risk!)Short term Buy idea on Bitcoin. This is a riskier idea because:
A) BTC is showing signs of Weakness (so we are counter trend trading)
B) This idea is based on NFP news timing
I may wait until Monday to get clarity (unless you also trade on the weekend)
Overall Idea for this is:
- W1/M candles have big rejection wicks to the downside, retesting the previous Week's wick, hinting at some Buyside potential
- We see divergence with ETH.
- The LTF H4 shows a Break of Structure, momentum move to the upside.
- We've already had a retracement down after, and it validated the gap in price (blue zone), reacting off it, hinting that it will hold.
- Now I'm waiting for the next best price to enter.
Again, NFP volatility can create bigger than usual spikes, so keeping that in mind.
If NFP takes it higher without coming to a better price, so be it - the train will leave without me. Will wait for further PA.
Price will be giving the validation to enter.

BTCUSDT UPDATE....What we can expect next????Things are going accordingly. We are currently probably forming ending diagonal which indicates a trend reversal. If things go even, we can expect reversal from 74-69k region which is also PRZ of bat harmonic pattern. Also golden fib. level (61.8) of micro wave (iii) is aligning in PRZ zone.

Bitcoin at $80,000. A Defining Crossroads: $65,000 or $120,000?Bitcoin stands at a critical juncture at $80,000, where market participants are engaged in a decisive battle between bullish momentum and bearish resistance. The outcome of this struggle will shape the next major move, with two distinct scenarios emerging.
Scenario 1: A Retracement Toward $65,000
If Bitcoin fails to maintain its current momentum, profit-taking and increased selling pressure could lead to a decline toward $65,000. This level serves as a crucial support zone, where demand may re-emerge to stabilize the price before any potential recovery. A break below this threshold would signal a deeper correction, potentially delaying any further upside in the near term.
Scenario 2: A Breakout Toward $120,000
For Bitcoin to sustain a move toward $120,000 by late March or early April, the market must see uninterrupted buying pressure over the next 10 days. There can be no hesitation—buyers need to absorb selling liquidity consistently, preventing any major pullbacks. The key level to watch in this scenario is $109,000, a major resistance zone that has the potential to act as the final barrier before BTC enters price discovery. A clean break and consolidation above this level would significantly increase the probability of an accelerated move toward $120,000.
At this stage, Bitcoin is at a make-or-break point, and the direction it takes from here will set the tone for the coming weeks. Whether it experiences a healthy correction or an explosive rally depends entirely on how market participants respond at these critical price levels.

BTC LOWBTC New Low month of March & April, new low is 68000 $ if its hold then going more down side .

BTC/USD (1D) Technical Analysis – March 10, 2025Today, the lowest bitcoin 79201, the highest 84088, the current sharp decline, short-term consideration to buy around 79000, to 81500 sold
BTCUSD Buy @79000-79500
tp: 81500-82000
Traders, if you liked this idea or if you have your own opinion about it, write in the comments. I will be glad
If you also aspire to achieve financial freedom,Follow the link below to get my daily strategy updates

BTC/usdtFirst, the decline reaches the 66,865 range, then the 87,000 range to fill the CME gap, and then the decline continues until the liquidity accumulation at the price of 45,000. From this price, we are accompanied by an upward wave of excitement to the 133,000 range, which is the target of the cup and holder pattern that was formed in the past. The final visit to the middle of the channel and the discount that Bitcoin will give us for the last time, and flight and flight and flight...

BTC New Low 68,000 $ BTC as per my view going till 68,000 $ then its going up side , on this chart i m goiving my thought , its take bit time .

(BTCUSD) – Bearish Continuation or Institutional Accumulation?Technical Analysis:
Bitcoin is currently trading within a descending channel, struggling to break above resistance. The price has rejected the upper boundary and could continue its downtrend toward $72,000 - $73,000 if support around $83,000 fails.
Key observations:
• Lower highs & lower lows confirm a bearish structure.
• A break below $83,000 - $82,000 could accelerate selling pressure.
• The next major support zone is $72,000 - $73,000.
Fundamental Analysis – Institutions and Governments Increasing Reserves:
• The U.S. government now holds around 200,000 BTC (~$17 billion), primarily seized from criminal cases. Their decision to maintain these holdings instead of liquidating suggests a potential shift in long-term Bitcoin adoption.
• MicroStrategy continues to accumulate BTC, now holding 423,650 BTC (~$42.43 billion), reinforcing corporate adoption of Bitcoin as a treasury asset.
• Coinbase now custodies 12% of the total Bitcoin supply, making it the largest Bitcoin custodian. This highlights institutional confidence in Bitcoin’s long-term value.
• Despite these bullish fundamentals, ETF inflows have slowed down, and macroeconomic uncertainty (such as potential Fed rate hikes) could put pressure on Bitcoin in the short term.

Today btcusd analyisBitcoin Price Trend Analysis (30-Min Chart)
Current Price: 92,005 USD
1. Key Levels & Distances
Resistance Zone: 94,000 USD (+1,995 USD from current price)
Support Zone: 91,500 USD (-505 USD from current price)
Major Support: 90,000 USD (-2,005 USD from current price)
2. Trend Analysis & Possible Scenarios
Bullish Scenario (Uptrend)
If the price maintains support above 91,500 USD and breaks 94,000 USD, it could push higher toward 95,000 USD or more.
Confirmation of higher highs and higher lows will strengthen bullish momentum.
Bearish Scenario (Downtrend)
If the price fails to break 94,000 USD and drops below 91,500 USD, a correction towards 90,000 USD is possible.
Breaking below 90,000 USD could indicate a larger downtrend.
---
3. Trading Strategy Insights
For Buyers (Long Positions):
Look for a breakout above 94,000 USD before entering.
A stop-loss around 91,500 USD.
Target profit at 95,000+ USD.
For Sellers (Short Positions):
If price rejects 94,000 USD, short entries below 91,500 USD could be considered.
Stop-loss near 92,500 USD.
Profit target around 90,000 USD.
