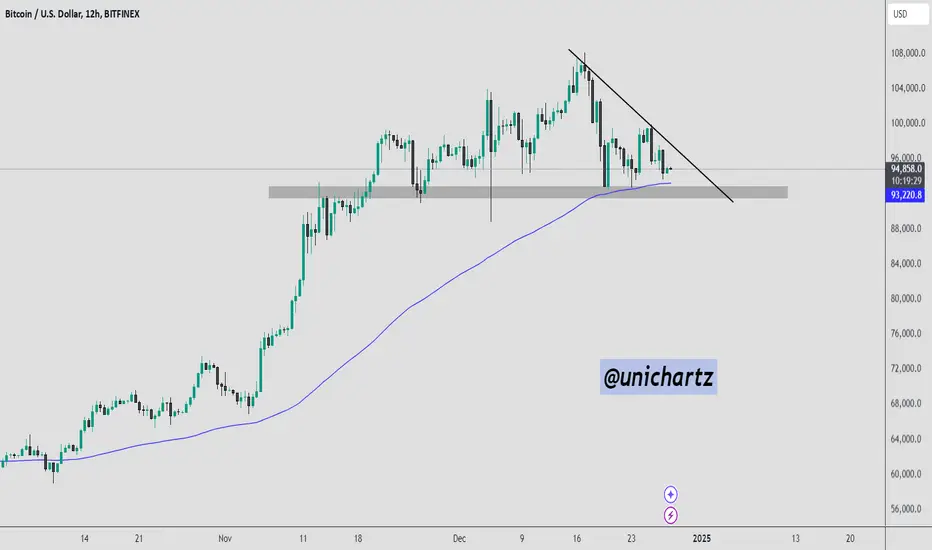
Bitcoin Battles Between Key Support and Resistance – What’s NextBitcoin is currently trading near $94,500, resting on a strong confluence of support. The price is testing the 100 EMA on the 12-hour chart, which aligns with a critical horizontal support zone around $93,000. At the same time, a descending trendline is acting as resistance, keeping the price under pressure.
A breakdown below the marked support zone could trigger a sharp decline toward the next significant level around $88,000. On the other hand, if BTC holds this support and breaks above the descending trendline, it could signal a bullish reversal, pushing the price back toward $98,000 and potentially higher.
Btctechnicalanalysis
Trading plan for Bitcoin price for Christmas & New Year holidays🎄 Christmas and New Year's holidays are coming up, and we congratulate you on that!)
We survived, even earned a little, so thank you for that)
Currently, the CRYPTOCAP:BTC price has been stopped on "the verge of a foul", but the holidays will lead to a decrease in business activity and an increase in “manipulative volatility.”
So, to follow the behavior of the OKX:BTCUSDT price, subscribe to this idea!
A big temptation is to “break the stops” of #Bitcoin, which are hiding below $85k, and an even bigger temptation is to close the GAP on the CME BTC chart in the range of $77-78k.
And there are several other options for the development of events by combining the BTC.D and USDT.D indices, but I'm too lazy to write about it yet)
⁉️ But if you are interested in us writing “voluminous reflections”, like at the end of 2022 before the start of super growth with plans for 2023-25, which are working out very well👇
then we need inspiration from you in the form of reactions and comments here and maybe a miracle will happen, the main thing is to believe in it!)

BtCUSD Outlook I'm expecting the sweep of that Inducement before the Open and close level of the last H4 bearish candle. A short buy from there then I'm anticipating the seell continuation

Let's talk about CME📈In most cases, BTC is likely to move upward and fill the green CME gap section. This could lead to significant movements in altcoins, potentially triggering the next phase of the bull run and the start of an alt season.
📉However, in the worst-case scenario, if BTC breaks the critical $90K support zone, we could expect a continuous downturn, possibly filling the red CME gap. If this second scenario unfolds, altcoins are likely to experience substantial losses, and the first stage of the alt season may be missed.
📌In the first scenario, if the alt season starts BTC will continuously try to breaks the $90K super support zone. Setting stop losses becomes very important at this stage.

The continuation of the upward bull run of Bitcoin💠 The nature of the market has always been such that every uptrend at the beginning of an upward trend requires a short correction, and this is not far-fetched for Bitcoin.
⭕️ Everything is self-explanatory on the chart and no further explanation is needed. Dear friends, the numbers given in the chart are drawn according to analytical and trading experience. So far, all my analyses have had a very low error rate, and I hope that this analysis will again achieve its goals without mistakes.
▫️The buying suggestions are the blue and purple lines, which I recommend buying as DCA. If you have two targets, you can see that there is no reason why the second target must be seen. It is possible that a sharp decline will begin near or in the middle of these two targets. Therefore, be sure to take your profits from the first target.
Support us by liking the analysis ❤️

BTC GOING UP OR DOWN? 74 OR 124?"Sometimes a person doesn't know whether to laugh or cry about their situation and the future events.
Being optimistic is good, and pessimism is full of trouble...
In this analysis, on the weekly time frame, Bitcoin is on a trendline, but the MACD and Ichimoku indicators suggest a decline, and the candles are still holding strong on the trendline.
Although everything seems uncertain and strange, we must wait...
Nevertheless, I am still confident and interested in Bitcoin being bullish, but if a bit more Bitcoin is sold, it will definitely drop. If it is not sold, the catastrophe will be avoided, negative divergence and oversold conditions will occur, and the upward movement will begin.
The data still shows that Bitcoin is being accumulated... The UAE, companies like MicroStrategy, El Salvador, and other countries and financial institutions are accumulating, but small retail investors are selling.
So, we wait for the next developments.
Target: $74,000 or $124,000."

Bitcoin in 2024: Key Trends, Recent Developments, and Future OutBitcoin in 2024: Key Trends, Recent Developments, and Future Outlook
H ello,
Bitcoin, the world’s first and most prominent cryptocurrency, continues to dominate the digital asset landscape in 2024. Amid a rapidly changing environment shaped by regulatory updates, technological advancements, and shifting market dynamics, Bitcoin remains at the forefront for investors, institutions, and blockchain enthusiasts. Here, we explore the key trends, recent developments, and risks influencing Bitcoin’s journey.
Market Trends and Sentiment
Bitcoin’s performance in 2024 has been marked by volatility and resilience. Following a period of price consolidation in 2023, renewed interest in Bitcoin has surged this year, fueled by macroeconomic factors like inflation concerns, geopolitical tensions, and increasing institutional adoption. This renewed focus propelled Bitcoin to a new all-time high of over $103,000 in December 2024, reflecting both strong demand and fluctuating investor sentiment.
The bullish outlook is largely driven by institutional adoption. Major financial institutions have expanded their Bitcoin offerings, including exchange-traded funds (ETFs), custody solutions, and Bitcoin-backed loans. The U.S. Securities and Exchange Commission (SEC)’s approval of several spot Bitcoin ETFs earlier this month has been a game-changer, attracting traditional investors and enhancing Bitcoin’s accessibility. Conversely, bearish sentiment arises from persistent regulatory uncertainties, particularly in the United States, where stricter scrutiny of exchanges continues to cast a shadow over the market.
Regulatory Landscape
Regulation remains a pivotal yet contentious aspect of Bitcoin's growth. In 2024, several countries introduced comprehensive cryptocurrency frameworks, offering much-needed clarity for the industry. For instance, the European Union’s implementation of the Markets in Crypto-Assets (MiCA) regulation has set a benchmark for crypto governance within the bloc, increasing investor confidence.
Meanwhile, emerging markets such as India and Brazil have embraced Bitcoin as a tool for financial inclusion, fostering widespread adoption. However, not all regulatory developments have been favorable. The U.S. SEC’s cautious approach has delayed approvals for certain cryptocurrency innovations while increasing oversight on exchanges. This dichotomy between proactive and restrictive regulatory environments will continue to shape Bitcoin’s adoption and growth.
Technological Advancements
Bitcoin's technological foundations have seen notable progress in 2024, reinforcing its utility and appeal. The Lightning Network, a second-layer solution designed to enable faster and cheaper transactions, has gained significant traction. This technology enhances Bitcoin’s potential to function not only as a store of value but also as an efficient medium of exchange.
Sustainability has also become a focal point in Bitcoin mining. Renewable energy now powers a significant portion of mining operations, addressing previous criticisms about Bitcoin’s environmental impact. These advancements reflect a broader industry shift toward greener practices, appealing to environmentally conscious investors.
Adoption Trends
Bitcoin’s integration into both institutional and retail financial systems continues to deepen. Institutional adoption has reached unprecedented levels, with leading asset managers incorporating Bitcoin into their portfolios and major banks offering Bitcoin-related services. Retail adoption has also grown, with more merchants and platforms accepting Bitcoin as a payment method.
The rise of Bitcoin-backed financial products, including derivatives and tokenized assets, highlights its maturation as a financial instrument. Bitcoin’s increasing prominence in traditional finance signals its evolution from a niche digital asset to a key player in the global economy.
Recent Developments Influencing Bitcoin’s Price
Spot Bitcoin ETFs: U.S. approval of spot Bitcoin ETFs in December 2024 was a watershed moment, enabling easier access for traditional investors and driving Bitcoin’s price to new highs.
Regulatory Clarity in Europe: The EU’s MiCA regulations have bolstered confidence among European investors and institutions, fostering a secure environment for Bitcoin operations.
Emerging Market Adoption: Nations like Brazil and India have integrated Bitcoin into their financial systems, viewing it as a means of promoting financial inclusion.
Geopolitical Instability: Tensions in global markets have reinforced Bitcoin’s role as “digital gold,” attracting investors during times of uncertainty.
Sustainability Efforts: Renewable energy adoption in mining has improved Bitcoin’s environmental profile, drawing in environmentally conscious stakeholders.
Risks and Challenges
Despite its progress, Bitcoin faces significant challenges. Regulatory uncertainty in jurisdictions with restrictive policies remains a key risk. The SEC’s ongoing scrutiny in the U.S. underscores the hurdles Bitcoin must overcome in certain markets. Market volatility continues to deter risk-averse investors, while competition from other cryptocurrencies and blockchain platforms could dilute Bitcoin’s dominance.
Security remains another area of concern. While Bitcoin’s blockchain itself is highly secure, vulnerabilities in exchanges and wallets expose users to hacks and fraud. Education on best practices and enhanced security measures will be critical to maintaining trust within the ecosystem.
Looking Ahead
The future of Bitcoin in 2024 and beyond will depend on its ability to address these challenges while capitalizing on its opportunities. Key developments to watch include further regulatory evolution, ongoing advances in scalability and energy efficiency, and the continued integration of Bitcoin into traditional finance.
Bitcoin’s journey from a niche digital asset to a globally recognized financial instrument underscores its resilience and adaptability. As decentralized finance and digital currencies continue to evolve, Bitcoin remains at the forefront, shaping the future of the cryptocurrency landscape.
Regards,
Ely

BTC thesis by Titan_KarmaBitcoin Investment Thesis
Market Analysis
Bitcoin (BTC) is currently trading at $96,938.18, showing potential for bullish momentum. The recommendation is to OPEN LONG positions, supported by technical and market indicators suggesting upside potential.
Key Technical Indicators
Stop-loss: Positioned at $95,000.00, providing a safety net against sudden price drops while allowing room for market fluctuations.
Take-profit: Targeted at $103,000.00, aligning with recent resistance levels for an optimal risk-reward ratio.
Exit Point: Set at $100,000.00, offering a balanced opportunity for securing partial profits before hitting the take-profit level.
Confidence Level
With a confidence level of 75%, this strategy reflects cautious optimism. While the data supports a bullish move, traders should remain vigilant due to the neutral correlation and market volatility.
Correlation with BTC
The neutral correlation (0.00) indicates BTC is moving independently, unaffected by broader market dynamics or external asset influences.
Position Analysis
Open Long Positions: None currently, presenting an opportunity to capitalize on the suggested strategy.
Open Short Positions: None, indicating no significant bearish sentiment in the market.
Risk Management Strategy
Entry should occur near the current price of $96,938.18, with a well-defined stop-loss at $95,000.00 to minimize downside risk.
The take-profit at $103,000.00 provides an attractive upside, and the exit point at $100,000.00 allows for partial profit-taking.
Maintain flexibility to adjust the stop-loss and take-profit levels based on evolving market conditions.
Recommendation
OPEN LONG positions near the current price, targeting the upper resistance level at $103,000.00. The neutral correlation and technical setup support this strategy, but traders should monitor the market closely for sudden shifts in sentiment or price action.

Bitcoin, we're testing a correction...Bitcoin, we're testing a correction...
Not to scare anyone, testing 3 situations..... on the last developed tool.
1. growth on the last 2 fractal structures is over, so a fall follows and the trend will change, but the older structure allows maximum growth around 118000.
2. a global decline follows around 46/43000 and then 37/36000/ on the current chart.
3. very, very soon we are in for a correction in the 66666 area..... many altcoins will probably make a new low and then a rapid rise - here I am testing a correction following a growth pattern. ....
I wrote for the future.
...This is not investment advice.
...If anyone finds my postings useful and wants to thank me, they can always find me in the comments.
Disclaimer, the author of this article has not and will not open positions in bitcoins, this article is a way to analyze the price, do not open positions based on the above.

Bitcoin What to do and where to run to?Bitcoin What to do and where to run to?
Friends, don't forget to click like 🚀 under the idea, it's important.
Divergence in trading is a multidirectional movement of the price chart and indicator. On the chart, the price of an asset moves in one direction, while the technical indicator that follows it moves in the opposite direction.
Divergence warns that the current price trend may weaken and in some cases may lead to a change in price direction.
In this case, we observe a double bearish divergence on the 1D timeframe. This is a powerful correction signal. All traders see it, which will logically lead to fixing positions or opening shorts.
What will happen next?
Two main scenarios now:
1. Sellers are active and as a consequence - local correction and sideways from current values.
2. Sellers are active, but the market maker is pushing prices higher and removing sellers' stops. This will lead to a triple divergence and will further strengthen the sellers. As a result - a powerful correction and trading at the lower levels.
At the moment, both scenarios have equal priority and the decision will be determined by the balance of power in the moment. The scales of the market maker may tip to either side.
Write in the comments, what is your mood? Do you want to sell or strong hold?

BTC: Possible retracementBTC has reached Fib projection level $107,680 . Price on RSI is diverging both on daily and weekly chart. There may be possible retracement. Use tight stop loss. If price closes above $107,680 then there is possibility BTC will hit $123,545 level.

BTCUSDT expect fall at 1.30pm - Bitcoin updateBTCUSDT expect fall at 1.30pm. after 1st target trailing stoploss. this entry is 1:16 risk reward ratio.
Education purpose only.

BTCUSD Correction may Continue Bitcoin briefly dipped below $94,000 earlier this week but recovered strongly, stabilizing around the $100,000 mark by Friday.
Despite these mixed sentiments this week, institutional demand remained strong, adding $1.72 billion until Thursday.
Bla bla bla!
The COO of Indian crypto exchange Giottustold FXstreet that the financial incentive for investors is to support adding Bitcoin to a company’s balance sheet.
Bitcoin (BTC) reclaimed the $100K level, trading near $100,100 on Friday after a recent decline earlier this week. The recent pullback in BTC was mostly due to high-leverage traders and some holders booking profits. Despite Microsoft’s rejection of adding Bitcoin to the company’s balance sheet, institutional demand remained strong, recording a total inflow of $1.72 billion until Thursday. Giottus COO Arjun Vijay highlighted the growing financial incentive for companies to adopt Bitcoin on their balance sheets.
Bitcoin reaction this week

Expired BTC.USD Weekly outlook. 2nd WK DEC 2024Expired BTC.USD Weekly outlook. 2nd WK DEC 2024
> BULLISH 📈 HIT
Prior Week Closed Price: 96,764
This Week Target Price: 99,413
Strike Price: 100,594 on DEC 11, 2024
Upper Range: 103,537
Lower Range: 95,288


#BTC - Ready to pivot and head to 108k
In my latest post I mentioned that we might visit 93-95k. Sadly for alt coins that resulted in a massive bloodbath, but fear not, it is a healthy pullback meant to clear leverage, that will fuel the next move on #BTC
What's next for BINANCE:BTCUSDT ?
1. After the reaction swing high to 102k price now retraced into the 0.618 zone
2. It also fits perfectly on the fib time zone, and as we've seen in the past, it signalled almost perfectly the reversal in the trend
3. Given the massive sell-off from alts, I believe now it has enough strength to move to the extension zone which is around 108k
4. Based on the impulse we should know if it's just a manipulation or it will continue to go higher
Personally I think we should see another sweep from 108k to 90-95k, and only afterwards we can continue higher to 120k
What are your thoughts?

#BTC - Is the bull run over?Is the bull run over for #BTC?
As I mentioned in my last post, I don't think BTC is ready for a more ample correction, only once we reach the extended zone of 105-108k
There are multiple confluences that sustain this hypothesis:
1. On the Pitchfork price touched the 1.618 low and rejected
2. All the liquidity was taken from 90-91k
3. There is now more and more liquidity forming above 104k, as people believe that the huge wick sweep signalled a change of character (reversal)
4. Looking at the Fibonacci time levels, we see multiple pivots in the past that were almost perfectly on the time levels, the next one being tomorrow
Even if price keeps correcting a bit lower to 93-96k, don't be fooled and sell early, because the next sweep of highs will be very impulsive, close to inflation news.

BTC/USD: Navigating ATHs, Corrections, Long-Term TrajectoriesBitcoin has recently achieved a new all-time high (ATH), signaling strong bullish momentum. However, historical patterns suggest that a significant correction is imminent, with a potential decline of 32% to the $70,000 level. This critical juncture will define Bitcoin’s next move and its long-term trajectory.
Key Scenarios for BTC’s Path:
Scenario 1: Consolidation Above $90,000 and Push to $120,000 (March 2025)
Bitcoin’s first challenge is to maintain support above $90,000. If successful, the bullish momentum could drive BTC to a new ATH of $120,000 by March 2025.
Following this peak, BTC may face a significant correction to $40,000, signaling the end of the current market cycle.
Scenario 2: Correction to $70,000 Before Reclaiming $120,000 (July 2025)
If BTC struggles to hold $90,000, it could drop to $70,000 for a deeper correction.
After this retracement, a rebound could see BTC reaching $105,000–$109,000, before ultimately achieving the $120,000 ATH by July 2025.
This path ensures a more sustainable rally but still concludes with a cycle-ending correction to $40,000.
Long-Term Outlook: The Lowest Lows (2026)
As the market cools and enters a bearish phase, BTC may experience its lowest low between April and July 2026, targeting:
$38,000 (most likely scenario).
$33,000 (worst-case scenario).
Key Buying Opportunities:
For long-term investors, BTC’s anticipated price movements create excellent entry points:
First Buy: $41,000
Second Buy: $39,000
Best Buy: $33,000
Summary of BTC’s Cyclical Movement:
Short-Term: Fight to stay above $90,000 and potentially hit $120,000 by March 2025.
Mid-Term: Correct to $70,000 before establishing a new ATH by July 2025.
Long-Term: Fall to $38,000–$33,000 by mid-2026, marking the lowest phase of the cycle.
This roadmap emphasizes BTC’s cyclical nature, offering both opportunities and risks for investors to navigate strategically.

Scenario BTC 6.12.There are two main scenarios: either the support at 0.786 breaks through and we go for another ATH, or the support holds and we can watch for a possible correction. If that happens, we can test the levels somewhere around the previous low and if the trendline breaks, we can test the levels around 87k, but we are currently waiting for further signals.

BTC Parallel Channel in Daily ChartOn the BTCUSD daily chart, we can observe that Bitcoin's price has been oscillating within a well-defined parallel channel. The upper trend line acts as resistance, while the lower trend line serves as support. This channel has been respected multiple times, making it a reliable indicator for future price movements.
Key Observations :
Resistance and Support :
The upper trend line has consistently acted as a resistance level, limiting the upward movement of BTC.
The lower trend line has provided strong support, preventing significant downward breakouts.
Price Action:
The price has touched the upper trend line many times, indicating a strong resistance level.
Similarly, the lower trend line has been tested few times, confirming its role as a robust support level.
Potential Breakout :
A breakout above the upper trend line could signal a bullish trend continuation, leading to higher price levels.
Conversely, a breakdown below the lower trend line might indicate a bearish trend reversal, resulting in lower price levels.
Technical Indicators:
To complement the parallel channel analysis, I have included the following technical indicators:
50-Day Moving Average (50 DMA): Provides a smoothed trend direction.
200-Day Moving Average (200 DMA): Indicates long-term trend direction and potential reversal points.
RSI (Relative Strength Index): Indicates overbought or oversold conditions.
Conclusion:
The parallel channel on the BTC daily chart provides valuable insights into potential price movements. Traders should watch for a breakout above the upper trend line for a bullish signal or a breakdown below the lower trend line for a bearish signal. Additionally, keeping an eye on the included technical indicators can help confirm these signals and enhance trading decisions.
Disclaimer : The information and analysis provided in this publication are for educational purposes only and should not be construed as financial advice or recommendations to buy, sell, or hold any securities. The author and TradingView are not responsible for any investment decisions made based on the content presented herein. Always consult a financial professional before making any investment decisions.

Altseason is Here - Follow Triangle BreakoutLong positions are piling up on Bitcoin (BTC) after each other.
I think that investors follow the consolidation to buy more.
Know that symmetrical triangles can break on either side.
Enabling you to follow the breakout, I made this chart.
This chart shows a symmetrical triangle tracing Bitcoin price action.
High as investors' risk appetite is, any drawback is potentially considered an opportunity.
I estimate that large-cap altcoins will do even better.
So, it might be a good idea to follow up on Ethereum.

BTC GOING TO 112$ ?"Will Bitcoin reach $105? It definitely will. The first target is between $105 and $108, but the main target, based on the cup pattern on the weekly timeframe, is $112. Around this level, we can also expect a correction in Bitcoin."

BTC WHALES - 100K Club - The market is Looking Fishy!!!!!
The BTC 100K Club: Cold Wallet Exchange Whales and Their Hidden Influence
In the ever-evolving world of Bitcoin, much of the focus remains on price action, retail sentiment, and macroeconomic events. However, one often-overlooked yet critical element of market dynamics is the role of cold wallet exchange whales—specifically, the BTC 100K Club. These are four exchange-owned wallets that hold over 100,000 BTC each and have a proven track record of driving accumulation and distribution cycles. While many retail traders ignore their activity, these wallets serve as the silent architects of Bitcoin's major price movements.
The Forced Market Top: Déjà Vu from $70K
The current market is eerily reminiscent of the $70,000 peak, where a massive withdrawal of over 100,000 BTC from cold storage signaled a forced market top. That withdrawal period lasted approximately three months, during which the broader market turned highly bearish. Retail investors sold off their holdings amid fear and uncertainty, while these whales were quietly re-accumulating at lower levels. By the time the U.S. election came around, the whales had successfully regained their positions, and the price surged—obliterating retail bears in a bullish breakout.
The Present Scenario: A Smaller-Scale Replay?
Fast forward to today, and we are seeing a similar but scaled-down version of the $70K playbook. My tracker has identified a -39,914 BTC withdrawal from cold storage wallets, which aligns with the recent market top and signals the start of a correction phase. While retail sentiment continues to lean bullish, history shows that these withdrawals are often precursors to distribution cycles, where whales offload positions at higher prices.
Accumulation: The Calm Before the Storm
Despite the current bearish undertone, the long-term outlook for Bitcoin remains undeniably bullish. Just as the 100K BTC accumulation phase marked the bottom after the $70K top, we are waiting for similar accumulation signals before the next leg up. These accumulation events are not only indicators of whale confidence but also serve as the foundation for massive upward price momentum.
Retail Bears Beware: Lessons from History
One of the biggest mistakes retail traders make during these phases is underestimating the strategic moves of whales. As we saw after the $70K top, while many screamed "sell," whales quietly accumulated Bitcoin, setting the stage for the next bullish rally. The same dynamic could be playing out now. Those ignoring the signals from the BTC 100K Club may find themselves caught on the wrong side of the trade yet again.
My Position and Outlook
I accurately predicted this market top and exited 3quarters of my BTC positions at $99,000, securing substantial gains. For now, I remain bearish in the short term, but I am closely monitoring the BTC 100K Club for signs of accumulation. Once we see significant deposits back into cold wallets, it will likely signal the end of the correction and the start of a new accumulation phase.
In the long term, there is no doubt that Bitcoin will break through the $100K psychological barrier. This is not just speculative optimism—it’s a conclusion drawn from years of observing whale behavior and market cycles. Retail investors would do well to track these cold wallet movements closely, as they provide a clearer picture of the market’s true direction than any sentiment-driven analysis.
Conclusion: A Time to Observe and Learn
The BTC 100K Club wallets represent some of the most powerful forces in the Bitcoin market. Their activity signals the onset of major market tops and bottoms, often weeks before price action reflects these shifts. As we wait for the next accumulation phase, retail investors should focus on learning from these cycles and preparing for the inevitable breakout that will likely take Bitcoin into new all-time highs.
Whether you’re bearish or bullish today, one thing is certain: Bitcoin's journey past $100K is only a matter of time. The question is, will you be ready?
