BTC/USD: What is Going On?Several themes are at play right now, which contributed to a selloff across risk assets last week. Influenced by political shenanigans (tariffs) and the Bybit exchange breach, this sent Bitcoin (BTC) 17.5% lower versus the US dollar (USD) by the close of trading on Friday.
Monthly Chart: Room to Explore Deeper Waters
There is not much to talk about on the monthly chart except to remind ourselves that last year wrapped up rejecting the underside of a 100% projection ratio at US$106,610. Despite January's gain (9.0%), February concluded considerably lower and, as far as I can see, demonstrates scope to continue exploring south until support from US$68,926.
Daily Chart: Dragonfly Doji Ahead of 200-Day SMA
On the daily timeframe, the latest reveals that with the aid of the 50-day simple moving average (SMA) delivering resistance at US$97,092, price ruptured the lower edge of a range that has been in play since December 2024 between US$91,591 and US$108,396. This breakout led BTC/USD to within touching distance of the 200-day SMA at US$76,811 on Friday, finishing the week in the shape of a dragonfly doji (a bullish candlestick signal similar to a hammer pattern). While this candle pattern/SMA combination (and neighbouring daily support from US$73,575) could trigger a recovery (profit taking) on the daily timeframe, the room to discover deeper waters on the monthly timeframe toward support at US$68,926 places bulls in a questionable position at current levels and may see daily flow push southbound. Consequently, should the major crypto pair retest the underside of the daily range (see red arrows) before hitting the noted daily supports (and monthly support), this may be viewed as a sell-on-rally scenario.
Written by FP Markets Market Analyst Aaron Hill
Btctrade

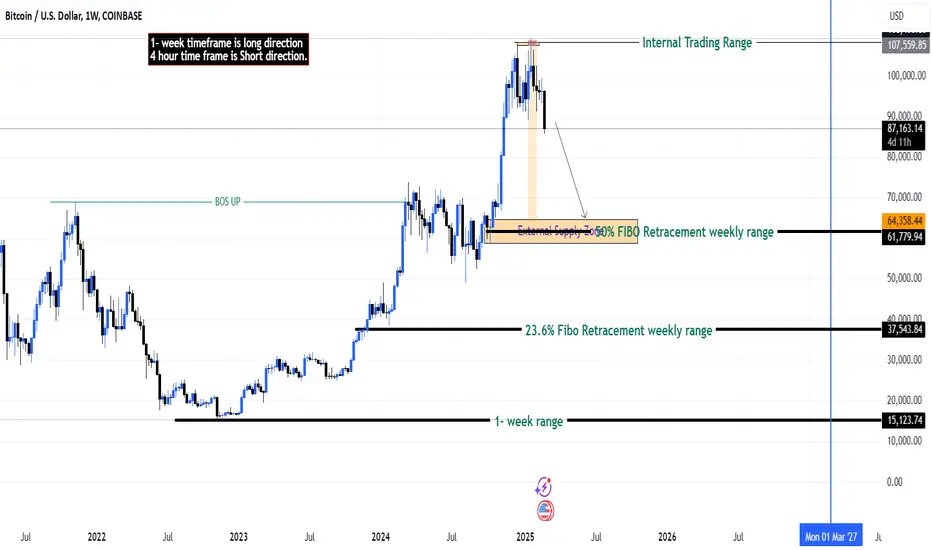
BTC Rebalance in Play? Key Retrace Setup Unfolding!Bitcoin has tapped into a bullish imbalance on the weekly timeframe—a natural move as the market seeks to rebalance. 🔄 We often see reactions around the midpoint of these levels.
If price starts ranging sideways and breaks structure to the upside, we could consider a counter-trend trade on the retrace, then look for another sell opportunity as it pulls back. 📊
I’ll aim to follow up with a video over the weekend. Stay tuned! 🎥
Not financial advice. ⚠️

Bitcoin Reversal Setup – Potential Upside Within the ChannelBTC/USD is currently trading within a descending channel on the 1H timeframe. The price has recently bounced from the lower trendline support, indicating a possible reversal.
Key Levels & Observations:
• Support Zone: ~ $78,000 (recent low & trendline support)
• Resistance Levels:
• $95,000 (major resistance level within the channel)
• $96,000 (potential breakout level)
Trading Idea:
A bullish move is anticipated if BTC holds above the lower trendline. A potential target is the mid-channel resistance ($93,000), with an extended move toward the upper boundary ($94,600). A break above this level could signal a broader trend reversal.

Bitcoin Dropped Below $80k: Will This Nightmare Will Be Stopped?Hello, Skyrexians!
Despite the extreme fear tonight BITSTAMP:BTCUSD continues going down and finally broke $80k. Investors are panic selling right now and don't know what to do. But we pointed out earlier that the most impulsive part of bull run ahead and current dump is just the correction.
Let's take a look at the weekly time frame. Here we can see that the potentially strongest reversal signal has been broken. We are talking about divergence with AO. That is the reason why we marked that waves 1 and 2 like you see on the chart. According to this counting we can see that wave's 3 targets are at the $140k and $190k. At the same time we wanna tell you that the strong resistance is located at 1 Fibonacci level at $110k and we have seen it already.
Current dump is wave 2 inside wave 3. It has the target between 0.5 and 0.61. The first one has been already reached. We expect reversal from here. Moreover Fractal Trend Detector is showing us bull run support with the green zone and now we see its retest.
Best regards,
Skyrexio Team
___________________________________________________________
Please, boost this article and subscribe our page if you like analysis!

BTC/USDT chart shows a Round Top (or Distribution) patternPattern Breakdown
Formation:
The chart displays a rounding top shape, where BTC price gradually increased, peaked, and then started declining.
The red shaded area represents the curved top, confirming a distribution phase.
Key Levels:
Peak: Around $110,000 (approx.).
Neckline/Support: ~$90,000, which was broken to the downside.
Measured Move: The expected drop is roughly equal to the height of the rounding top, which was around $21,300.
Breakdown & Target:
The price has broken below the $90,000 support level, confirming the pattern.
The expected price target based on the pattern is around $70,000, calculated using the height of the round top.
Additional Observations
Volume: There is an increase in volume at the breakdown point, which validates the bearish move.
Momentum: If BTC fails to reclaim $90,000, it may continue downward.
Conclusion
The chart signals a bearish trend continuation after breaking the neckline.
BTC could drop towards $70,000 unless buyers step in to regain momentum.
If BTC reclaims $90,000, the bearish scenario could be invalidated

BTC/USDT chart shows a Round Top (or Distribution) patternPattern Breakdown
Formation:
The chart displays a rounding top shape, where BTC price gradually increased, peaked, and then started declining.
The red shaded area represents the curved top, confirming a distribution phase.
Key Levels:
Peak: Around $110,000 (approx.).
Neckline/Support: ~$90,000, which was broken to the downside.
Measured Move: The expected drop is roughly equal to the height of the rounding top, which was around $21,300.
Breakdown & Target:
The price has broken below the $90,000 support level, confirming the pattern.
The expected price target based on the pattern is around $70,000, calculated using the height of the round top.
Additional Observations
Volume: There is an increase in volume at the breakdown point, which validates the bearish move.
Momentum: If BTC fails to reclaim $90,000, it may continue downward.
Conclusion
The chart signals a bearish trend continuation after breaking the neckline.
BTC could drop towards $70,000 unless buyers step in to regain momentum.
If BTC reclaims $90,000, the bearish scenario could be invalidated.

BTC - LONGAnother opportunity for BTC. We are at a 'Fear & Greed Index' of 21, there are no better moments. I believe the strong support is at 80k, down to a maximum of 75k. Maybe we'll be in the green again soon.

Broad View on Bitcoin - FxDollars - 26/02/2025Educational Analysis says BTCUSD may move DOWN from this range, according to my technical.
Broker - COINBASE
Because the BTCUSD pair showed some bullish weakness, it finally did liquidity, which was taken out on buy-side orders to show a sign of a downtrend, and I am looking to counter-trend this position.
Let's see what this pair brings to the table for us in the future.
Please check the comment section to see how this turned out.
DISCLAIMER:-
This is not an entry signal. THIS IS ONLY EDUCATIONAL PURPOSE ANALYSIS.
I have no concerns with your profit and loss from this analysis.
I HAVE NO CONCERNS WITH YOUR PROFIT OR LOSS,
Happy Trading, Fx Dollars.
BTC LONG Great entry opportunity, important support. I expect at least a bounce. After waiting for a long time, I believe we are finally in a good zone. Don't forget to protect the trade.

Bitcoin Overextended? Key Levels & 15-Min Chart Setup Revealed!📈 Bitcoin seems overextended right now. 🔑 In my opinion, it's testing key support levels. I'm watching for a retrace into the midpoint of the previous price swing for a potential short opportunity. 🎥 In the video, I break down key insights on the trend, market structure, and price action, and show exactly what I'm looking for on the 15-minute chart for an entry. 🚨 Not financial advice! 📉

Bitcoin BTC Breaking Structure? Key Levels & Trade Setup!👀 👉 In this video, we analyze Bitcoin (BTC) and its recent price action. The four-hour chart shows a bearish break of structure, and my short-term bias remains bearish. I'm waiting for a short entry, aiming for previous lows highlighted in the video. This is not financial advice.

#BTCUSDT maintains bearish momentum — expecting further decline!📉 SHORT BYBIT:BTCUSDT.P from $94,547.0
🛡 Stop Loss: $95,027.0
⏱️ 1H Timeframe
✅ Overview:
➡️ BYBIT:BTCUSDT.P is forming a downtrend after testing the resistance zone.
➡️ Volume Profile suggests that the main liquidity (POC) is positioned above the current price ($96,258.3), indicating volume distribution in favor of sellers.
➡️ A break below $94,830.7 will confirm buyer weakness and open the potential for further decline.
➡️ The $94,286.0 and $94,090.0 levels may act as profit-taking zones, while $93,900.0 is a key support level.
⚡️ Plan:
➡️ Short entry upon breaking $94,547.0, confirming further downside.
➡️ Stop-Loss at $95,027.0—placed above the nearest liquidity level to minimize risk.
➡️ Main targets are in the $94,286.0 – $93,900.0 zone, where a bounce is possible.
🎯 TP Targets:
💎 TP 1: $94,286.0
🔥 TP 2: $94,090.0
⚡️ TP 3: $93,900.0
🚀 BYBIT:BTCUSDT.P maintains bearish momentum—expecting further decline!
📢 BYBIT:BTCUSDT.P continues its downward movement. If the price consolidates below $94,547.0, this will strengthen selling pressure and accelerate movement toward $93,900.0.
📢 However, buying activity may emerge at this level, so partial profit-taking is recommended.

$BTC Daily UpdateCRYPTOCAP:BTC #BTC Back above $95,878 support, $97,780 resistance in effect, previous 1D closed with bullish engulfing, time to see if current daily can follow thru. RSI and MACD on 1D looks good with potential to test $99,361, with weekend approaching current weekly also looks pretty good, Current support at $95,878, continue watching given s/r.

Bitcoin (BTC/USD) - Bullish Setup with Key LevelsBTC/USD is currently trading around $95,700, showing signs of a potential bullish continuation. The recent consolidation suggests that buyers are absorbing supply before the next leg up.
Key Observations
• Bullish Structure: The price is forming a potential higher low near support (green trendline), indicating strength.
• Liquidity Grab & Reversal: A deeper pullback to the green support area could serve as a liquidity sweep before an impulsive move higher.
• Targeting All-Time Highs: If price follows the projected yellow path, we could see a rally toward the $117,857 - $120,000 resistance zone, aligning with the red trendline.
Trade Plan
• Wait for a pullback toward the lower trendline (~$90K - GETTEX:92K ).
• Look for bullish confirmations (rejection wicks, bullish engulfing, etc.) before entering.
• Target: $117,857 and possibly higher if momentum sustains.
⚠️ Risk Management: If BTC loses key support (green trendline), bullish momentum could weaken, requiring a reassessment of market conditions.

Bitcoin Trading Plan & Market Analysis🚀 In this breakdown, I outline my trading plan for Bitcoin (BTC), focusing on market structure, price action, and key liquidity dynamics.
🔍 Key Observations:
✅ Price Action & Liquidity Sweeps
* Bitcoin has been forming equal highs/lows, with dips below the lows targeting southside liquidity before rallying.
* On the 4-hour timeframe, this pattern has repeated multiple times—suggesting smart money accumulation at current levels.
✅ Confirmation Criteria
* My bullish thesis remains unconfirmed until we see:
* A decisive breakout of the current range.
* A successful retest and failure of that breakout level.
* If these conditions are met, I will be looking for buying opportunities.
✅ Final Confirmation
* A break of key resistance (highlighted in the video) is critical for confirming a trend reversal.
📺 Everything is explained in detail in the video—this is NOT financial advice!

Traders who followed my plan made a huge profit of 1500 pipsThis moment is exciting, happy, and incredible.
For traders who followed my plan and bought at 93500, the price of BTCUSD has reached 95500 at this moment, and the second target TP94800 I provided has been accurately reached. The traders who followed it have made a huge profit of 1500 points. This is a pleasing and incredible plan. I feel very happy and proud at this moment. This plan has helped me help more traders get huge profit returns. Great. Of course, I will continue to share my ideas and accurate trading plans here. Traders who think my plan is great, remember to stay tuned.
Mr. Baker
CRYPTO:BTCUSD INDEX:BTCUSD BINANCE:BTCUSDT.P BINANCE:BTCUSDT

Bitcoin is accelerating its decline, and a reversal opportunityComprehensive overall trend analysis shows that Bitcoin has experienced a single-day decline.
The opening of the US stock market in the evening accelerated the decline of Bitcoin
Currently, Bitcoin has fallen below the 95,000 mark. According to trend technical analysis,
Bitcoin has hit the short-term support level, and now we can plan to do long transactions
Bitcoin long plan:
Buy: 93,800-93,500
Closing: 94,500-94,800
Stop loss: 93,200
Mr. Baker
INDEX:BTCUSD CRYPTO:BTCUSD

BTC at a Crossroad, Is the Drop to $91K Closer Than You Think ?A few days ago, we accurately predicted the market movement before anyone else. The price rebounded from the trendline, fell to the resistance level that aligned with the resistance zone, and eventually broke through it.
Following this breakout, the price continued to decline, even breaking through the support level before quickly reversing. After the reversal, the price surged sharply to the resistance zone but soon began to fall again, breaking through the 100,500 resistance level in the process.
Later, Bitcoin dropped to the support level, which coincided with the support zone, and made an attempt to rise. However, it failed and pulled back to the 94,800 support level, where it traded for some time before bouncing back to the trendline.
Recently, the price turned around and resumed its downtrend.
Currently, I anticipate Bitcoin will rise to the trendline and then eventually fall below the support level. For this scenario, my target is set at 91,000, which lies below the support zone.
For more free strategies and trade updates, feel free to message me!

Bitcoin's Path to $100k USD&beyond - How much time is left?Don’t worry—we’re not here to debate whether the bull market top is in or still ahead. Based on cycle analysis, one thing is clear: Bitcoin is set to break $100K soon and continue its upward trajectory.
But the real question is: How much time do we have left?
Can we still make gains until the end of the year, or will March/April be the final window to profit?
🔹 Bitcoin’s Current Position
BTC is approaching its 60-day cycle low, with the 1-day, 3-day, and 1-week cycles all dipping below 20.
We’re waiting for the final bottom to form—historically, these moments offer some of the best buying opportunities.
🔸 Two Possible Scenarios Ahead:
1️⃣ Bull Market Peak in May 2025
The upcoming 2-week cycle top marks the end of the bull market (~May).
The 2-week cycle typically takes ~14 weeks to reach a peak, aligning with a late-May timeline.
After this, a 1.5-year bear market (~18 months) could begin, correcting the excess of this cycle.
2️⃣ Final Top in December/January
The market peaks at year-end, followed by a 12-month bear market.
This means a bloody summer, then a fast & bullish upside in Oct/Nov leading to a final peak.
This aligns with historical seasonality of previous cycles.
📌 Conclusion:
No matter which scenario plays out, the key is to maximize gains before the cycle peaks and exit before the bear market begins.
📈 Watch for the 60-day cycle bottom—this will be the key entry point.
Which scenario do you think will play out? Let me know in the comments! 👇🚀

#Bitcoin at a Crossroads: Is a Reversal or Just the Beginning?BYBIT:BTCUSDT.P is once again in the spotlight! The market is at a crossroads, and Bitcoin is deciding its next move. Recent weeks have shown volatility: sharp swings, battles for key levels, and attempts to hold critical zones.
💡 Key Metrics:
✔ Current Price: $95,472
✔ ATH: $109,356
✔ RSI: 45 – no clear overbought or oversold signals yet
✔ POC (Point of Control): $95,732 – we are near a major liquidity zone
🔥 What’s happening with #BTC?
Bitcoin previously tested the $102,000 area, but sellers took control and pushed the price down. BYBIT:BTCUSDT.P is now trading at a strong support level with high liquidity, making this zone crucial for future movements.
If BYBIT:BTCUSDT.P holds above $95,700, we could see a retest of $102,500 and higher. However, a breakdown below this level could lead to a move toward $92,000 or lower.
📉 Current Situation:
➡️ BYBIT:BTCUSDT.P continues testing the key $95,732 level, which serves as the POC (Point of Control) – the area with the highest liquidity and the most concentrated orders.
➡️ The price is consolidating at the lower boundary of the strong support zone $92,700 - $95,700. This level has held multiple times, but bearish pressure is increasing.
➡️ Resistance at $102,500 - $104,000 remains a crucial barrier for recovery.
⚡ Possible Scenarios:
📉 Bearish Scenario (Breakdown Below):
🔴 If BYBIT:BTCUSDT.P breaks and holds below $92,700, further downside movement is likely:
✅ Target 1: $88,000 – a previous area of strong buyer interest.
✅ Target 2: $84,500 – a critical support zone where a strong bounce may occur.
✅ If selling pressure continues, the next major support lies around $80,000.
📈 Bullish Scenario (Reversal Upwards):
🟢 If BYBIT:BTCUSDT.P holds above $95,700 and breaks $100,000, a strong upward impulse may follow:
✅ Target 1: $104,000 – the nearest key resistance.
✅ Target 2: $110,000 - $112,000 – an area where new local highs could be formed.
✅ A breakout above $115,000 would open the way for testing $120,000.
📌 Bitcoin is currently in a high-risk zone, where any move could trigger a strong breakout.
📌 For traders: Be cautious with short positions, as the $92,700 - $95,700 zone could induce a bounce.
📌 For long-term investors: Watch the price reaction at $92,700 – if this level holds, it may be a strong accumulation point.
📌 Risk Factor: If BYBIT:BTCUSDT.P breaks and consolidates below $92,700, bearish momentum could intensify, leading to further declines towards $88,000 and below.
🚀 # BYBIT:BTCUSDT.P is at a crossroads – be ready for a big move!

Is BTC Gearing Up for a Bullish Reversal? Here’s My Game Plan!👀 👉 In this video, we analyze BTC, which is currently rangebound. On the 4-hour chart, I’m noticing equal lows followed by a liquidity sweep, then a higher low and a higher high. If Bitcoin breaks above the current range high, I’ll be looking to buy. However, if it trades lower, breaks the range low, and fails a retest, a short setup would be more suitable. We’ll cover trend analysis, price action, market structure, and both bullish and bearish scenarios. Not financial advice.

BTC still has plenty of room to riseBTC 2nd impulse wave started after big abc correction. Aiming to reach all time high now.

$BTC Daily UpdateCRYPTOCAP:BTC #BTC Almost a week now consolidating between $100,334-$95,878 range, $95,878 support holding good, Current 1D candle looking good with some potential to test $99,361 resistance if closes with bullish engulfing today which is being formed as of now, RSI also with potential to turn bullish on 1d, $94,148 next support area, $91,357 key support, $102,280 support regain will bring $104,987 test. Watch Given S/R
