$BTC Daily UpdateCRYPTOCAP:BTC #BTC $63,544 testing, Beautiful push above $60,629 with a test, Current 4H looking bearish, RSI on 4H in overbought region while 1D looking good, support above $63,544-$64,344 will allow test of $66,323, $61,953 current support yet to be tested, watch given S/R
Btctrade

bitcoin analysisBe careful, by defeating a level and pullback to it, the next goal will be activated!

BTCUSD Bullish Robbery PlanMy Dear Robbers / Traders,
This is our master plan to Heist BTCUSD Market based on Thief Trading style Technical Analysis.. kindly please follow the plan I have mentioned in the chart focus on Long entry. Our target is Red Zone that is High risk Dangerous level, market is overbought / Consolidation / Trend Reversal at the level Bearish Robbers / Traders gain the strength. Be safe and be careful and Be rich.
Note: If you've got a lot of money you can get out right away otherwise you can join with a swing trade robbers and continue the heist plan, Use Trailing SL to protect our money.
Stop Loss : Recent Swing Low using 4h timeframe
Warning : Fundamental Analysis comes against our robbery plan. our plan will be ruined smash the Stop Loss. Don't Enter the market at the news update.
Loot and escape on the target 🎯 Swing Traders Plz Book the partial sum of money and wait for next breakout of dynamic level / Order block, Once it is cleared we can continue our heist plan to next new target.
support our robbery plan we can easily make money & take money 💰💵 Join your hands with US. Loot Everything in this market everyday make money easily with Thief Trading Style.

$BTC Daily UpdateCRYPTOCAP:BTC #BTC following up on previous 4H bullish close on current 4H, $59,788 testing, some resistance at $58,882 is also expected, RSI on 1D and 4H looks good, must gain support from $58,882 or it will retrace back to $56,557 test, $60,629 next key resistance, watch given S/R

BTC Short Hereas planned shorting every bounce also monday high taken and the german are ready to sell more will take profit on monday low it is first target and will move my sl to breakeven will watch the strength no idea who takes control invalidation daily close above 61000

QCP Analysts Say There Are Rally Signals in Bitcoin LONGWhile investors are trying to cope with the downward trend that has been going on for more than a month, Bitcoin is trying to withstand the German government's sales.
At this point, while analysts generally predict that the bottom may have come in Bitcoin or may come as soon as possible, an assessment came from Singapore-based crypto company QCP Capital.
Analysts stated that the market initially faltered in the face of Mt.Gox and the German government's Bitcoin sales, but then quickly recovered, listing the bullish signals.
At this point, he showed spot Bitcoin ETF entries as the first signal.
Stating that institutional investors increased their dip purchases, QCP analysts said that this situation was supported by strong spot BTC ETF inflows.
Analysts, who showed the purchase of BTC from exchanges in response to the sales of the German government as the second bullish signal, stated that less Bitcoin entered the market.
Finally, analysts stated that Bitcoin and Ethereum made higher bottoms this week after the sharp declines last week, and that the bottoms were purchased aggressively, and that these purchases were a bullish signal.

Btc.D - bitcoin liquidity is flowing into altcoins.if you like the idea, please "Like" it. This is the best "Thanks!" for the author 😊 P.S. Always do your own analysis before a trade. Put a stop loss. Fix profits in installments. Withdraw profits in fiat and please yourself and your friends.

Expired BTC.USD Weekly outlook. 1st WK JULY 2024Expired BTC.USD Weekly outlook. 1st WK JULY 2024
> BULLISH 📈 CORRECT
Closed Price: 61,627
Target Price: 62,375 | Strike Price: 63,643 on JULY 1, 2024
Upper Range: 68,784
Lower Range: 55,965

Bitcoin daily analytic we are planning and doing simple and practical live trading in Bitcoin use the simple strategy by set up your mind set first. thinking about how to be rich in a long term and start. if you know well enough this philosophy you would definitely can define it into the market buy reaching high standards of DCA strategy.
buying in deep of the market
use your regular saving monthly
avoiding from all manipulation aspect of the market like shitcoins and high leverages.
I described my mind set because it is important for people who follow me to see my analytics.
we are looking for bounce back around 53~49 and not selling before 70 zone

PO3 possibilities on BTCUSDTGeneral Overview
Time Frame: The chart displays price movements in a 1-hour (1h) timeframe.
Current Price: The current price of Bitcoin is around 57,619.99 USDT.
Previous Movements: There are two main downward trends followed by recovery movements evident on the chart.
Technical Analysis Elements
Descending Channels (Yellow Channels): The yellow descending channels indicate Bitcoin's downward trend.First Descending Channel: Represents a longer and broader downtrend.
Second Descending Channel: A shorter-term downtrend, followed by an upward movement in price.
Support and Resistance Levels (Horizontal Lines): Support Levels: Identified around 56,858.28 USDT and 53,400 USDT.
Resistance Levels: Identified around 58,379.08 USDT and 61,997.53 USDT.
Box Patterns: These indicate areas where the price has consolidated before breaking out. Each box shows that after a period of sideways movement, the price has broken either upwards or downwards.
Trend Lines and Moving Averages (Blue Lines): These lines determine the average movement of the price and the general trend direction. The blue line indicates that the price is recovering following a decline.
Potential Scenarios
Upward Scenario: If the price breaks the 58,379.08 USDT resistance level, the next target could be 61,997.53 USDT.
A movement toward 66,000 and 67,534.95 USDT levels may be observed if it holds above this level.
Downward Scenario: If the price drops below the 56,858.28 USDT support level, the next support could be at 53,400 USDT.
If this level is broken, a further decline to lower levels might occur.
Conclusion
This chart is used to analyze the short-term price movements of Bitcoin. Technical analysis attempts to predict future movements based on past price actions. Investors can use such charts to support their trading decisions. However, it's important to remember that cryptocurrency markets are highly volatile, and such analyses may not always yield accurate results.

BTC/USD Long watching out these levels closely, there are many chances and reason it could bounce from here!
#HODL #Bitcoin #BTC

BTC Bitcoin Technical Analysis and Trade Idea 👉🔍 In this video, we analyze BTC Bitcoin. It's evident that BTC has been showing strong bearish momentum in recent times. However, considering today is Friday, I anticipate a potentially sharp retracement as big money wind up their trades for the week and hit stops for liquidity. My strategy involves monitoring the 3-5m chart for signs of sideways movement and a potential reversal, which could present a scalp/day trade buying opportunity targeting the previous bearish imbalance.
It's important to note that these observations are speculative and not a definitive forecast. Confirming specific price movements is crucial before considering any buying or selling decisions, as elaborated in the video. The video provides a comprehensive analysis of the current trend, market structure, and price dynamics. Remember, this educational content is designed to enhance understanding and does not guarantee outcomes. Trading inherently involves substantial risks, so employing robust risk management techniques is essential. 📈🔔

$BTC Daily UpdateCRYPTOCAP:BTC #BTC $58,290 support in effect, next key support at $56,557 which was last tested on May 01, RSI on 4H in oversold region, approaching oversold region on 1D time-frame too. Second follow up today on bearish engulfing from Tuesday, must hold $56,557 support area to avoid $55,393 support test. $59,788 initial resistance from here, then $60,629-$61,674.

BTC is very bullish...Bitcoin, after breaking out with a 6-month candle, gave two green candles ahead! So you can imagine why the next 6 months are the most bullish!
#Bitcoin

BTC Bitcoin Technical Analysis and Trade Idea👉🔍 In this analysis of BTC Bitcoin, we examine higher time frame charts that show a bearish trend with a retracement into resistance. I anticipate a possible sell opportunity given that the market is overextended and trading into resistance. It’s crucial to understand that this is speculative and not a guaranteed forecast. Watching for specific price movements to confirm a buy or sell is essential, as explained in the video. This video offers a detailed look at the trend, market structure, and price action. Keep in mind, this content is for educational purposes only, and trading carries significant risk. Always use robust risk management strategies in your trading practices. 📈🔔

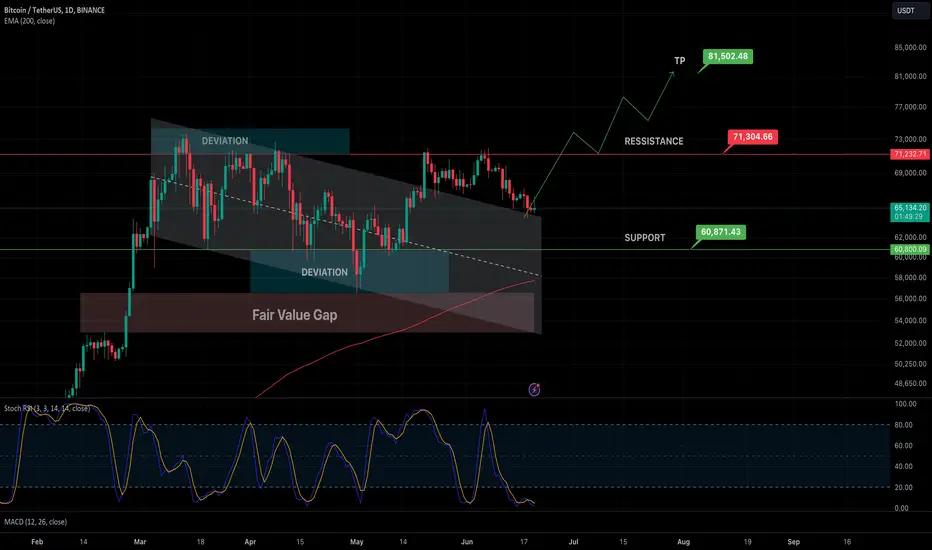
Chart Idea - BTC Swing Long for 6-8 weeksBTC looking bullish for next few weeks. It can certainly go and test $62k to $60k region. However, as per my TA, it's already hit the local bottom and need good bounce from here. Taking a swing long for next few weeks from FWB:65K on the basis of following confirmations.
Confirmations on Daily TF:
- Bull Flag Breakout and Retest
- 0.5 Fib Level Retracement at $64200 region
- Stoch RSI oversold at around 1 region
Trade Setup:
Entry: $65000
TP: $81500
SL: $59999
Bitcoin Next Move $72KBitcoin Easy To Move $72K.
Did you find this crypto market analysis helpful? Stay updated about the latest crypto market update. Please continue to follow my analysis and feel free to ask any queries, you may have. I am here to assist you. TradingView: @frmnCapital

$BTC symmetrical tringle bullish pattern?CRYPTOCAP:BTC is in a rising symmetrical triangle pattern. This is a bullish pattern that usually breaks in an uptrend. We might touch the resistance at the EMA 100 before reversing to the upside, so be patient.
The MACD is not reset yet, and the RSI is showing many divergences created by the unexpected selling pressure that could not be forecasted by the chart.
However, the signs of a reversal are present, assuming that the selling pressure will stop.
The CMF is at the bottom, showing fear, and since it cannot go lower, it should recover. The RSI on the daily is close to the bottom, indicating a soon reversal to the upside.
In case of continued selling pressure, an invalidation of the chart would bring the support to the EMA 200 at 58k. Let's hope that does not happen.

$BTC Daily UpdateCRYPTOCAP:BTC #BTC Testing $60,629 support, bearish engulfing forming on current 4H, RSI on 4H weakening and not looking good on 1D, $58,882 key support here which remains at risk, next key support at $56,557. $61,953 current resistance. Watch given S/R

BTC Bitcoin Technical Analysis and Trade Idea🔍 In this BTC Bitcoin analysis, we explore the higher time frame charts which currently indicate a bearish trend for Bitcoin. However, the price action on a 15m timeframe suggests a possible short term reversal. It's important to note that this is speculative and not a guaranteed forecast. It's prudent to watch for certain price movements to verify a genuine reversal. This video provides a close look at the trend, market structure, and price action. Remember, this content is for educational purposes only and trading carries significant risk. Always ensure you implement strong risk management strategies in your trading practices. 📈🔔

BTCUSDT LONG IDEA ! #BTC#BTC Army, here we go.
1:4.7 Risk to Reward
As always, Stay Safe and DYOR.
#TheHopinionist

BTC 2week trading strategy May 27- June 10No-need to hurry to enter the market until current futures contract expiration date on the 30th of May (vertical orange line). Also summer is usually not the best period for breakouts due to holiday season.
Best-case:
BTC price breaks through 69650 intraday resistance level confirming continuation of a short-term trend which started on the 1st of may (short violet dotted line). This trend will continue going upwards to break ATH or at least it will be transformed into a range between 66450 and 70500 before breaking ATH.
Base-case:
There will be a deeper pull-back to 64500, as a consolidation before ATH break. Overall the decline will be temporary and not too deep to break the medium-term trend which started on the 11th of Sep 2023 (long violet dotted line).
Worst-case:
Deeper pull-back to the current key supoprt zone (green rectangle) which will confirm that short-term and medium-term trends are over and the longer consolidation will be needed to break ATH (similiar to summer 2023).
Trading strategy:
Stop-limit at 69650 for the best-case scenario.
however entering the market with 1/3 of max risk per trade
limiting exposure to the worst-case of price locking in medium-term range (56500-72500)
preserving flexibility to make another entry for base-case in case of a deeper pull-back to 64800, or after ATH break-out at a higher price.
in case of the worst-case confirmed, reconsider whether it's still reasonable to hold the trade
stop-loss below 50000 for a black-swan event to protect deposit from margin call. It is highly unlikely that this stop-loss will be trigerred accidently for the coming two weeks.

Bitcoin next bounce zoneBTC got a rejection and its headed to retrace the fib .382 (62.5) zone. Let's see if its able to bounce from there until Monday - Tuesday OR earlier.
