BTC didn’t dump — it tapped.BTC reached into the 1H FVG and wicked just above the OB at 104,204 — delivering premium liquidity and then reversing.
Most are staring at red candles, but the real story is the reaction zone:
Price tagged the 0.618 level (104,559) with precision and reversed with displacement.
Now what?
We're mid-delivery. If BTC can reclaim 104,800–105,000 (mid OB/FVG confluence), a strong move into 105,865 is likely — potentially sweeping for external liquidity near 106k.
Execution Plan:
Entry: 104,600–104,700 range
SL: 104,200 or beneath 103,752 swing
TP1: 105,365
TP2: 106,000+
Key invalidation: clean break below 104,200 with volume
Bias: Bullish while above 104,200
Why: Fair Value Gap fill + OB + 0.618 convergence + responsive wick
This wasn’t a sell-off.
This was a setup.
Btctrade

BTC short term correction: zone 100k💎 BTC PLAN UPDATE (June 2)
NOTABLE NEWS ABOUT BTC:
Meta shareholders have decisively voted down a proposal to explore adding Bitcoin to the company’s balance sheet, signaling limited appetite for crypto exposure at the tech giant.
According to a regulatory filing dated May 28, the “Bitcoin treasury assessment” proposal garnered just 3.92 million votes in favor — representing a mere 0.08% of total shares — while nearly 5 billion votes against it.
Given that CEO Mark Zuckerberg holds 61% of Meta's voting power, as disclosed in an April filing, it is likely he played a pivotal role in rejecting the measure.
TECHNICAL ANALYSIS PERSPECTIVE
Bitcoin closed below the daily support level of $106,406 on Thursday and fell another 1.50% the following day. However, prices saw a slight recovery over the weekend. As of Monday's writing, BTC is trading below $105,500.
Assuming BTC faces resistance around the $106,406 daily level and continues correcting, it could extend the decline to retest the psychologically important $100,000 mark.
The Relative Strength Index (RSI) on the daily chart is at 53, trending down toward the neutral level of 50, indicating weakening bullish momentum. The Moving Average Convergence Divergence (MACD) also showed a bearish crossover last week. The increasing red histogram bars below the baseline further signal a potential correction ahead.
At this point, whether you are new or experienced, it’s advised to spend more time practicing and enhancing your knowledge of technical analysis. Consider exploring educational posts on the channel (…) to strengthen your foundation and avoid losses during this period.
==> This is a trend-based analysis for reference only. Wishing all investors successful trades!

Unmasking the "Intrinsic Value" Debate Between Gold vs BTCFool's Gold? Unmasking the "Intrinsic Value" Debate Between Gold and Bitcoin
The assertion is a familiar one, a well-worn cudgel in the ongoing debate between traditional assets and their digital counterparts: "Gold has intrinsic value that Bitcoin doesn't." This statement often serves as the bedrock for arguments championing the yellow metal's timeless appeal while dismissing cryptocurrency as mere speculative froth. But what if this foundational claim, this appeal to gold's inherent, undeniable worth, is built on shakier ground than its proponents believe? What if the very notion of "intrinsic value" as applied to these assets is a misunderstanding, a convenient narrative rather than an objective truth?
This exploration will journey into the heart of this debate, dissecting the concept of intrinsic value and examining how it truly applies – or doesn't – to both gold and Bitcoin. We will scrutinize gold's much-vaunted industrial utility against the backdrop of its vast above-ground stocks and its overwhelming monetary premium. We will consider whether value is indeed an inherent property of an object or a subjective judgment made by individuals. Ultimately, by challenging long-held assumptions, we aim to illuminate the real sources of value for both the ancient metal and the modern digital asset, moving beyond simplistic labels to a more nuanced understanding.
1. The Elusive Nature of "Intrinsic Value"
Before we can meaningfully discuss whether gold or Bitcoin possesses intrinsic value, we must grapple with the term itself. In the realm of corporate finance, "intrinsic value" refers to the fundamental worth of a company, derived from an analysis of its assets, earnings potential, cash flows, and overall financial health. It's an attempt to ascertain what a stock should be worth, independent of its fluctuating market price. This is the world of discounted cash flow models and balance sheet scrutiny.
However, this definition struggles when applied to commodities or currencies. Gold, like Bitcoin, does not generate cash flows. It doesn't pay dividends or have earnings reports. As one observer noted, gold and Bitcoin are commodities that have a spot price; their "value" is essentially what someone is willing to pay for them at a given moment. Companies, by contrast, can have an intrinsic value tied to the future economic benefits they are expected to produce for their owners.
So, when advocates claim gold has intrinsic value, they are often pointing to something else entirely. Usually, this encompasses its tangible, physical nature – you can hold it, feel its weight. It also refers to its historical use as money and a store of value over millennia. And crucially, it implies a baseline worth derived from its utility in practical applications, particularly in industry. One might even argue, as some have, that there is simply "no such thing as intrinsic value" in an absolute sense; value is not a property embedded within an object but is assigned to it by human beings.
2. Gold's Industrial Utility: A Gilded Facade?
The argument that gold's industrial use underpins its intrinsic value is perhaps the most frequently cited. "But it's used in microchips!" is a common, almost reflexive, defense. And it's true: gold's excellent conductivity, resistance to corrosion, and malleability make it a valuable component in high-end electronics, dentistry, aerospace, and certain medical applications. But the critical question is not whether gold has industrial uses, but how much these uses contribute to its overall market price.
Consider the data for a recent year, say 2024. Global industrial gold consumption was approximately 330 tonnes. However, a staggering 90% of this demand, around 297 tonnes, was met by recycling existing gold scrap, a process that can cost as little as tens of dollars per ounce. This leaves a mere 33 tonnes of new gold required from mining to satisfy the entirety of industrial needs not covered by recycling.
Now, compare this to the annual mine production. In that same year, about 3,700 tonnes of gold were newly extracted from the earth. This means that less than 1% (33 tonnes out of 3,700 tonnes) of all newly mined gold was actually needed for industrial purposes. The vast majority, over 99%, went elsewhere – primarily into jewelry, bars, and coins, all forms of value storage.
The disparity becomes even more dramatic when we consider the total above-ground stock of gold held for these value-storage purposes. This figure stands at roughly 184,000 tonnes. If, hypothetically, gold were to suddenly lose its allure as jewelry and its status as a monetary asset, and this colossal hoard were redirected to meet industrial needs (the 33 tonnes per year not covered by recycling), we would have enough gold to last for approximately 5,600 years at current industrial consumption rates. And this is without digging a single new ounce out of the ground. Much of this 184,000-tonne supply could potentially be acquired at prices far closer to the low cost of recycling than the current market price of newly mined gold.
As one commenter aptly put it, if gold's value was solely based on industrial demand, it "would be nearly worthless" compared to its current valuation. While gold does possess certain unique properties that make it useful, these applications are a drop in the ocean when explaining its price. The idea that its utility in microchips or dental fillings provides a significant "floor" for its value is, upon closer inspection, largely a myth.
3. The Towering Monetary Premium: Where Gold's Value Truly Lies
If industrial use accounts for such a tiny fraction of gold's demand and price, what explains the rest? The answer is its "monetary premium." This is the portion of an asset's price that exceeds its direct use-value as a commodity. For gold, this premium is immense, built over centuries of human history and cultural adoption.
Gold's journey as money began thousands of years ago. Its inherent characteristics – it doesn't rust or tarnish (durability), it's relatively rare (scarcity), it's easily recognizable and has a pleasing aesthetic (acceptability), it can be melted and reformed (divisibility and fungibility), and it's dense (portability of value) – made it a superior choice for a medium of exchange and store of value in pre-industrial societies. This long history has ingrained gold into the collective human consciousness as something inherently valuable. There's a certain "magical power," as one person described it, to the shiny yellow metal, a testament to its enduring legacy.
This historical precedent and the deep-seated belief in its enduring worth are what sustain gold's monetary premium. Central banks hold it in their reserves. Individuals purchase it in the form of jewelry (which, in many cultures, serves as a primary store of family wealth) and invest in bars and coins, not primarily for its practical applications, but because they trust it will preserve purchasing power or be desired by others in the future. This shared belief, this social consensus, is the bedrock of gold's value far more than its limited industrial applications. Some estimate this monetary premium to be as high as 90% of its total price, with the remaining 10% attributable to its use in jewelry and industry.
4. The Shifting Sands of Perceived Value
The notion that value is intrinsic and immutable is challenged by history itself. Value, as many economists and observers contend, is not an inherent property of an object but is determined by human perception and utility, which can and do change over time.
Consider aluminum. There was a time when aluminum was exceedingly rare and difficult to extract, making it more precious than gold. The capstone of the Washington Monument, completed in the late 19th century, was made of aluminum to signify its value and the technological prowess of the era. Today, thanks to advancements in refining processes, aluminum is abundant and inexpensive. We use it to wrap sandwiches, a far cry from its days as a "precious" metal adorning national monuments.
Similarly, Tyrian purple dye, derived from sea snails, was once so costly and labor-intensive to produce that its use was reserved for royalty and the highest echelons of society. It symbolized power and status. The invention of synthetic dyes in the 19th century made purple accessible to everyone, and the immense value once attached to the natural version evaporated.
These examples powerfully illustrate that what society deems valuable is not fixed. It is contingent on factors like scarcity (natural or artificial), the current state of technology, cultural significance, and collective human agreement. If gold's value is predominantly a monetary premium built on historical consensus and aesthetic appeal, then it too is subject to these shifting sands of human perception. The humorous desire to one day wrap sandwiches in gold foil, should it lose its monetary status, underscores this potential for radical revaluation.
5. Bitcoin's Utility: Solving Problems of the Digital Age
If gold's claim to "intrinsic value" through industrial use is tenuous, and its primary value stems from a historically constructed monetary premium, how does Bitcoin compare? Critics often dismiss Bitcoin as having no utility beyond speculation, a digital tulip mania. However, this perspective often overlooks the specific problems Bitcoin was designed to address and the unique properties it offers in the 21st century.
Bitcoin emerged in the wake of the 2008 financial crisis as a "peer-to-peer electronic cash system," aiming to provide an alternative to the traditional financial system. Its utility lies in its ability to offer:
• Decentralization: No single entity, corporation, or government controls the Bitcoin network. It operates on a distributed ledger (the blockchain) maintained by thousands of computers worldwide. This makes it resistant to control or shutdown by any central authority.
• Permissionless Access: Anyone with an internet connection can participate in the Bitcoin network – send, receive, and store value – without needing permission from a bank or government.
• Censorship Resistance: Once transactions are confirmed and added to the blockchain, they are extremely difficult to alter or reverse. This makes it a powerful tool for individuals in environments where financial censorship is a concern.
• Provable Scarcity: The Bitcoin protocol dictates that there will only ever be a maximum of 21 million bitcoins. This hard cap on supply is a fundamental aspect of its design, making it a verifiably scarce digital asset. This contrasts with gold, where new supply is continuously mined each year, estimated by some to be around 1.5-2% of the existing above-ground stock, arguably diluting its value over time.
• Portability and Divisibility: Bitcoin is incredibly portable. Vast sums can be "carried" on a tiny device or even memorized as a seed phrase, and transferred across the globe in minutes for relatively low fees. It is also highly divisible, down to one hundred millionth of a bitcoin (a "satoshi"), facilitating transactions of various sizes.
• Verifiability: The authenticity and transaction history of every bitcoin can be publicly verified on the blockchain, eliminating the need for trust in intermediaries for this purpose.
• Durability: As a digital asset secured by a vast, decentralized network, Bitcoin is highly durable as long as the network itself remains operational and secure.
A crucial real-world utility, highlighted by observers, is Bitcoin's ability to bypass capital controls. For individuals in countries with restrictive financial regimes, Bitcoin offers a means to transact and move value across borders with a degree of freedom not possible through traditional channels. This is not a speculative feature; it is a tangible benefit solving a real problem for many.
While the number of people using Bitcoin worldwide is still relatively small compared to users of traditional financial systems, its adoption is growing. Like any transformative technology, its utility is being discovered and leveraged by an expanding user base. Its "intrinsic value," if we are to use that term, lies in its capacity to fulfill these unique functions.
6. Gold vs. Bitcoin: A Clash of Properties
When we compare gold and Bitcoin based on properties often associated with a store of value or monetary good, distinct profiles emerge:
• Tangibility: Gold is physical; you can touch it. This offers a psychological comfort that some find reassuring. Bitcoin is digital; its existence is as code and ledger entries. Its "possession" is through control of cryptographic private keys.
• Industrial Utility: Gold has limited industrial uses that account for a tiny fraction of its price. Bitcoin's "industrial utility" is the operation of its network as a global system for value transfer and verification.
• Scarcity: Gold is naturally scarce, but its total earthly and cosmic abundance is unknown, and new supply is constantly mined. Bitcoin has absolute, programmable scarcity with a fixed supply cap.
• Portability: Moving large amounts of gold is cumbersome, expensive, and risky. Bitcoin is exceptionally portable.
• Divisibility: Gold can be physically divided, but it's not a seamless process. Bitcoin is easily and precisely divisible.
• Verifiability: Authenticating gold requires specialized knowledge and tools; it can be faked. Bitcoin transactions and holdings are verifiable with mathematical certainty on its public ledger.
• Durability: Gold is physically very durable. Bitcoin, as a digital protocol, is durable as long as its decentralized network is maintained and secured.
• Historical Precedent: Gold boasts millennia of use. Bitcoin is a little over a decade old, a mere infant by comparison.
• Censorship/Seizure Resistance: Physical gold can be, and has been, confiscated. Self-custodied Bitcoin, with properly secured private keys, is highly resistant to censorship and seizure.
This comparison reveals that while gold's strengths lie in its long history and physical presence, Bitcoin excels in areas like absolute scarcity, portability, divisibility, verifiability, and censorship resistance – attributes that are arguably increasingly valuable in an increasingly digital and interconnected global landscape.
7. The "Next Person" Fallacy and the Foundation of Value
A common critique leveled at both gold (for its monetary premium) and Bitcoin is that their value depends solely on "the next person being willing to buy it." In a sense, this is true for any asset that isn't consumed directly or doesn't produce cash flows. The value of a collectible, a piece of art, or indeed a monetary good, is ultimately what someone else is prepared to exchange for it.
However, this doesn't mean their value is arbitrary or baseless. The willingness of the "next person" to buy is predicated on a shared understanding or belief in the asset's desirable properties and its potential to retain or increase its value. For gold, this belief is built on thousands of years of tradition and its perceived enduring qualities. For Bitcoin, this belief is growing based on its unique technological attributes, its potential to solve modern financial problems, and its emerging network effects. The more people who recognize and utilize these properties, the stronger the shared belief, and thus the more robust its value becomes.
8. The Cost of Production and the Illusion of a Price Floor
Some argue that gold's price cannot fall below its cost of extraction, suggesting this provides a natural price floor. While it's true that miners would cease operations if the price fell below their production costs for a sustained period, this argument largely ignores the colossal 184,000 tonnes of gold already above ground and held primarily for monetary or aesthetic purposes. If this massive hoard were to lose its monetary premium and be dumped onto the market, the price could plummet dramatically, far below current mining costs, until it reached a level where industrial demand (or perhaps a new, much lower equilibrium for aesthetic use) could absorb it. Much of this existing stock could be made available at recycling costs, which are significantly lower than mining costs. The "cost of production" floor applies primarily to newly added supply, not to the revaluation of existing, hoarded stock.
Conclusion: Beyond Intrinsic – Value in Utility and Belief
The debate over whether gold has "intrinsic value" that Bitcoin lacks often misses the mark by clinging to a nebulous and misapplied concept. If "intrinsic value" refers to a baseline worth derived from non-monetary, practical utility, then gold's claim is surprisingly weak. Its industrial applications are minimal compared to its price, which is overwhelmingly a monetary premium built on centuries of human belief, cultural acceptance, and its historical role as money.
Value, ultimately, is not an inherent property magically residing within an object. It is a subjective judgment made by individuals, a reflection of an asset's perceived utility and the collective belief in its future desirability. Gold has served humanity well as a store of value due to a set of physical properties that were optimal for pre-digital eras. Bitcoin, a product of the digital age, offers a different set of properties – provable scarcity, decentralization, censorship resistance, and unparalleled portability – that address the challenges and opportunities of our modern world.
Neither gold's sheen nor Bitcoin's bits possess a mystical "intrinsic value" independent of human perception and use. Gold's value is rooted in its long history and the enduring human affinity for its beauty and permanence. Bitcoin's burgeoning value is rooted in its innovative technology and its potential to offer a new paradigm for money and value transfer. Both are valuable because, and only because, people believe them to be. The critical difference lies in the reasons for that belief and the problems each asset is perceived to solve. As the world continues to evolve, so too will our understanding and assignment of value.

BTCUSDT Price Analysis – Potential Drop Incoming! 🔲 Chart Zones
🟥 Resistance Zone (~111,000–112,000):
Price has touched this zone multiple times and failed to break higher – this is a strong resistance area. 🚫📈
🟪 Support Zone (~101,000–102,000):
A historically strong demand area where price previously bounced up. 💪📉
🔍 Current Price Behavior
📊 Price Level: Around 108,666.66
🔄 The chart shows lower highs forming, indicating weakening bullish momentum.
📉 Bearish projection drawn (blue zigzag line) suggests a potential double top forming below resistance.
📉 What’s Expected?
🔵 Big Drop Alert! ⬇️
If the price fails to break above and gets rejected again, the chart predicts a sharp move down toward the support zone.
🎯 Target Area: ~101,000–102,000 (Support zone)
📌 Summary
🧱 Resistance holding strong
💤 Momentum slowing down
⚠️ Bearish move likely
🏹 Targeting support zone for potential bounce
⚠️ Trading Tip 🧠
Watch for confirmation before entering trades! A break below the recent lows could trigger a short opportunity, while a bounce near support could offer a buy setup. 🛑📈

BTC isn’t bearish. It’s just collecting fuelPrice didn’t fail — it paused.
BTC retraced into the 0.382–0.5 zone after rejecting from the local high, and what looks like weakness to most is actually compression — perfectly staged above a clean 1D OB and nested FVG.
Below the current level sits the real opportunity: the imbalance between 102.4K–100.1K, backed by a 1D demand zone and high-volume support. If Smart Money wants to rebalance before the next leg, that’s where they’ll do it.
The path is simple:
Sweep into the 100.5K–102.4K zone
React off the OB
Expand to rebalance the FVG at 106.2K
Displace toward the next draw: 110.5K (final inefficiency + liquidity shelf)
Only a close below 96.9K changes the macro intent.
Execution mindset:
🔑 Optimal long: 100.5K–102.4K (OB/FVG zone)
🎯 Target 1: 106.2K
🎯 Target 2: 110.5K
❌ Invalidation: Full body close below 96.9K — structure must reset
Most traders chase the move.
I wait where Smart Money needs to act.
I’m not reacting. I’m positioned.

BTCUSD BREAK SUPPORT LEVEL AND WENT TO DOWN TRENDHere I Created This BTCUSD Chart Analysis
Pair : BTCUSD (BITCOIN)
Timeframe: 1 - Hour
Pattern: Breakout
Momentum: Bearish / Sell
Entry Limit : Sell 106200
Resistance zone : 106600
Target Will Be : 104000
Disclaimer : This signal is based on personal analysis for learning purposes. Trade at your own risk and always use proper risk management.

BTCUSDT Analysis: Bullish Intent Building on Higher TimeframesTaking a look at BTCUSDT. My analysis points to this current level as a significant support zone, with my overall target being higher.
While the low timeframe (LTF) action hasn't yet shown a strong influx of buyers, the picture on the higher timeframes is quite compelling. The upward movement we're seeing there is displaying solid support, indicating sustained buying interest at a larger scale.
This divergence between the LTF and HTF suggests a potential build-up of bullish momentum. We might see some consolidation or sideways movement on the lower timeframes as buyers accumulate before a more decisive push upwards.
As always, I'm keeping a close eye on the volume footprint. The sustained buying volume on the higher timeframes lends credence to this bullish outlook. I'll be waiting for the low timeframe to catch up, looking for those clear signs of buyer entry – breakouts above smaller resistances with increasing volume, and successful retests as support. CDV (Cumulative Delta Volume) on both timeframes will also be crucial in confirming this directional bias.
Remember, I focus on coins showing sudden and significant increases in volume, and while the immediate LTF might be quiet, the HTF volume profile is definitely noteworthy here.
My bias for BTCUSDT right now is upwards, given the supportive structure on the higher timeframes. However, as always, I'll be waiting for that low timeframe confirmation before considering any entries. Patience and confirmation are key, even when the higher timeframe picture looks promising. Let's see if the lower timeframes will soon echo the bullish intent we're seeing on the higher ones.
📌I keep my charts clean and simple because I believe clarity leads to better decisions.
📌My approach is built on years of experience and a solid track record. I don’t claim to know it all but I’m confident in my ability to spot high-probability setups.
📌If you would like to learn how to use the heatmap, cumulative volume delta and volume footprint techniques that I use below to determine very accurate demand regions, you can send me a private message. I help anyone who wants it completely free of charge.
🔑I have a long list of my proven technique below:
🎯 ZENUSDT.P: Patience & Profitability | %230 Reaction from the Sniper Entry
🐶 DOGEUSDT.P: Next Move
🎨 RENDERUSDT.P: Opportunity of the Month
💎 ETHUSDT.P: Where to Retrace
🟢 BNBUSDT.P: Potential Surge
📊 BTC Dominance: Reaction Zone
🌊 WAVESUSDT.P: Demand Zone Potential
🟣 UNIUSDT.P: Long-Term Trade
🔵 XRPUSDT.P: Entry Zones
🔗 LINKUSDT.P: Follow The River
📈 BTCUSDT.P: Two Key Demand Zones
🟩 POLUSDT: Bullish Momentum
🌟 PENDLEUSDT.P: Where Opportunity Meets Precision
🔥 BTCUSDT.P: Liquidation of Highly Leveraged Longs
🌊 SOLUSDT.P: SOL's Dip - Your Opportunity
🐸 1000PEPEUSDT.P: Prime Bounce Zone Unlocked
🚀 ETHUSDT.P: Set to Explode - Don't Miss This Game Changer
🤖 IQUSDT: Smart Plan
⚡️ PONDUSDT: A Trade Not Taken Is Better Than a Losing One
💼 STMXUSDT: 2 Buying Areas
🐢 TURBOUSDT: Buy Zones and Buyer Presence
🌍 ICPUSDT.P: Massive Upside Potential | Check the Trade Update For Seeing Results
🟠 IDEXUSDT: Spot Buy Area | %26 Profit if You Trade with MSB
📌 USUALUSDT: Buyers Are Active + %70 Profit in Total
🌟 FORTHUSDT: Sniper Entry +%26 Reaction
🐳 QKCUSDT: Sniper Entry +%57 Reaction
📊 BTC.D: Retest of Key Area Highly Likely
📊 XNOUSDT %80 Reaction with a Simple Blue Box!
📊 BELUSDT Amazing %120 Reaction!
📊 Simple Red Box, Extraordinary Results
📊 TIAUSDT | Still No Buyers—Maintaining a Bearish Outlook
📊 OGNUSDT | One of Today’s Highest Volume Gainers – +32.44%
📊 TRXUSDT - I Do My Thing Again
I stopped adding to the list because it's kinda tiring to add 5-10 charts in every move but you can check my profile and see that it goes on..

BTC breakout soon and return to ATH💎 Update Plan BTC (May 29)
Notable news about BTC:
The overall cryptocurrency market capitalization has remained relatively stable over the past 24 hours, hovering near the $3.42 trillion level. Digital assets appear largely indifferent to the recent rally in equities, as gains in traditional markets are driven by corporate earnings and tariff-related developments rather than shifts in monetary policy or liquidity conditions. Meanwhile, the US Dollar is strengthening for a third consecutive session, adding further pressure.
Bitcoin (BTC) has pulled back from the upper end of its recent trading range near $110,000, settling closer to the $107,000 mark. This pause near previous highs has helped ease short-term market overheating. As institutional participation in Bitcoin deepens, its price behavior is increasingly mirroring that of traditional financial instruments like equities and commodities—marked by more tempered momentum and fewer fear-driven surges.
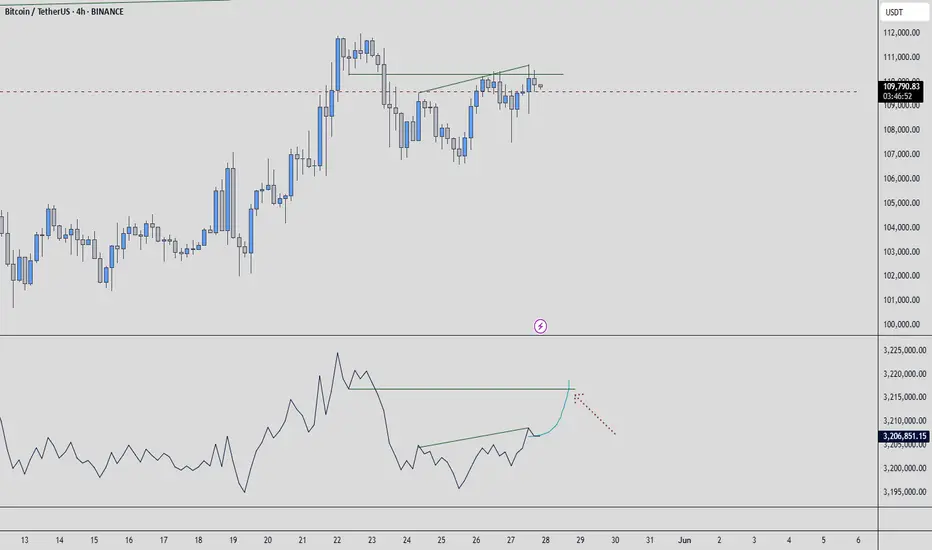
Technical analysis angle
It is still a 107k bumper area that brings profits to Buyer. But the worrying thing here is that the vertices of BTC are lower.
We will have two scenarios for BTC:
) First within the next 1 week, the organizers still go in this flag model and gradually narrow towards the top. If the price line follows this model, it will be negative for BTC and investors
) Secondly: BTC price will breakout area 109k, the target will go straight to 113k-115k and lower boundary if Breakout area 107k will return to 102k-100k
🔥BTC 4H is currently in the adjustment phase, this time will cause a lot of traders, Future - Margin to lose money, this rhythm will last long
At this time, whether new or old, should spend more time to practice, load more knowledge about the PTKT, as well as find knowledge posts at the channel ..., to strengthen the solid foundation, as well as avoid losing money at this time offline
==> Comments for trend reference. Wishing investors successfully trading

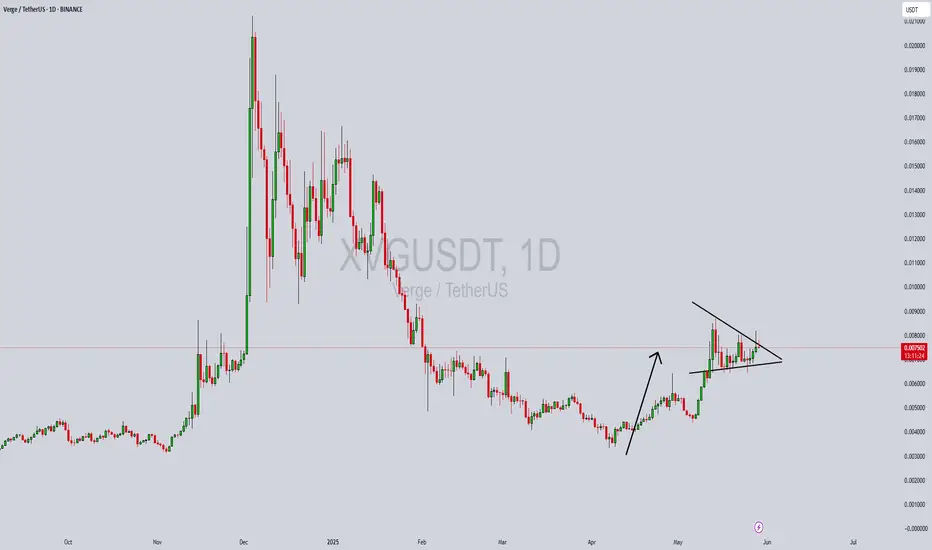
XVGUSDT Forming Bullish PennantXVGUSDT is currently showcasing a bullish pennant formation—a continuation pattern that typically signals the resumption of a strong uptrend. This pattern forms after a sharp upward move, followed by a period of consolidation, which is now evident in XVG’s price action. With the pennant nearing its breakout point and volume starting to pick up, the probability of an upward breakout is increasing significantly.
This setup often draws the attention of traders and investors, especially when paired with rising volume and solid project fundamentals. The consolidation within the pennant suggests accumulation, while the narrowing structure indicates that a volatility expansion may be imminent. If price breaks above the pennant resistance with confirmation from volume, XVG could realistically achieve a 40% to 50% move in the short to medium term.
Market sentiment around XVG is improving, as it's regaining attention due to increasing on-chain activity and renewed interest from long-term holders. The bullish pennant, when forming in a broader market recovery or bullish environment, can act as a strong springboard for price. Traders looking for technical breakouts are already watching this pair for a potential entry setup.
With investor confidence growing and XVG forming a powerful bullish pattern, this crypto pair holds strong upside potential. Keep a close eye on the breakout level, as a decisive move above it could mark the beginning of a significant rally.
✅ Show your support by hitting the like button and
✅ Leaving a comment below! (What is You opinion about this Coin)
Your feedback and engagement keep me inspired to share more insightful market analysis with you!
UNIUSDT Forming Bullish Wave UNIUSDT is exhibiting a compelling bullish wave formation, rebounding robustly from a well-established support level. This resurgence is underpinned by a notable increase in trading volume, signaling heightened investor interest and potential for significant upward movement. The current market dynamics suggest a favorable environment for UNI, with technical indicators aligning to support a bullish outlook.
Trading Lounge
+7
The Currency Analytics
+7
Reddit
+7
The recent price action has seen UNI reclaim key support zones, demonstrating resilience and the capacity for sustained growth. Technical analyses indicate that if UNI maintains its trajectory, it could achieve gains in the range of 150% to 160%, targeting resistance levels that have previously acted as significant price ceilings. The convergence of increased volume and positive price movement often precedes substantial rallies, and UNI appears poised to capitalize on this momentum.
Investors are increasingly attentive to UNI's performance, recognizing the potential for substantial returns. The current setup offers an attractive risk-reward ratio, particularly for traders seeking to leverage the anticipated bullish wave. As UNI continues to garner attention, its market position strengthens, further validating the optimistic projections surrounding its price movement.
In summary, UNIUSDT's technical indicators and market sentiment coalesce to present a promising opportunity for traders and investors alike. The alignment of a bullish wave pattern, reinforced by strong support and escalating volume, underscores the potential for significant price appreciation in the near term.
✅ Show your support by hitting the like button and
✅ Leaving a comment below! (What is You opinion about this Coin)
Your feedback and engagement keep me inspired to share more insightful market analysis with you!

BTC CMA 92,000BTC CMA 92,000
We are currently at a temporary peak and strong, but not final, selling zone. We have a price gap reaching 92k, and a strong reversal to it is expected. Stay tuned for any new updates.

#BTC/USDT#BTC
The price is moving within a descending channel on the 1-hour frame, adhering well to it, and is on its way to breaking it strongly upwards and retesting it.
We are seeing a rebound from the lower boundary of the descending channel, this support at 106792.
We have a downtrend on the RSI indicator that is about to break and retest, supporting the upward trend.
We are looking for stability above the 100 moving average.
Entry price: 107234
First target: 108262
Second target: 109748
Third target: 111298

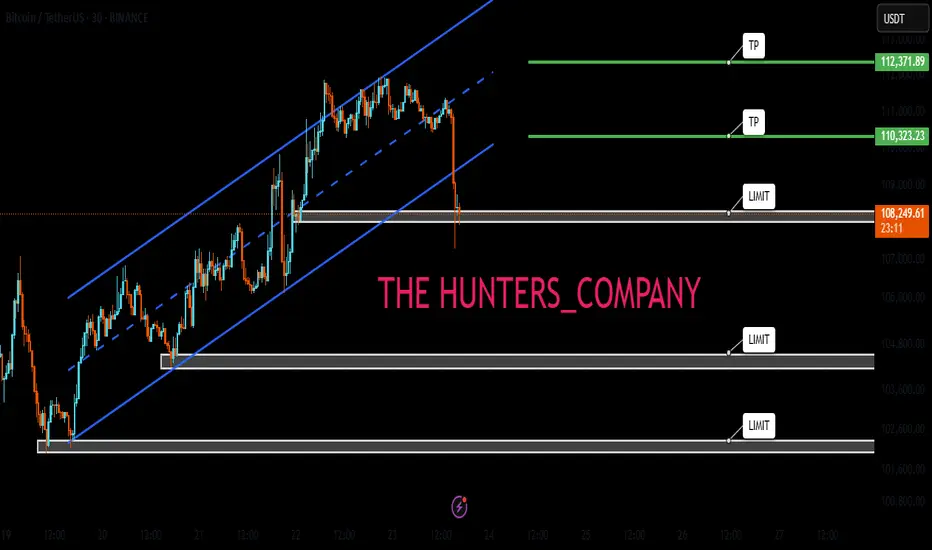
BTC/USDT Technical Analysis and Trade Idea📉 BTC Pullback or Full Reversal? Let's Break It Down 🔍
Looking at the Bitcoin chart right now, we’re seeing more than just a minor pullback. On the 30-minute timeframe, there’s a clear bearish market structure shift setting in. In my opinion, this isn't a quick dip before continuation — we may be in for a deeper retracement. 🧐
When we overlay NASDAQ (which Bitcoin is often closely correlated with), it becomes even clearer — tech stocks look overextended and are showing signs of a potential pullback. 📉
So here’s the plan:
If BTC pulls back into my point of interest, I’ll be watching for a bullish break of structure to consider a long position. Simple, structured, and in line with what the charts are telling us. 🔁💹
⚠️ As always, this is not financial advice — just sharing how I'm reading the market right now.
💬 What are your thoughts? Are you watching the same levels? Drop a comment below 👇 and let’s talk trade setups! 🚀

#BTC/USD The Uptrend is still intact! Here's Why!BTC Daily Close Update
Bitcoin closed at $108,951, marking another failed attempt to break through the $111K resistance.
It’s been nearly 8 days of consolidation just below this level. That’s not ideal, and it signals we may need a fresh catalyst to push higher.
Not bearish, just cautious.
As long as the blue EMA holds on the daily, the uptrend remains intact.
Still watching for a move toward $117K.
DYOR, NFA
Please show your support with your likes.
Thank you
#PEACE
BTCUSDT | No Rejection Yet, Higher Targets in SightThe current price action is still leaning bullish. We haven’t seen a sharp rejection or breakdown from key structure — and until that happens, I expect the move to stretch toward the 107,600 region.
Volume remains consistent, and there’s subtle support in the lower timeframes. Buyers are holding their ground, and as long as that continues, the path of least resistance remains up.
Wait for price to disprove the idea before abandoning it. That’s how you stay ahead.
📌I keep my charts clean and simple because I believe clarity leads to better decisions.
📌My approach is built on years of experience and a solid track record. I don’t claim to know it all but I’m confident in my ability to spot high-probability setups.
📌If you would like to learn how to use the heatmap, cumulative volume delta and volume footprint techniques that I use below to determine very accurate demand regions, you can send me a private message. I help anyone who wants it completely free of charge.
🔑I have a long list of my proven technique below:
🎯 ZENUSDT.P: Patience & Profitability | %230 Reaction from the Sniper Entry
🐶 DOGEUSDT.P: Next Move
🎨 RENDERUSDT.P: Opportunity of the Month
💎 ETHUSDT.P: Where to Retrace
🟢 BNBUSDT.P: Potential Surge
📊 BTC Dominance: Reaction Zone
🌊 WAVESUSDT.P: Demand Zone Potential
🟣 UNIUSDT.P: Long-Term Trade
🔵 XRPUSDT.P: Entry Zones
🔗 LINKUSDT.P: Follow The River
📈 BTCUSDT.P: Two Key Demand Zones
🟩 POLUSDT: Bullish Momentum
🌟 PENDLEUSDT.P: Where Opportunity Meets Precision
🔥 BTCUSDT.P: Liquidation of Highly Leveraged Longs
🌊 SOLUSDT.P: SOL's Dip - Your Opportunity
🐸 1000PEPEUSDT.P: Prime Bounce Zone Unlocked
🚀 ETHUSDT.P: Set to Explode - Don't Miss This Game Changer
🤖 IQUSDT: Smart Plan
⚡️ PONDUSDT: A Trade Not Taken Is Better Than a Losing One
💼 STMXUSDT: 2 Buying Areas
🐢 TURBOUSDT: Buy Zones and Buyer Presence
🌍 ICPUSDT.P: Massive Upside Potential | Check the Trade Update For Seeing Results
🟠 IDEXUSDT: Spot Buy Area | %26 Profit if You Trade with MSB
📌 USUALUSDT: Buyers Are Active + %70 Profit in Total
🌟 FORTHUSDT: Sniper Entry +%26 Reaction
🐳 QKCUSDT: Sniper Entry +%57 Reaction
📊 BTC.D: Retest of Key Area Highly Likely
📊 XNOUSDT %80 Reaction with a Simple Blue Box!
📊 BELUSDT Amazing %120 Reaction!
📊 Simple Red Box, Extraordinary Results
📊 TIAUSDT | Still No Buyers—Maintaining a Bearish Outlook
📊 OGNUSDT | One of Today’s Highest Volume Gainers – +32.44%
I stopped adding to the list because it's kinda tiring to add 5-10 charts in every move but you can check my profile and see that it goes on..
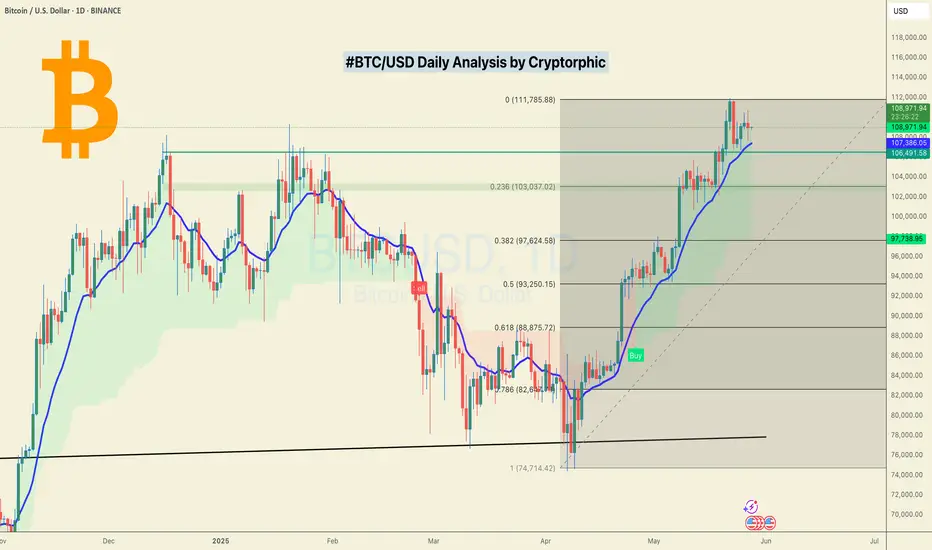
Bitcoin: Will it surpass $109k in its upward trend?Since April, Bitcoin has traded in a clearly defined upward channel with two lower and upper trend lines. This channel was formed three touchpoints both on the lower and upper trendlines.
Near a critical zone
Now, BTC is at a key resistance zone where it previously peaked around $109,000, holding its all-time high. This level resists both judgement as well as forensic level significantly of a psychological barrier because it was the peak of the last major bull cycle. The price is currently hovering around the everyday resistance line while BTC is still in the upward channel. In conjunction with the historic all-time high and the upper channel resistance, range bound price action gives us an accurate capture of BTC’s behaviour.
Bullish breakout
The scenario outlined for this resistance zone makes the most sense as a rejection may lead to a temporary pullback, likely to the somewhat lower boundary of the rising channel. This in itself would not be the termination of the bullish trend, but instead a healthy retracement within the confines of an uptrend structure. But, if the market does break out above the $109,000 level with ample volume and bullish momentum, then things could start changing in the market for the better from there. Such breakout will confirm the uptrend is strong and valid where else new breakout targets will also be set turning the old high into new low. The $109,000 level would then probably move from resistance to support, making it a critical area for bulls to protect on any retests in the future.
A bearish breakout
The ramifications of a breakdown below the rising channel should also be understood by traders. It is crucial to keep an eye on the channel's lower barrier, which is presently at about $104,000. A significant decline below this level would signal a loss of short-term bullish momentum and lead to a more thorough correction. In that scenario, Bitcoin would probably go for the imbalanced area between $97,500 and $100,500, where the price has previously moved quickly without forming any solid support or resistance. Buyers may be able to intervene in this zone and try to restore bullish dominance, which may pave the way for a new breakout attempt and another surge toward the $109,000 barrier.
Conclusion
In conclusion, Bitcoin is at a critical point right now. Bitcoin is currently facing a significant resistance zone at its prior all-time high, but the upward channel that has directed price action since April is still in place. The degree of market momentum and the actions of buyers and sellers at these critical levels will determine whether the price hits new highs or declines. Investors and traders should be alert and ready for both situations since the next action could determine how Bitcoin develops over the following few weeks.
I appreciate your help.
To ensure you do not miss the upcoming analysis, be sure to follow me!
Please leave a remark and a like!

BITCOIN SIGNALS (DON'T MISS)Hello friends
Given the good price growth we had, you can see that the price has entered a correction and has provided us with a good opportunity to buy in steps in the specified support areas (of course with capital management)
The targets have also been specified...
*Trade safely with us*
bitcoin on bearish#BTCUSD price have shown reverse trend which will drop below 106k.
Firstly we await for drop below 109300 for sell, Target 106k, SL 110151
But if prices move above 110151 Firstly then it will reach 110747 which will decline to head bearish.
Bullish is not valid yet.
#BTC

New BTC ATH, National FOMO💎 Update Plan BTC (May 22)
Notable news about BTC:
Gold prices climbed over 0.50% on renewed safe-haven demand, holding firm above the $3,300 threshold as investor anxiety grows ahead of the U.S. tax bill vote and mounting geopolitical tensions in the Middle East. At the time of writing, XAU/USD trades around $3,317, rebounding from an intraday low of $3,285.
Sentiment remains fragile, with U.S. equity markets slipping into negative territory and Treasury yields ticking higher. All eyes are on the impending vote on President Trump’s tax reform proposal, which the Congressional Budget Office (CBO) estimates could inflate the national debt by approximately $3.8 trillion. Uncertainty around the fiscal outlook continues to fuel demand for gold as a defensive asset.
Technical analysis angle
The question that investors most interested now is when BTC will have 120k?
After the breakdown of channel structure increases around the 108k area, the 113k landmark is the most expected milestone before the price approaches 120k
We still expect a slight adjustment to 108k to continue Long and Target are still 113k and 120k
🔥BTC 4H is currently in the adjustment phase, this time will cause a lot of traders, Future - Margin to lose money, this beat will last until 23-25/5
At this time, whether new or old, should spend more time to practice, load more knowledge about the PTKT, as well as find knowledge posts at the channel ..., to strengthen the solid foundation, as well as avoid losing money at this time offline
==> Comments for trend reference. Wishing investors successfully trading

BTC/USD Bullish Setup: Double Bottom Breakout Targeting $110,000 Trade Setup Analysis
1. Support & Resistance Zones
Support Zone (Buy Zone):
Highlighted in purple, between $103,764 and $104,633, with a noted stop loss area near $104,061.
Resistance/Target Zone (Take Profit Area):
Around $109,878 – $110,002 labeled as “EA TARGET POINT”.
2. Double Bottom Pattern (Bullish Signal)
There are two orange circles at the bottom, indicating a double bottom pattern—often a bullish reversal signal.
This is supported by a neckline break near the entry point at $104,534.
3. Moving Averages
Two moving averages are displayed:
Likely a short-term MA (red) and a medium/long-term MA (blue).
The price crossing above both suggests bullish momentum.
4. Trade Plan
Entry Point: Around $104,534
Stop Loss: Below $104,061
Take Profit (Target): $109,878 – $110,002
Risk/Reward Ratio: High, given the tight stop and wide target.
📈 Price Projection
The blue arrowed path suggests:
A minor dip or consolidation near $104,534, followed by a strong upward move toward the target zone.
The movement outlines a classic cup-and-handle or double-bottom breakout pattern.
🧠 Conclusion
This is a bullish trading setup for BTC/USD with a favorable risk-reward ratio. The chart suggests:
Buying near $104,534
Stop loss just below support
Targeting a move to ~$110,000

Bitcoin Overextended? Watch These Key Levels for the Next Move!BTC/USDT 1H – Retrace Before the Next Leg? 🚦
Bitcoin has shown impressive strength recently. On the 1-hour chart the current price action looks overextended 📈. After a strong impulsive move up, we’re seeing signs of exhaustion, with price stalling near the $111,800 region. Liquidity appears thin on the buy side, and there’s a cluster of potential sell stops resting below the current high in the form of sell stop.
I’m anticipating a retrace into the Fibonacci zone, with key levels at the 50% - 61.8% retracement. This area aligns with previous consolidation and could act as a magnet for price, especially as liquidity is swept from late long positions. If we see price rotate and break structure bullishly at my point of interest, I’ll be looking for a long entry opportunity. 🔄
Fundamentals & Macro Backdrop 🌍
On the fundamental side, Bitcoin remains sensitive to macroeconomic and geopolitical developments. Ongoing uncertainty in global politics and central bank policy continues to drive volatility across risk assets. Bitcoin’s correlation with tech stocks and the NASDAQ remains significant—recent data shows that when the NASDAQ pulls back, Bitcoin often follows suit. If we see a correction in tech stocks, be prepared for a retrace in BTC as well. 📉
Institutional interest is still strong, but short-term sentiment is cautious as traders await clarity on inflation, interest rates, and regulatory news. Keep an eye on U.S. economic data releases and any major headlines out of Washington or global hotspots, as these can quickly shift risk appetite.
Fundamentals and macro news remain key drivers—stay nimble!
Let’s see if BTC can reload for another leg up, or if broader market weakness drags it lower. Trade safe! 🚀

BTC Creating THIS Pattern Right Now – 108K Next?#BTC is forming a powerful pattern right now! 📊
Are we about to witness the breakout that takes us to **108K**? ⏰
Watch closely – the market's heating up! 🔥
#Bitcoin #Crypto #BullRun #BTC108K

BTCUSDT | Chasing in Euphoria? Here’s the Smarter MoveI’ve watched BTC explode during rallies like this, and trust me, finding low-timeframe entries in euphoria is a trap for most. The move looks unstoppable… until it isn't.
Right now, I’m only considering a 1R risk from the green box support . No more. No less. The risk is calculated, not emotional.
If you’re thinking of jumping in recklessly, don’t.
I’ll be watching the 1-minute timeframe closely for a clean upward break before doing anything. No confirmation, no trade.
Reminder:
“I will not insist on my short idea. If the levels suddenly break upwards and do not give a downward break in the low time frame, I will not evaluate it. If they break upwards with volume and give a retest, I will look long.”
Most people don’t know how to think like this. That’s why they lose.
You’re here to win, and I’m here to guide you.
📌I keep my charts clean and simple because I believe clarity leads to better decisions.
📌My approach is built on years of experience and a solid track record. I don’t claim to know it all but I’m confident in my ability to spot high-probability setups.
📌If you would like to learn how to use the heatmap, cumulative volume delta and volume footprint techniques that I use below to determine very accurate demand regions, you can send me a private message. I help anyone who wants it completely free of charge.
🔑I have a long list of my proven technique below:
🎯 ZENUSDT.P: Patience & Profitability | %230 Reaction from the Sniper Entry
🐶 DOGEUSDT.P: Next Move
🎨 RENDERUSDT.P: Opportunity of the Month
💎 ETHUSDT.P: Where to Retrace
🟢 BNBUSDT.P: Potential Surge
📊 BTC Dominance: Reaction Zone
🌊 WAVESUSDT.P: Demand Zone Potential
🟣 UNIUSDT.P: Long-Term Trade
🔵 XRPUSDT.P: Entry Zones
🔗 LINKUSDT.P: Follow The River
📈 BTCUSDT.P: Two Key Demand Zones
🟩 POLUSDT: Bullish Momentum
🌟 PENDLEUSDT.P: Where Opportunity Meets Precision
🔥 BTCUSDT.P: Liquidation of Highly Leveraged Longs
🌊 SOLUSDT.P: SOL's Dip - Your Opportunity
🐸 1000PEPEUSDT.P: Prime Bounce Zone Unlocked
🚀 ETHUSDT.P: Set to Explode - Don't Miss This Game Changer
🤖 IQUSDT: Smart Plan
⚡️ PONDUSDT: A Trade Not Taken Is Better Than a Losing One
💼 STMXUSDT: 2 Buying Areas
🐢 TURBOUSDT: Buy Zones and Buyer Presence
🌍 ICPUSDT.P: Massive Upside Potential | Check the Trade Update For Seeing Results
🟠 IDEXUSDT: Spot Buy Area | %26 Profit if You Trade with MSB
📌 USUALUSDT: Buyers Are Active + %70 Profit in Total
🌟 FORTHUSDT: Sniper Entry +%26 Reaction
🐳 QKCUSDT: Sniper Entry +%57 Reaction
📊 BTC.D: Retest of Key Area Highly Likely
📊 XNOUSDT %80 Reaction with a Simple Blue Box!
📊 BELUSDT Amazing %120 Reaction!
📊 Simple Red Box, Extraordinary Results
I stopped adding to the list because it's kinda tiring to add 5-10 charts in every move but you can check my profile and see that it goes on..
