BTCUSDTHi snipers. On the one-day timeframe, we are witnessing the formation of a harmonic pattern called a flag. This pattern usually forms in the middle of a trend and then the previous trend continues. The flag consists of two parts: a bar and a flag. In the flag, the price is moving in a channel between two parallel lines. If the price breaks through and crosses the upper ceiling of the channel, we will probably reach new prices. I am practicing and learning. This is not a buy or sell offer.
Btctrading

Setup: Entry at $108,658 with Target at $98,815 and Stop Loss at1. Entry Point: 108,658
This is where the trader expects to enter a short position.
Price is projected to reverse near this level.
2. Stop Loss: 110,341
Located above the entry point.
If price hits this level, the short trade is invalidated, limiting losses.
3. Target (Take Profit): 98,815
This is the EA Target Point, about 9,714 points (~8.94%) below the entry.
Represents a favorable risk-reward ratio.
---
🔄 Trade Idea Summary
Trade Type: Short (Sell)
Risk: ~1,683 points (110,341 - 108,658)
Reward: ~9,843 points (108,658 - 98,815)
Risk-Reward Ratio: ~1:5.85 (which is strong)
---
📊 Technical Indicators in Use
Moving Averages:
Likely 50-period (red) and 200-period (blue) MAs.
The 50 MA is below the price, indicating short-term bullishness.
However, the trade idea goes against this short-term trend, suggesting a reversal strategy.
---
🔍 Interpretation & Strategy
This chart implies the trader expects resistance near 108,658, possibly due to historical highs or supply zones.
The bearish outlook expects a significant drop to 98,815, possibly supported by macro patterns (like head & shoulders, or bearish divergence—not shown here but could be inferred).
The purple zones highlight high-probability reversal or reaction areas (support/resistance zones).
---
⚠️ Things to Watch
Invalidation: If price closes above 110,341 on a 4H/1D chart, the trade setup fails.
Confirmation: A strong bearish candlestick at or near the entry zone would strengthen the case.
Market Context: News, economic data, or BTC ETF inflows/outflows can quickly invalidate technical setups.

Bitcoin Bounce Alert: Holding the $100K Fortress! 📉 Market Context & Technical Levels
Key support at ~$100K: As the chart shows and multiple analysts confirm, this level continues to act as a strong defence zone. Cointelegraph noted bulls have been “defending the $100K key support level strongly,” triggering bounces during dips
Descending channel overhead: Bitcoin has retraced into a downward channel. A clean breakout above ~107K–109K (past recent peaks) is needed to signal a bullish shift .
Liquidity target at ~106K: Plenty of orders await in that region—flipping it to support may pave the way for another push higher .
📊 Indicators & Momentum
RSI dip near 25 during the latest drop indicates oversold conditions—often a precursor to rebounds
.
Volume surge on rebounds suggests absorbing sell pressure and strong accumulation interest at lower levels.
🚩 Key Price Zones to Watch
Level Significance
$100K Crucial support; losing it risks a slide toward $95K–97K or even $92K
.
$105K–106K Liquidity zone; flipping here as support could confirm upward momentum .
$107K–109K Resistance from channel tops and prior highs; a successful break is key to next leg up .
$112K–$112K+ If breakout occurs, upside targets extend toward prior ATH near $112K and beyond .
🎯 Chart Analysis Summary
Your chart shows three distinct bounces from the $100K–100.7K supply zone (highlighted in blue) and the latest one includes a sharp wick and rebound. This aligns with broader market dynamics emphasizing support at $100K and building liquidity at $106K. The arrow projection signals a probable retest of ~106K, with room to challenge ~107–109K after consolidation.
🧭 Trade Outlook
Bullish scenario: Hold above $100K → reclaim $106K → trendline breakout → potential rally to $112K+.
Bearish risk: Fails support at $100K → breakdown toward $95K–92K region.
📌 Bottom Line
Support $100K is alive and well. Bounces have been crisp and volume-backed.
Next test lies at $105–106K. That’s the battleground—flip it, and we may see bitcoin reclaim recent highs.
Watch the channel overhead (~107K–109K). A breakout could open the door to fresh records.
✅ Conclusion: BTC is defending its psychological base firmly. If this zone holds once more, the path to $106K and beyond is in focus. Breaking above demands conviction, but it’s the pivot to watch.

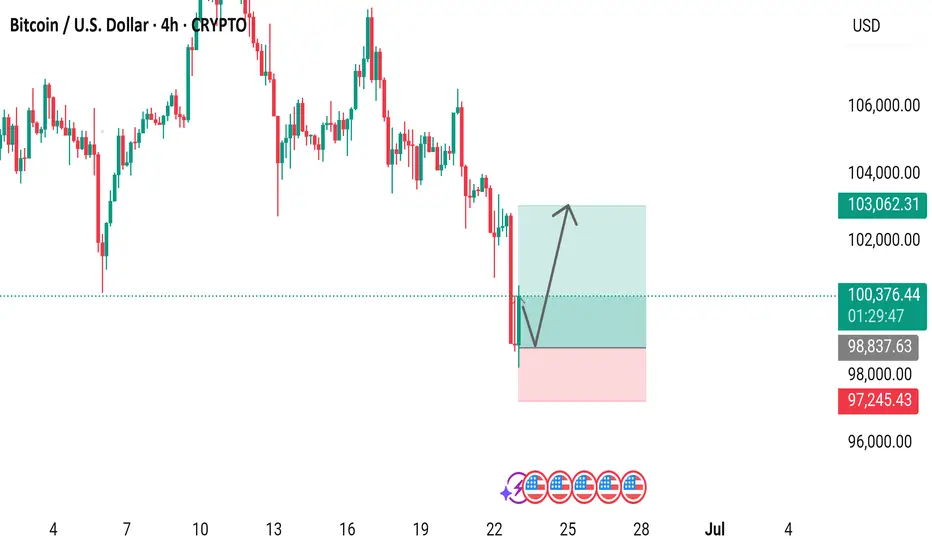
Bitcoin Price Analysis: Potential Rebound Ahead?4-hour Bitcoin price chart reveals a potential rebound opportunity. After a sharp decline, the price has stabilized around $97,245.43, forming a support level. The green and red box annotations suggest a possible price range breakout, with an upward arrow indicating a potential price increase. The current price stands at $100,461.58, down 1.63% from its recent peak. Will Bitcoin bounce back or continue its downward trend?
Bitcoin Daily, Something for the weekend Sir / Madame ?This will be the main chart and 3 indicators that could be telling us something.
Main chart is the Heiken Ashi. Each candle starts in the centre of the previous one and so we get rid of noise and get a good understanding of possible Trends.
And Right now, CALM is not the word ! Candles are getting smaller and smaller.
However, we do seem to be forming a bullish pennant with an Apex at the end of the month.
PA always reacts before the Apex.
Other things to note here is that we are now using the previous line of resistance as support. Look back to Dec 2024 to Feb 2025. It was this line that put as back down to 75K
We have tested this 4 times in a small way But not in a real Meaningful Way yet.
Do remain Cautious.......but that 2.518 Fib extension should hold us in place if we drop but there could be a much deeper drop.
But lets take this step by step as there are some Very Bullish signs to.
The ADX chart below shows us that Change is near.
Remember, ADX ( yellow ) NEVER shows trend direction, just trend strength. As you can see, it rarely drops much further below this point and does not spend to long here.
SO, current trend is Weak and a new trend is likely in the near future ( this could be tomorrow or in 3 weeks..near future is a wide window..but it is not 2 months or more)
The DI + ( orange ), positive Directional price Index, and the DI - ( red) , negative Directional price Index, are also low, showing no real price action.
This can happen for longer periods of time and it is impossible to say which will rise, However, as we can see, the price movements have not been huge and so to expect a sudden Massive Dive, as some are suggesting, is not really backed by anything.
But we should never say never. Be cautious
Accumulation / Distribution chart below
What is nice about this, is simply that Accumulation is still the MAJOR movement. The majority are still accumulating and so the idea that we maybe in a Bear market is almost Dismissed. People would not accumulate an asset that is about to Dive for a long eriod of time....Normally.
There has been distribution, as marked by the RED zones. This is heavier distribution and as you can see, this Stopped at the beginning of this month, having begun when we reached the high towards end of 2024.
So many thought that was cycle ATH
They have seen the error of their ways BUT, Again, remain Cautious till we see a bigger move higher.
And now my favorite, MACD
And for me, this is where we will see the decision being made. We are approaching the Neutral zone
Last time we bounced off this area was in October 2024 and we went from 70K to 109K
BUT remain cautious, we have every possibility that we may fall through the neutral zone for a while too....But we are in an area that could show us a time to move.
This is a LINEAR Bitcoin Daily chart
And those descending lines are FIB Circles and you can see how PA often runs along them.
You can also see how we are in a Pinch, a tight Squeeze right now ( arrow) with Horizontal line of support and the rejecting red 236 Fib circle.
That Apex is, again, at the end of the month.
So, to conclude, we are certainly heading towards a Move and possibly a new trend.
I like to think this will be Bullish but there are plenty f reasons for Caution.
I will remain with my Monthly charts that suggest June may be RED and that after than we will see more Green.
A Dip is possible and I have New Buy orders around 98K incase PA wicks down to them but there is NO guarantee this will happen...OR if it does, that it will stop there....
We just have to be prepared.
Stay safe

$BTCUSDT Eyes $120K After Key Support BounceBTCUSDT is holding strong above the ascending trendline and key support near $104K.
A fresh bounce suggests bullish momentum, with potential to break the $110K resistance.
If that happens, the next target could be around $120K. Trend remains bullish above support.
DYRO, NFA

Bitcoin (BTC/USD) 2-Hour Candlestick Chart2-hour candlestick price movement of Bitcoin (BTC) against the U.S. Dollar (USD) as of June 20, 2025. The current price is $106,004.49, reflecting a 2-hour increase of $1,317.33 (+1.26%). The chart highlights a recent upward trend with a support level around $105,082.06 and resistance near $108,009.17. A shaded area indicates a potential price range, with a bullish projection suggested by the overlaid trendline.

BTC/USDT Long Trade Setup – 1H Chart AnalysisBTC/USDT Long Trade Setup – 1H Chart Analysis
BINANCE:BTCUSDT
Hello traders! Sharing a recent long entry I took on Bitcoin (BTC/USDT) based on price action and liquidity concepts. This trade is taken on the 1-hour timeframe and aligns with my strategy of combining liquidity sweeps, support zones, and market structure shifts.
---
🔍 Trade Overview:
Entry Price: 104,704 USDT
Stop Loss: 103,660 USDT
Take Profit (Target): 108,349 USDT
Risk-to-Reward Ratio (RRR): Approximately 1:3
---
🧠 Trade Idea Behind the Entry:
As you can see on the chart, BTC had been in a downtrend and recently made a strong move into a key liquidity zone. This zone had previously seen multiple touches and rejections, making it an area of interest for both buyers and sellers.
The price swept liquidity below the previous low (labelled as “Liquidity Sweep $$$”), grabbing stop losses of early buyers and triggering limit orders of smart money. This move into the liquidity zone was followed by a strong bullish reaction – a signal that buyers may be stepping in.
Additionally, the "Break of Structure" (BOS) confirms a potential shift in market direction. The reaction from the liquidity zone indicates that this level is holding as new support.
---
🛠️ Why I Took the Trade:
1. Liquidity Sweep: The wick that pierced the liquidity zone signals stop-hunting and accumulation. These moves often precede a strong reversal.
2. Demand Zone Reaction: After the sweep, the candle closed bullish inside the demand box. This shows buyer strength.
3. Risk Management: The stop loss is set just below the liquidity zone to protect from deeper sweeps while keeping the RR healthy.
4. High Probability Target: The target is placed near the next resistance level around 108,349, which also aligns with a clean imbalance that price may want to fill.
---
📊 Technical Confidence:
Confluence Factors:
✅ Liquidity sweep
✅ Demand zone reaction
✅ Market structure shift
✅ High RR
✅ No immediate resistance till target
This type of setup reflects smart money behavior – first pushing price below structure to grab liquidity and then reversing sharply. The bullish momentum after the sweep gave extra confirmation.
---
🧭 What I’m Watching Now:
I will continue monitoring how price reacts around the 105,500–106,000 range. If momentum continues with higher highs and higher lows, I may trail my stop loss to lock in profits.
---
Let me know what you think of this setup! Have you taken a similar trade or are you waiting for confirmation? Drop your thoughts or charts below 👇
Stay disciplined, manage your risk, and trust the process. 🚀
#Bitcoin #BTCUSD #PriceAction #LiquiditySweep #SmartMoney #CryptoTrading #TradingSetup #TechnicalAnalysis #TradeJournal

W pattern off the handle. #Bitcoin to 168K.From my most recent post of the Cup & Handle I see a W pattern. Price broke out of the handle to retest to confirm support creating a double bottom.
This is a very good sign to confirm the C&H for this bullish near future.
If we continue upwards and break the psychological resistance zone at 111K, I expect 168K within 3-6 months.
I attached the Cup and Handle analysis to the current.

BTC/USD Potential Reversal & Bullish Breakout SetupBTC/USD Potential Reversal & Bullish Breakout Setup 🔄🚀
Technical Analysis Overview:
🔹 Pattern Formation:
The chart displays a potential Triple Bottom pattern (🟠), a classic reversal signal forming at the $104,870–$100,000 support zone 🛡️. This structure suggests a strong base is being established for a potential upside move.
🔹 Support Zone:
📉 The price has consistently bounced off the major support area around $100,000–$104,870, indicating strong buying interest.
🔹 Resistance Zone:
📊 The key resistance level lies around the $114,000–$115,000 range 🔵, which has been tested multiple times in the past (🔴 arrows) and could act as a future profit target.
🔹 Price Action & Projection:
Currently, price is trading near $107,025 and is showing signs of bullish continuation after forming a higher low. If the price consolidates above the $104,870 zone and holds support, we could see a potential breakout targeting the $114,000 resistance 📈.
📌 Key Takeaways:
✅ Triple Bottom formation signals trend reversal.
🔄 Bullish structure confirmed above $104,870.
🎯 Next target: $114,000 if breakout holds.
⚠️ Watch for potential consolidation before continuation.

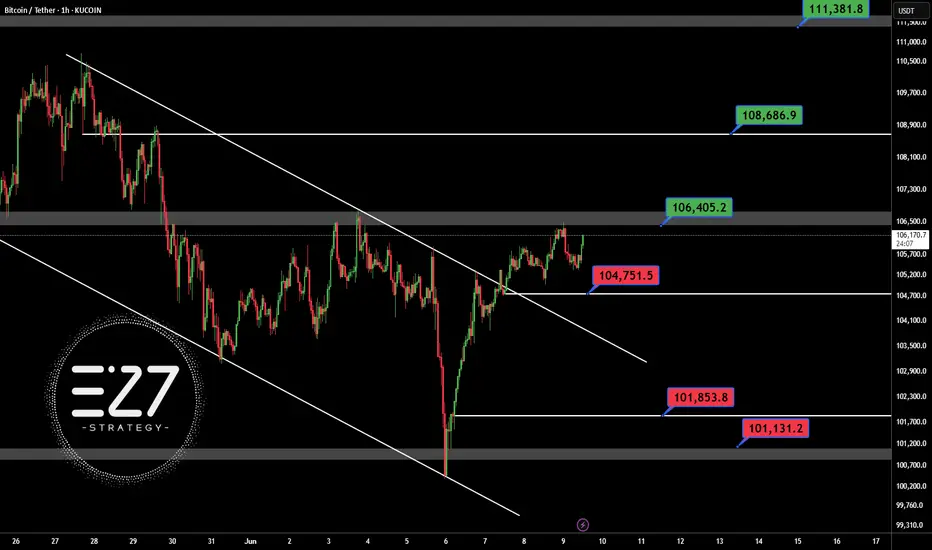
BTCUSDTSafe for open long position in BINANCE:BTCUSDT abow 106.400$ in H1 time frame.
First support: 104.750$
Best support: 101.850 - 101.131 $
First resistance: 106.400$
Best target this chart: 108.700 - 111.381$
Contol money management
#BTC/USDT#BTC
The price is moving within a descending channel on the 1-hour frame, adhering well to it, and is heading for a strong breakout and retest.
We are experiencing a rebound from the lower boundary of the descending channel. This support is at 108883.
We have a downtrend on the RSI indicator that is about to be broken and retested, supporting the upward trend.
We are looking for stability above the 100 Moving Average.
Entry price: 109380
First target: 109948
Second target: 110800
Third target: 111670

BTC 4H – Critical Support Zones Being TestedCRYPTOCAP:BTC is currently retesting its $107.2k support, which has now turned into resistance after a decisive breakdown.
Support Levels to Watch:
- Upper Support Zone: $105k – $104.4k
- Lower Support Zone: $101.4k – $100.7k
Bounce from $104.4k–$105k will be a temporary relief, but it needs strength to reclaim $107.2k.
If the upper zone is not held, the next leg will be towards the lower zone, near $101.4k—$100.7k.
Breakout confirmation only above $110k (previous rejection zone).
The market is showing signs of weakness, especially with increased selling around resistance. Avoid rushing into trades—better setups may come if key zones hold or break.
Tip: Watch for bullish divergences or strong volume at the lower support for potential reversal setups.

Bitcoin Approaches Resistance as Momentum Cools: What’s Next?Bitcoin has been on a strong upward trend 🚀, but recent moves show signs of exhaustion as it approaches major resistance zones 🛑. The appearance of a three-drive pattern on the 4-hour chart, suggests the market could be due for a healthy correction 🔄. While the broader trend remains bullish, I'm watching for a potential pullback and then looking for renewed strength (bullish BoS) before considering new long positions. Patience and confirmation are key in these conditions! 👀✨

BTC Testing Major Resistance >>> Rejection Likely?Hi guys!
Did you see my last analysis about Btc? Let's break it down more!
Bitcoin is now testing a major resistance zone around $106.8K, where a descending trendline has already pushed the price down several times.
This area could act as a reversal point again. If BTC fails to break above, we might see a move down toward $102.2K — a strong support level from earlier this month.
Right now, the market is showing signs of weakness near resistance, so this could be a good spot to watch for a short setup — unless bulls step in with strong volume and break out cleanly.
attention to these levels:
Resistance: $106.8K (trendline + supply zone)
Support target: $102.2K
Outlook: Bearish unless breakout confirmed

Will BTCUSD see $90,000 ever again? Phoenix FX mid term analysisBTCUSD 4-Hour Outlook: The Week Ahead
🔴 Key Resistance Zones
First Resistance
$107 000–$108 500
Recent swing highs where price stalled before the last leg down. Clearing and closing above $105 000 on the 4H would open the door toward this zone.
Final Resistance
$111 000–$113 000 (If broken expect a run to $115,000)
The all-time-high area. Heavy sell-side liquidity lives here and past price action shows repeated FVG fills and wicks into this region.
🔵 Critical Support & Buy Zones
Discount Buy Zone:
$92 000–$89 000 (50% at $89 150)
A deeper weekly FVG and longer-term trend support. The ultimate “buy the dip” area if the premium zone gives way.
Premium Buy Zone:
$100 000 – $99 000 (50% at $99 450)
A 4H Fair Value Gap that aligns with our higher-timeframe trend support. The recent bounce here signals strength—and a possible launchpad back into resistance.
📊 Weekly Price Action Scenarios
Bullish Theory:
If BTC can close cleanly above $105 000 on the 4H, look for a run into $107 000–$108 500 (First Resistance). A follow-through push could then target $111 000–$113 000 (Final Resistance) by week’s end with a potential further move to $115 000 where the 8 year trend will be tested again.
Bearish Theory:
Failure to reclaim $105 000, or a clear rejection in the $107 000–$108 500 zone, could usher in a retest of the Premium Buy Zone (~$100 000). A break below $99 000 would shift focus toward the Discount Buy Zone around $92 000–$89 000.
💡 Trade Ideas for the Week
Potential Long Ideas
Entry: 4H candle close above $105 000
Targets: First take-profit at $108 500; stretch target $112 000–$113 000
Stop-Loss: Below $103 000
Zone Re-Entry Long
Entry: Bullish 4H candle close in $100 000–$99 000
Targets: $107 000 then $112 000
Stop-Loss: Below $97 500
Potential Short Ideas
Entry: Bearish price action (e.g., engulfing candle or wick rejection) in $107 000–$108 500
Targets: $100 000→$92 000
Stop-Loss: Above $109 000
Just a Heads-Up:
This is my take on the charts—not gospel, not financial advice, and definitely not a crystal ball 🔮.
Trading is part skill, part patience, and part “what just happened?” 😅
We all see things a little differently, and that’s the beauty of it.
So if you’ve got a hot take, wild theory, or just want to drop some chart wisdom—hit the comments!
Let’s grow, learn, and laugh through the madness together. 🚀📈
Each one, teach one.
— Phoenix FX Team 🔥🦅

btc on selling#BTCUSD price have recorrect above 105600 showing bullish range, now we need price to fall to cover the projection.
Sell Below 105545, take profit 103555, Stop loss 106360.
Possible closure on current H1 above 106360 will break the next zone 106900-107200.

$BTC UpdateCRYPTOCAP:BTC #BTC $104,987 support in effect, previous weekly closed with bearish engulfing, 4h closed with bullish engulfing - current 4H trying to follow thru. $107,461 support needed to push for $110,423 resistance, and then the new ATH. $103,093 current support, $99,361 key support from here. Watch given S/R

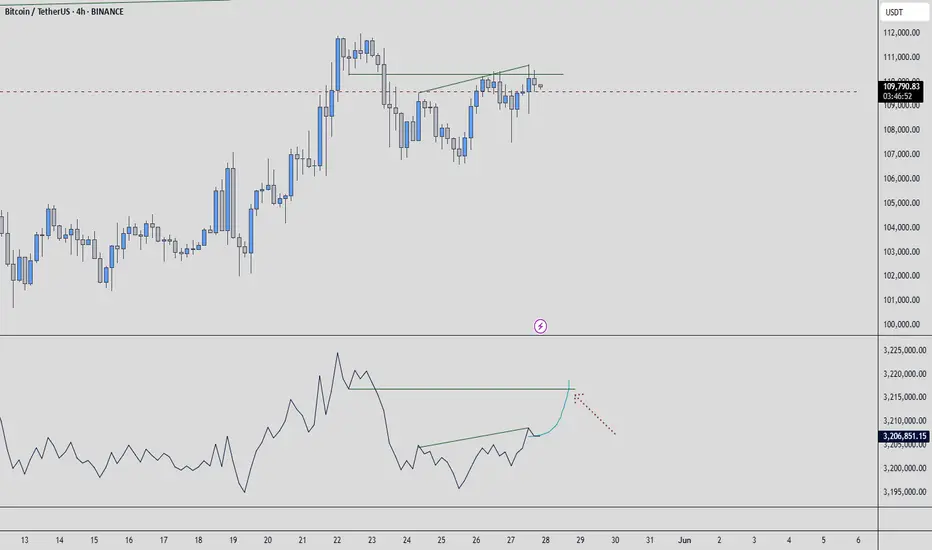
BTCUSDT Price Analysis – Potential Drop Incoming! 🔲 Chart Zones
🟥 Resistance Zone (~111,000–112,000):
Price has touched this zone multiple times and failed to break higher – this is a strong resistance area. 🚫📈
🟪 Support Zone (~101,000–102,000):
A historically strong demand area where price previously bounced up. 💪📉
🔍 Current Price Behavior
📊 Price Level: Around 108,666.66
🔄 The chart shows lower highs forming, indicating weakening bullish momentum.
📉 Bearish projection drawn (blue zigzag line) suggests a potential double top forming below resistance.
📉 What’s Expected?
🔵 Big Drop Alert! ⬇️
If the price fails to break above and gets rejected again, the chart predicts a sharp move down toward the support zone.
🎯 Target Area: ~101,000–102,000 (Support zone)
📌 Summary
🧱 Resistance holding strong
💤 Momentum slowing down
⚠️ Bearish move likely
🏹 Targeting support zone for potential bounce
⚠️ Trading Tip 🧠
Watch for confirmation before entering trades! A break below the recent lows could trigger a short opportunity, while a bounce near support could offer a buy setup. 🛑📈

Solana Long entry After a 100% move to the upside Solana is slowly cooling off its run and heading back down to some key areas of support .
In this video I highlight where I think those reaction zones are and what I expect to see Long term from Solana .
Set alerts and be sure to monitor BTC which will give you the additional confluence of understanding why the alt coins are behaving Bearish/bullish.
Tools used in this video TR Pocket / Fibs / Volume Profile /
Any Questions feel free to ask in the comments

BTCUSD BREAK SUPPORT LEVEL AND WENT TO DOWN TRENDHere I Created This BTCUSD Chart Analysis
Pair : BTCUSD (BITCOIN)
Timeframe: 1 - Hour
Pattern: Breakout
Momentum: Bearish / Sell
Entry Limit : Sell 106200
Resistance zone : 106600
Target Will Be : 104000
Disclaimer : This signal is based on personal analysis for learning purposes. Trade at your own risk and always use proper risk management.

BTCUSDT Analysis: Bullish Intent Building on Higher TimeframesTaking a look at BTCUSDT. My analysis points to this current level as a significant support zone, with my overall target being higher.
While the low timeframe (LTF) action hasn't yet shown a strong influx of buyers, the picture on the higher timeframes is quite compelling. The upward movement we're seeing there is displaying solid support, indicating sustained buying interest at a larger scale.
This divergence between the LTF and HTF suggests a potential build-up of bullish momentum. We might see some consolidation or sideways movement on the lower timeframes as buyers accumulate before a more decisive push upwards.
As always, I'm keeping a close eye on the volume footprint. The sustained buying volume on the higher timeframes lends credence to this bullish outlook. I'll be waiting for the low timeframe to catch up, looking for those clear signs of buyer entry – breakouts above smaller resistances with increasing volume, and successful retests as support. CDV (Cumulative Delta Volume) on both timeframes will also be crucial in confirming this directional bias.
Remember, I focus on coins showing sudden and significant increases in volume, and while the immediate LTF might be quiet, the HTF volume profile is definitely noteworthy here.
My bias for BTCUSDT right now is upwards, given the supportive structure on the higher timeframes. However, as always, I'll be waiting for that low timeframe confirmation before considering any entries. Patience and confirmation are key, even when the higher timeframe picture looks promising. Let's see if the lower timeframes will soon echo the bullish intent we're seeing on the higher ones.
📌I keep my charts clean and simple because I believe clarity leads to better decisions.
📌My approach is built on years of experience and a solid track record. I don’t claim to know it all but I’m confident in my ability to spot high-probability setups.
📌If you would like to learn how to use the heatmap, cumulative volume delta and volume footprint techniques that I use below to determine very accurate demand regions, you can send me a private message. I help anyone who wants it completely free of charge.
🔑I have a long list of my proven technique below:
🎯 ZENUSDT.P: Patience & Profitability | %230 Reaction from the Sniper Entry
🐶 DOGEUSDT.P: Next Move
🎨 RENDERUSDT.P: Opportunity of the Month
💎 ETHUSDT.P: Where to Retrace
🟢 BNBUSDT.P: Potential Surge
📊 BTC Dominance: Reaction Zone
🌊 WAVESUSDT.P: Demand Zone Potential
🟣 UNIUSDT.P: Long-Term Trade
🔵 XRPUSDT.P: Entry Zones
🔗 LINKUSDT.P: Follow The River
📈 BTCUSDT.P: Two Key Demand Zones
🟩 POLUSDT: Bullish Momentum
🌟 PENDLEUSDT.P: Where Opportunity Meets Precision
🔥 BTCUSDT.P: Liquidation of Highly Leveraged Longs
🌊 SOLUSDT.P: SOL's Dip - Your Opportunity
🐸 1000PEPEUSDT.P: Prime Bounce Zone Unlocked
🚀 ETHUSDT.P: Set to Explode - Don't Miss This Game Changer
🤖 IQUSDT: Smart Plan
⚡️ PONDUSDT: A Trade Not Taken Is Better Than a Losing One
💼 STMXUSDT: 2 Buying Areas
🐢 TURBOUSDT: Buy Zones and Buyer Presence
🌍 ICPUSDT.P: Massive Upside Potential | Check the Trade Update For Seeing Results
🟠 IDEXUSDT: Spot Buy Area | %26 Profit if You Trade with MSB
📌 USUALUSDT: Buyers Are Active + %70 Profit in Total
🌟 FORTHUSDT: Sniper Entry +%26 Reaction
🐳 QKCUSDT: Sniper Entry +%57 Reaction
📊 BTC.D: Retest of Key Area Highly Likely
📊 XNOUSDT %80 Reaction with a Simple Blue Box!
📊 BELUSDT Amazing %120 Reaction!
📊 Simple Red Box, Extraordinary Results
📊 TIAUSDT | Still No Buyers—Maintaining a Bearish Outlook
📊 OGNUSDT | One of Today’s Highest Volume Gainers – +32.44%
📊 TRXUSDT - I Do My Thing Again
I stopped adding to the list because it's kinda tiring to add 5-10 charts in every move but you can check my profile and see that it goes on..

BTCUSDT | No Rejection Yet, Higher Targets in SightThe current price action is still leaning bullish. We haven’t seen a sharp rejection or breakdown from key structure — and until that happens, I expect the move to stretch toward the 107,600 region.
Volume remains consistent, and there’s subtle support in the lower timeframes. Buyers are holding their ground, and as long as that continues, the path of least resistance remains up.
Wait for price to disprove the idea before abandoning it. That’s how you stay ahead.
📌I keep my charts clean and simple because I believe clarity leads to better decisions.
📌My approach is built on years of experience and a solid track record. I don’t claim to know it all but I’m confident in my ability to spot high-probability setups.
📌If you would like to learn how to use the heatmap, cumulative volume delta and volume footprint techniques that I use below to determine very accurate demand regions, you can send me a private message. I help anyone who wants it completely free of charge.
🔑I have a long list of my proven technique below:
🎯 ZENUSDT.P: Patience & Profitability | %230 Reaction from the Sniper Entry
🐶 DOGEUSDT.P: Next Move
🎨 RENDERUSDT.P: Opportunity of the Month
💎 ETHUSDT.P: Where to Retrace
🟢 BNBUSDT.P: Potential Surge
📊 BTC Dominance: Reaction Zone
🌊 WAVESUSDT.P: Demand Zone Potential
🟣 UNIUSDT.P: Long-Term Trade
🔵 XRPUSDT.P: Entry Zones
🔗 LINKUSDT.P: Follow The River
📈 BTCUSDT.P: Two Key Demand Zones
🟩 POLUSDT: Bullish Momentum
🌟 PENDLEUSDT.P: Where Opportunity Meets Precision
🔥 BTCUSDT.P: Liquidation of Highly Leveraged Longs
🌊 SOLUSDT.P: SOL's Dip - Your Opportunity
🐸 1000PEPEUSDT.P: Prime Bounce Zone Unlocked
🚀 ETHUSDT.P: Set to Explode - Don't Miss This Game Changer
🤖 IQUSDT: Smart Plan
⚡️ PONDUSDT: A Trade Not Taken Is Better Than a Losing One
💼 STMXUSDT: 2 Buying Areas
🐢 TURBOUSDT: Buy Zones and Buyer Presence
🌍 ICPUSDT.P: Massive Upside Potential | Check the Trade Update For Seeing Results
🟠 IDEXUSDT: Spot Buy Area | %26 Profit if You Trade with MSB
📌 USUALUSDT: Buyers Are Active + %70 Profit in Total
🌟 FORTHUSDT: Sniper Entry +%26 Reaction
🐳 QKCUSDT: Sniper Entry +%57 Reaction
📊 BTC.D: Retest of Key Area Highly Likely
📊 XNOUSDT %80 Reaction with a Simple Blue Box!
📊 BELUSDT Amazing %120 Reaction!
📊 Simple Red Box, Extraordinary Results
📊 TIAUSDT | Still No Buyers—Maintaining a Bearish Outlook
📊 OGNUSDT | One of Today’s Highest Volume Gainers – +32.44%
I stopped adding to the list because it's kinda tiring to add 5-10 charts in every move but you can check my profile and see that it goes on..