BTCUSD Short SetupBTCUSD sell setup its risky one if drop from this supply then BTCUSD touch at price 22578 is that a good area of Rally base Rally
A demand area hit And pulback in Long term Bullish Move
Hopefully its working
Btctrading

Short BTC There is no better time than now to buy shorts with low risk. Note, we may have some fake failure that doesn't matter An obvious divergence is observed in the volume

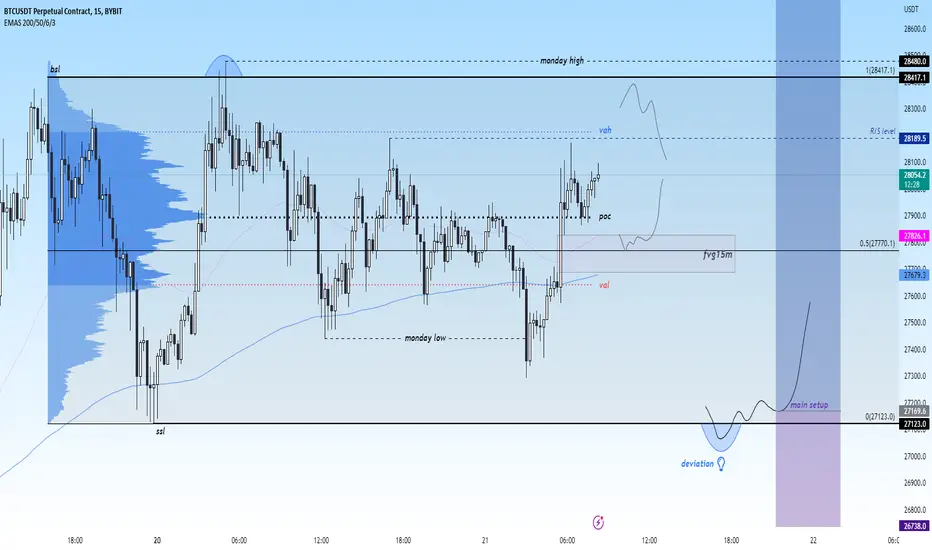
#BTC update...#BTC update...
I expected #Bitcoin to take out SSL first, to knock out the previous high... The dominance is currently strong...
I await this situation... For now, will continue scalping until main setup is reached...
Bitcoin longBitcoin bounced off the lower boundary of ascending channel. Bullish movement to resistance level at 28450 is possible.

BTC: Follow me, next target is 27K
The cryptocurrency market is one of the panic groups, as many institutions may still deposit with Silicon Valley Bank. With the announcement of the Federal Reserve's bottoming, the sentiment in the cryptocurrency market has stabilized slightly, and the concept of decentralized cryptocurrency has begun to play a safe-haven role as investors' distrust of the traditional banking industry deepens.
Under the dual stimuli of the safe-haven sentiment and the weakening of the US dollar, token prices have made breakthrough progress, and the Bitcoin price has broken through 25,000, a critical level since August 2022, with significant significance in the short-term trend. Bulls are expected to have further opportunities to test 28,000-30,000. If the market can reach 30,000, it will help to establish the real bottom.
Do you remember when we bought at the bottom and went long below 20K and were questioned and ridiculed by countless people? But we were fearless and firm in going long because we had already seen through the washing-out strategy of the main players. First, let all the longs in the market get out, and then rise straight up without giving any reaction time. You can say that this is a conspiracy, but I have already seen through it. The upward trend of the bulls has been established, and congratulations to friends who have followed my layout, that is, following the main players.
In the future market trend, don't think that Bitcoin will have much room for further decline because the main players will not give better opportunities to follow. If you missed the chance before, you can choose to buy Bitcoin near 24K. The next target is 27K, and reaching 30K is only a matter of time. I will also update the latest layout in a timely manner, so please continue to follow.

3 Hills an A Moutain PatternBTC is running 3 Hills and A mountain model?!
Currently correct form and proportions.
Next target is 30k

BTC IndexI think that wave 3 is not finished yet, so we have to wait for the end of the current correction and the completion of wave 3. In general, the trading map is as specified.
In general, it should be said that the conditions are not yet ready for big increases and I can say that we are currently in wave B of A B C.
Be successful and profitable

BTC Possible Scenario Hello dear traders. Hope you are having a fantastic day. I see BTC is forming an ABC correction wave before HUGE move up.
What do you think?
Please comment down below.

BTC push towards 19300 arealooking at the trendline break and retest, i am now looking for a push back into the 19300 support level zone

The Role of BTC in the Challenging Banking/Financial SituationUsing A2P Toolkit has been an excellent experience for trigger longs for many individuals, particularly in light of recent events. Bitcoin has hit a resistance level of 24500, leading to an increase in order flow in a "long" way related with the current situation of Coinbase, and SVB many users have found it beneficial to withdraw their money using Bitcoin as some banks acting as intermediaries are unavailable making it an ideal choice for those looking to complete transactions in a timely manner.
Don't forget to try the tool for free for over 2 weeks.

After the collapse of SVB Silicon Valley Bank...
The sequence of events leading up to the collapse of SVB Silicon Valley Bank is as follows:
SVB Silicon Valley Bank was one of the top 20 banks in the United States, with over 40 years of operation and total assets of $211.8 billion as of the end of 2022. As its name suggests, the bank primarily served technology startups and employees of large companies in Silicon Valley, and was the bank with the most deposits in the area.
On Thursday, March 9th, SVB Silicon Valley Bank announced a liquidity crisis. The stock price of its parent company, SVB Financial Group, plummeted by 60%, causing a sell-off in bank stocks and a simultaneous decline in the three major U.S. stock indices.
As news of the crisis spread, more and more institutional and high-net-worth clients rushed to withdraw their funds, causing a bank run that fueled panic and accelerated the bank's bankruptcy process.
In short, the bank's collapse was due to a combination of factors: taking in deposits at low interest rates, investing heavily in mortgage-backed securities (MBS), facing short-term liquidity constraints, selling MBS at a loss to stop the bleeding, and triggering a panic.
The SVB Silicon Valley Bank incident is directly related to the Federal Reserve's monetary policy and bank liquidity management. In response to the global pandemic in 2020, the Fed implemented unlimited quantitative easing (QE) and lowered interest rates to near 0%. Over the next two years, U.S. tech companies initiated a wave of share buybacks, and businesses took advantage of the low interest rates to raise large amounts of capital, which SVB absorbed in the form of deposits.
The bank used a significant portion of these deposits to engage in relative value trades, primarily in various types of U.S. bonds. More than 65% of SVB's deposits were invested in MBS, which was normally a safe practice as long as the securities were held until maturity. However, the problem arose when SVB over-invested in MBS and the Fed began to shift towards raising interest rates.
The Fed's aggressive interest rate hikes drastically changed the macroeconomic environment, pushing rates higher. Startups in Silicon Valley were no longer able to spend as lavishly, and there were more layoffs and closures. As interest rates rose, the interest paid to depositors also increased, putting pressure on the bank's short-term liquidity.
SVB had to sell its MBS holdings to raise cash, but by this time, market rates had risen from 0% to nearly 5% for two-year yields, causing the value of assets to plummet. SVB sold $21 billion worth of assets at a loss of $1.8 billion.
While SVB could have absorbed the loss of $1.8 billion, the bank still held more than $1 trillion in MBS, and a run on these securities could result in a loss of $15 billion, making SVB insolvent. Investors panicked in anticipation of this scenario.
Event impact
1.SVB announces bankruptcy without warning.
After panic spread, Silicon Valley Bank experienced a run on withdrawals of $420, causing an immediate liquidity crisis. The stock price of SVB Financial Group plummeted by 60% in a single day, crushing the management team's plan to sell stocks to save the company. The management team lost confidence and declared bankruptcy. Its stock price fell from $700 to $100 in just one year.
2.Chain reaction in stock and cryptocurrency markets.
Investors fear that other banks may also be suffering from the negative impact of the Federal Reserve's aggressive interest rate hikes and high rates, similar to the SVB Silicon Valley Bank incident. The negative sentiment has spread to the US banking industry, which is a core asset of the US stock market. The sell-off of bank stocks is a drag on the US stock market as a whole. At the same time, concerns about financing and liquidity for large tech companies have surfaced.
This event also affected the cryptocurrency market. It is difficult to say that there is no relationship between SVB Silicon Valley Bank and the cryptocurrency industry. Circle, the issuer of the stablecoin USDC, has announced that $3.3 billion in cash is deposited in Silicon Valley Bank, which accounts for approximately 8% of the USDC's $40 billion scale. For cryptocurrency companies that have not yet made an announcement, when will they collapse?
Market reaction
Currently, the SVB Silicon Valley Bank incident has mainly affected the US stock and cryptocurrency markets, with negative market sentiment.
The general decline in US bank stocks dragged down the three major US stock indices, with particular attention paid to the Dow Jones Industrial Average. The Dow Jones has been in a four-month consolidation phase in the 32,500-34,500 range, with a possible "double top" formation. This event has become the most critical factor in the Dow Jones' downward breakthrough. "The longer the accumulation, the faster the release." Going forward, attention should be paid to the Dow Jones' oscillating downward trend, with a target pointing towards the key level of 30,000.
Bitcoin prices fell below support at 22,000, but have since returned to above 20,000. In the short term, it is still necessary to closely monitor this support level. If the support is confirmed to be effective, the target will be 22,000. If the 20,000 support line is breached, it will return to a weak consolidation below 20,000, marking the end of the token's rebound. There is a possibility of further breaking through the new low of 18,000.
As the largest bankruptcy case in the US financial industry since the 2008 financial crisis, this event is not yet sufficient to cause systemic risk in the US financial industry, but local risk developments need to be monitored.
BITSTAMP:BTCUSD BINANCE:BTCUSDTPERP TVC:DJI

BITCOIN 1d ANALYSISHi, friends. Nice to meet you.
BITCOIN is at its most important point.
If it falls from the STRONG UPWARD TREND, it will be difficult for many candles to come up to the current branch.
If we do SupORT now, we expect a strong rise.
The bank run, various bad news, and the FOMC ICP announcement were very bad, but I personally hope that BITCOIN will rise.

BTC Where is support? 🤔Hello dear Traders. As you can see BTC doesn`t have any important support until 18.3K-18.8K zone. That zone is a good buy opportunity in my opinion.
What is your opinion?
Comment down below.

BITCOIN "make or break" According to Elliott Wave analysis, Bitcoin's fifth wave appears to have completed at a high of $25,250 and the price has fallen from that level. The key support level of $21,510 has been broken, as well as the Fibonacci level of 0.5 at $20,363. It's important to wait for a daily close to confirm whether the 0.618 Fibonacci level at $19,209 can hold as major sell-offs may occur if it fails. The potential levels to watch for are $17,567, $15,476, and $12,817. The golden ratio of 0.618 also supports the $19,209 level as a critical support.
It's worth noting that this Bitcoin collapse is driven by the actions of central banks of all countries, and if Bitcoin can survive the Fed rate hike, we may see a new all-time high. However, this remains to be seen and will depend on a range of economic and geopolitical factors. In summary, Bitcoin is currently experiencing a significant correction and it's important to keep an eye on the key support levels mentioned above to gauge its future direction.

Confused, how to chooseThe Bitcoin price has dropped below the 50-day moving average, turning it into a resistance level above the 23,000 mark. Currently, Bitcoin is losing momentum near the 22,000 level and its price is quite fragile. The lack of a clear path in the cryptocurrency market may be due to investors' focus on Powell's speech and clues of additional rate hikes. Therefore, the recent approach is conservative, as mentioned in the previous article.
With the upcoming release of some economic data, the market is somewhat anxious. As far as cryptocurrencies are concerned, higher interest rates have a negative impact on risk assets, as holding cryptocurrencies does not earn interest income. As Fed officials' further comments in Congress may affect the content of the March rate decision, Bitcoin prices will continue to be under pressure.
As Silvergate Capital becomes the latest victim of the overall trend of FTX, a drop below the 50-day moving average and the September high of $22,781 will intensify Bitcoin's downtrend. Therefore, attention should be paid to these two levels. With the Commodity Channel Index (CCI) dropping into the negative zone, technical indicators suggest that Bitcoin may be oversold. However, given that Bitcoin is hovering near the psychological support level of 22,000, a break below this level may further push the price down. The February low of $21,376 will be the next support level, and if it is broken, the market will refocus on the $20,000 mark.
On the other hand, if the Bitcoin price continues to rise, breaking through $22,000 and the September high could further push the price up. The next major resistance will be near $24,000.
How to position oneself before and after a breakthrough?
Welcome to the discussion channel, and we will continue to update ideas later

is BTC at risk ? ...!!!Hello dear Traders!
Fundamentals are not going well, technically still I am bullish till is it above the red line or in the grey area which is POINT OF INTEREST...

BTC Slow Bleeding Could End In A Catastrophic MoveBitcoin is slowly bleeding down and with todays news it could actually get volatile.
If we want to go lower before any retracement to the upside it could be all the way to 18.4 (big capitulation candle) or fill the gap (20400 to 20k) with a wick around 19.5 and bounce back up.
There is a big cluster of liquidation from 22.4 to 23.4 (near 8M) which shows a possible pullback there to grab those liquidation.
Bottom Line is Crash did not happen yet and is YET to happen.Longing is not recommended at all cause we could flood down.
DXY is looking very strong as SPX losing power day after day.
Details on Video
Please support the video in anyway you can by share,boost,comment

BTC High Timeframe Analysis Bullish case: golden cross, CME gaps at 29k and 35k.
Bearish case: long-term bearish continuation on OBV, CME gap at 20k, strongest area of support between 9.3k<->11.85k.

BTC - leading diagonalBTC about to pull another 5wave to the high, forming a leading dia 53535, pullback shall be longed.

Bitcoin Update - Full AnalysisDear followers,
I have been away from tradingview for some time as I have been focusing entirely on my own private channel, Pro Club. However, I have found the time to offer a full video analysis of what i think is happening with bitcoin right now. I hope you enjoy it.
Those wanting to find out more about Pro Club can visit my website missedamillion.club

Bitcoin is facing a key decisive battle, will the bulls rise?
As of the update, the current price of BTC/USDT is US222,438, and the daily performance still shows a short trend, but the current price has been maintained at a small fluctuation, not quantified, this situation is much like just after an unusually intense exercise, you need to calm down.The current position of the daily line near 22500 is the key. If it can stabilize at this position, then the price environment of BTC/USDT will be greatly improved; there is even an opportunity to rebound to the 23700 mark; and once the 22500 position cannot be held, then BTC may fall to the level of 22000 or even 21500.
Judging from the 4-hour chart, the price of BTC is gradually shifting upward, and the MACD technical indicators are gradually rising. However, in terms of strength, the short-term will not rise too high. It is estimated that there will be no major fluctuations in the first few days of this week, and it will run in the range of 22200-22700.
In order to facilitate you to continue to follow up on my analysis and sharing, you can like and follow me. In addition, you can enter my channel for free in the following ways to follow real-time views and operational strategies.
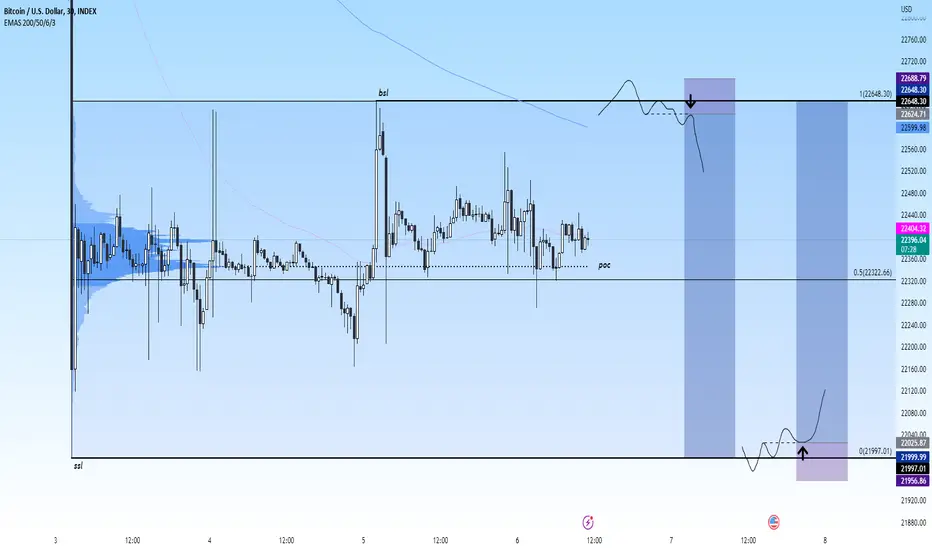
BTC update...#BTC update...
#Bitcoin is accumulation for bigger moves... Untill then scalp only...
On LTF i'm waiting for a position when BSL or SSL get swept out...
It's hard to wait for your trade, but it's worth it... Patience...
BTCUSDT ShortThe price has been forming an "m" pattern for the past few weeks and I am anticipating that the price might break out of the current pattern and continue with the bearish momentum.
The pattern broke out of the rising flag I had predicted earlier, which gives me the validation to sell the coin.
My entry is at $22000, Stop loss at $23000 and the target is $18000
My target R: R is 1: 4
